Multiple RSI
- 지표
- Harun Celik
- 버전: 1.0
- 활성화: 5
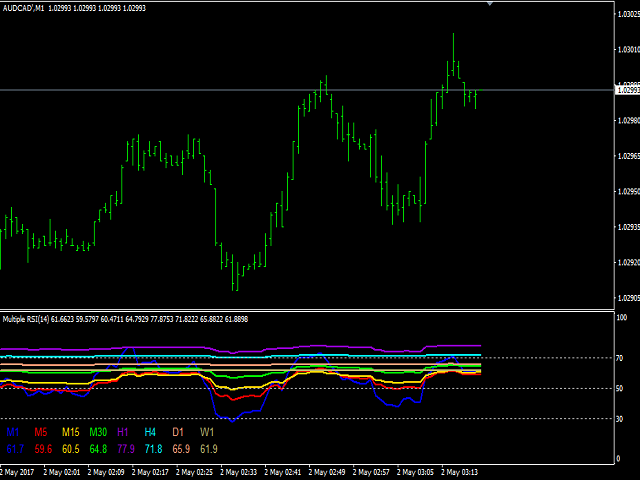
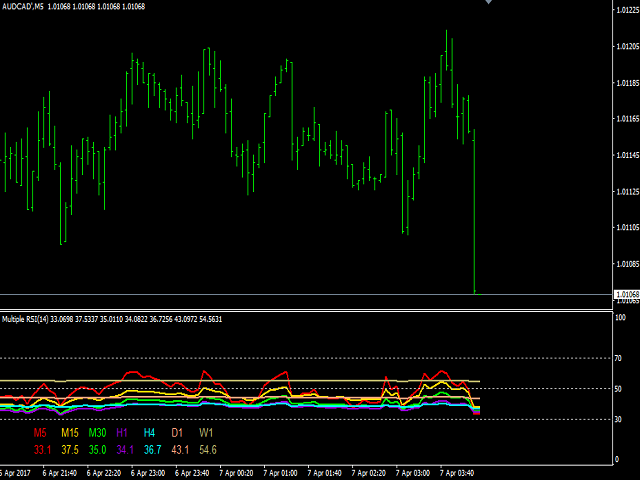
Multiple RSI indicator works based on the standard RSI indicator. This indicator will display the RSI indicator from different timeframes on one screen. You will see the RSI indicator for all timeframes on one screen.
This indicator saves you from constantly changing charts. At the same time you can analyze the operations of other graphs relative to each other.
Features
- This indicator shows the RSI graph of the timeframe you are working on and the upper timeframe graphs.
- For example, if you run this indicator on the M30 timeframe, it shows M30 and up.
- M1 shows all graphs at the same time.
- Timeframe selection feature.
- There is always the color setting of the lines.
- There is a width setting for the all timeframe lines.
Parameters
- RSIperiod - period setting for all graphs
- RSIprice - price mode for all graphs
- RSI_Price_note1 - close = 0, open = 1, high = 2, low = 3
- RSI_Price_note2 - median = 4, typical = 5, weighted = 6
- RSI_M1 - M1 timeframe on / off setting
- RSI_M5 - M5 timeframe on / off setting
- RSI_M15 - M15 timeframe on / off setting
- RSI_M30 - M30 timeframe on / off setting
- RSI_M60 - H1 timeframe on / off setting
- RSI_M240 - H4 timeframe on / off setting
- RSI_M1440 - D1 timeframe on / off setting
- RSI_M10080 - W1 timeframe on / off setting
- M1_color - M1 timeframe color setting
- M5_color - M5 timeframe color setting
- M15_color - M15 timeframe color setting
- M30_color - M30 timeframe color setting
- M60_color - H1 timeframe color setting
- M240_color - H4 timeframe color setting
- M1440_color - D1 timeframe color setting
- M10080_color - W1 timeframe color setting
- M1_widht - M1 timeframe width setting
- M5_widht - M5 timeframe width setting
- M15_widht - M15 timeframe width setting
- M30_widht - M30 timeframe width setting
- M60_widht - H1 timeframe width setting
- M240_widht - H4 timeframe width setting
- M1440_widht - D1 timeframe width setting
- M10080_widht - W1 timeframe width setting










사용자가 평가에 대한 코멘트를 남기지 않았습니다