• 미리보기
  • 리뷰 (2)
  • 코멘트 (3)
  • 새 소식

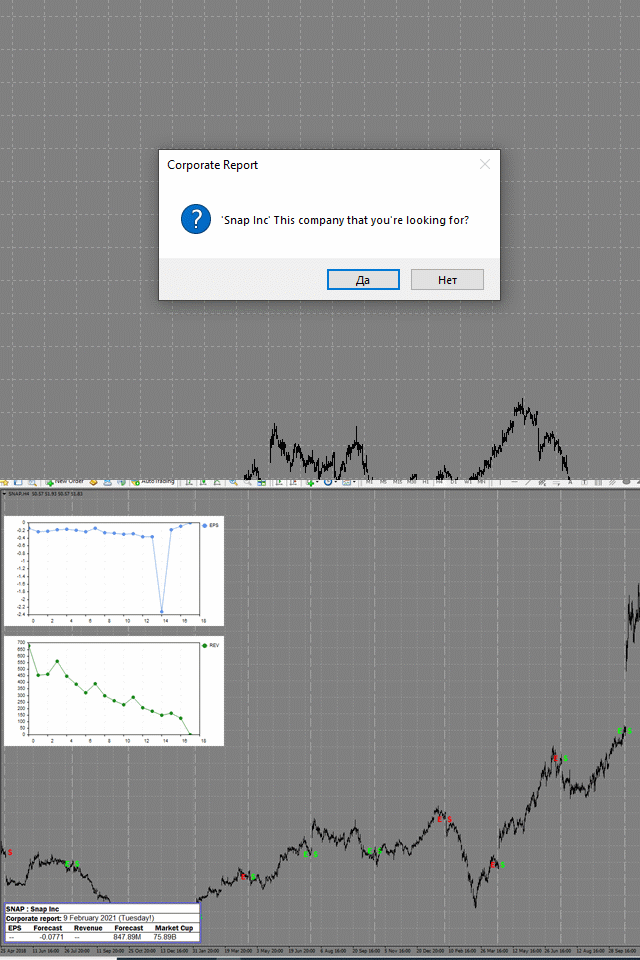
Corporate Report MT5

5

The script displays info about the share's corporate reports and dividends. The data is downloaded from investing.com:

  • Report date
  • Profit per share (EPS)
  • Revenue
  • Market capitalization
  • Amount of dividends
  • Date of payment of dividends
  • Dividend income
The product cannot be tested in the tester (since it is not possible to receive data from the Internet).

Before launching: 
Add 2 URL https://ru.investing.com/earnings-calendar/Service/getCalendarFilteredData and https://ru.investing.com/dividends-calendar/Service/getCalendarFilteredData to the list of allowed URLs. Options -> Expert Advisors -> enable "Allow WebRequest for listed URL".


The program works the following way:

  • Searches for information on the ticker on which the program is running.
    If the data is not found, it offers to use the search.
    Search by ticker - the ticker must be written in quotation marks, for example: "BA" or "ba".
    Search by company name - the company name should be written without quotation marks, for example: Apple or ford.
    All found options are displayed in the "Experts" tab.
    To display data on the chart, you need to enter the found number from the Experts tab (which is in square brackets) with the sign # for example: № 241 or #241.
    The numbers you have entered are remembered.
    if you want to change the previously selected number, then when the program asks "is this the right company?", you need to click no, and then find and enter a new number.
    to clear all pinned numbers, delete the "Custom Ticker List" file at the path "MQL5\Files\Corporate Report".
  • While searching for information, the background of the graph changes color to blue.
  • Plotting vertical lines corresponding to dates of the published reports about a dividends.
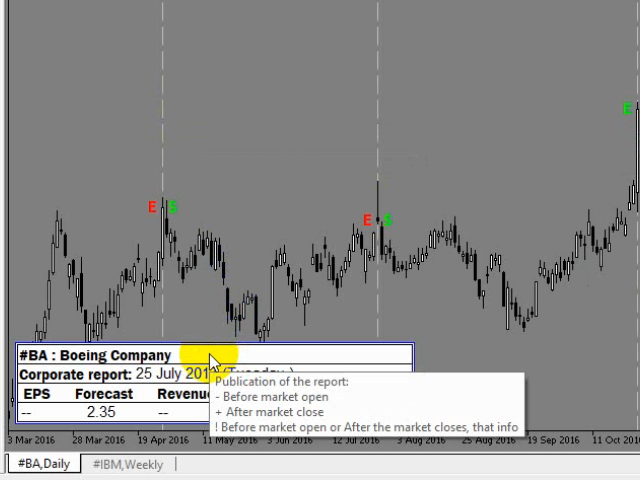
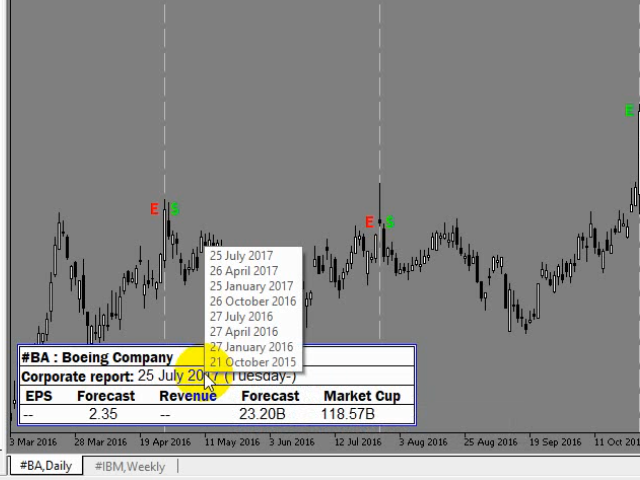
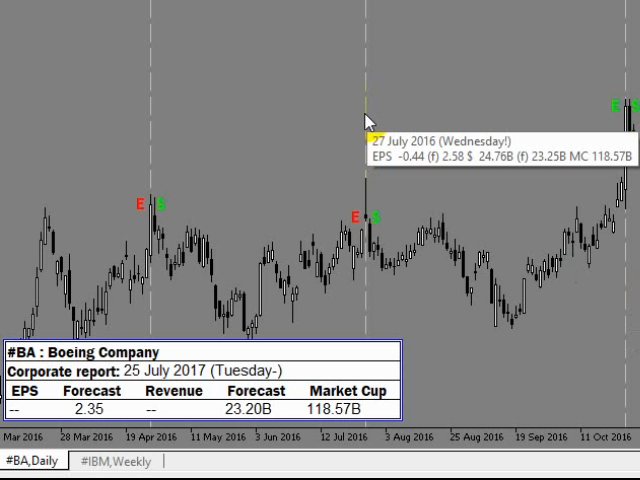
  • Plotting vertical lines corresponding to dates of the published corporate reports. The tooltip of each of the lines contains data on the appropriate corporate report.
    • The E and $ marks are assigned to vertical lines:
    • if EPS value exceeds the forecast, the green E mark is used,
    • if expectations are not met, the red one is used;
    • if Revenue exceeds the forecast, the green $ mark is used,
    • if expectations are not met, the red one is used.
  • The table at the bottom left displays: the ticker (on which the program has been launched) and company name (corresponds to the one downloaded from the website),
    date and info on the expected report as well as the one published not earlier than 5 days ago.
    (5 days after releasing the report, it is moved to the chart as a vertical line and a search for the next report date starts.)
  • The +, - and ! marks at the report date specify the report issue time as follows:
    • Report issue:
    • - Before the market opening,
    • + After the market closure,
    • ! No data.
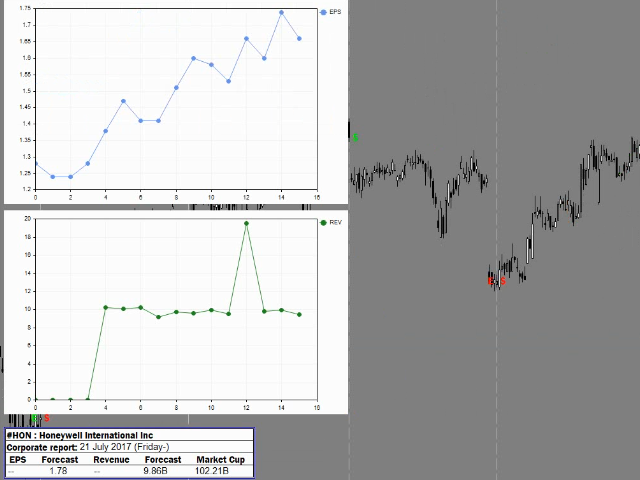
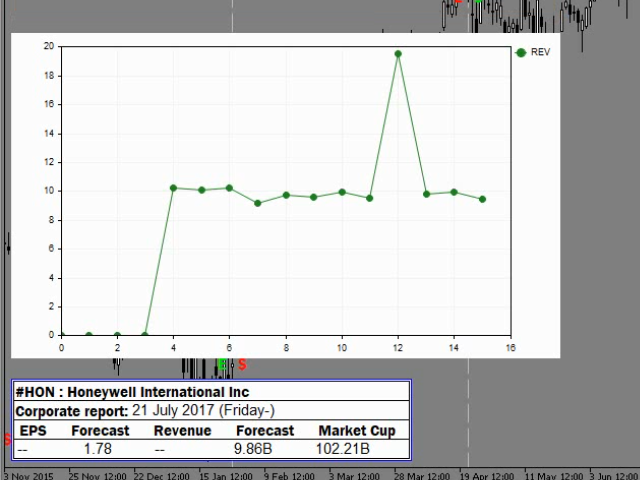
  • Company indicator graphs are displayed on the chart (EPS and Revenue $). The graphs are plotted based on the downloaded reports and data present in the downloaded reports. If some report is missing on the website, the graph is based on available ones. If some indicator is missing in the downloaded report, its value is assumed to be zero on the graph. The graphs can be moved or deleted. Reports located in the table at the bottom left are not considered by the graphs. Only the ones displayed as horizontal lines on the chart are considered instead.
  • The program works in English and Russian.

List of instruments (shares, stock, CFD, ADR) the program works with: 18 054 tickers; The list contains tickers of 80 countries.
The monitor vertical resolution of 900 or more is recommended when using the program for more comfortable trading.

The program and all the information used in it depend on the site investing.com and they work as long as it is possible to get information programmatically from the specified links.
For more convenience, assign a hotkey to the script: right-click "Corporate Report" in the Navigator window -> Set hotkey -> select a suitable combination.


리뷰 2
all2me
66
all2me 2021.03.10 00:41 
 

Удобный и простой в использовании инструмент для тех кому важна информация об отчетах и нет желания тратить время на ее изучение в других приложениях. Автор быстро и информативно отвечает на вопросы, при этом оказывает содействие в дополнительных настройках.

추천 제품
E2C Lines
Eduardo Cristian De Carvalho
Descubra o poder do nosso indicador de alta precisão, projetado para identificar as regiões de alvo e exaustão de qualquer ativo. Testado e validado por mais de 3 anos nos mercados de mini dólar e mini índice, ele oferece confiabilidade e eficácia incomparáveis. Transforme sua estratégia de trading e alcance novos patamares de sucesso com nossa ferramenta inovadora.
Binary Profit Gainer
Myo Min Aung
5 (1)
This indicator is especially for the binary trading. Time frame is 1 minutes and exp time 5 or 3 minutes only. You must be use martingale 3 step. So you must put lots size is 10 % at most. You should use Mt2 trading platform to connect with my indicator to get more signal without human working. This indicator wining rate is over 80% but you may get 100% of profit by using martingale 3 step. You should use MT2 Trading Platform to connect meta trader platform and binary platform . You can get mt2
FREE
Binance Full Trader is developed for connection to your Binance account and get data, draw price charts and trade easily with any strategy by an indicator. A user-friendly interface has developed for it and has tried to give access to the necessary information such as open orders and wallet balances. ·        There are two sample indicators (one for trade signal and another for price) that you can download it from these links: https://drive.google.com/file/d/1w2CGuu3rArWKMhS9LkepT9zhVkGR1AO7/vie
Pyramid OM
Sergei Makarevich
Pyramid Order Manager is a utility based on the work of two indicators SM ZigZag and SM trend cloud . With the help of this utility, the trader has the opportunity to set instant or pending orders on the chart in a short time with his lot, take profit and stop loss, as well as the number of orders in the grid, the coefficients of the lot and step change. The utility has two built-in indicators, listed above, with the ability to disable them. A distinctive feature of this utility is the poss
The indicator detects and displays М. Gartley's Butterfly pattern. The pattern is plotted by the extreme values of the ZigZag indicator (included in the resources, no need to install). After detecting the pattern, the indicator notifies of that by the pop-up window, a mobile notification and an email. The pattern and wave parameters are displayed on the screenshots. The default parameters are used for demonstration purposes only in order to increase the amount of detected patterns. Parameters
Introduction to X3 Chart Pattern Scanner X3 Cherart Pattern Scanner is the non-repainting and non-lagging indicator detecting X3 chart patterns including Harmonic pattern, Elliott Wave pattern, X3 patterns, and Japanese Candlestick patterns. Historical patterns match with signal patterns. Hence, you can readily develop the solid trading strategy in your chart. More importantly, this superb pattern scanner can detect the optimal pattern of its kind. In addition, you can switch on and off individu
Trend Catcher with Alert MT5
Issam Kassas
4.67 (70)
트렌드 캐쳐: 알림 인디케이터와 함께 하는 트렌드 캐쳐 전략은 시장 트렌드와 잠재적인 진입 및 체크 포인트를 식별하는 데 도움이 되는 다목적 기술 분석 도구입니다. 이는 시장 상황에 적응하여 트렌드 방향을 명확하게 시각적으로 표현하는 동적 트렌드 캐쳐 전략을 제공합니다. 트레이더는 선호도와 위험 허용도에 맞게 매개변수를 사용자 정의할 수 있습니다. 이 인디케이터는 트렌드 식별을 지원하고 잠재적인 반전을 신호로 제공하며 트레일링 스탑 메커니즘으로 작동하며 실시간 경고를 제공하여 신속한 시장 대응을 돕습니다. 특징: - 트렌드 식별: 상승 트렌드와 하락 트렌드를 신호합니다. - 트렌드 반전: 양봉 색상이 상승에서 하락으로 변경되거나 그 반대의 경우 잠재적인 반전을 경고합니다. - 실시간 경고: 새로운 트렌드 식별을 위한 경고를 생성합니다. 추천사항: - 통화 및 페어: EURUSD, AUDUSD, XAUUSD 등... - 시간 프레임: H1. - 계정 유형: 모든 E
FREE
Free automatic Fibonacci is an indicator that automatically plots a Fibonacci retracement based on the number of bars you select on the BarsToScan setting in the indicator. The Fibonacci is automatically updated in real time as new highest and lowest values appears amongst the selected bars. You can select which level values to be displayed in the indicator settings. You can also select the color of the levels thus enabling the trader to be able to attach the indicator several times with differe
FREE
Important Lines
Terence Gronowski
4.86 (21)
This indicator displays Pivot-Lines, preday high and low, preday close and the minimum and maximum of the previous hour. You just have to put this single indicator to the chart to have all these important lines, no need to setup many single indicators. Why certain lines are important Preday high and low : These are watched by traders who trade in a daily chart. Very often, if price climbs over or falls under a preday low/high there is an acceleration in buying/selling. It is a breakout out of
FREE
My PVSR
Ashok Kumar Singha
My PVSR   is based on All Type of Pivot Points. Use this Indicator to get proper Support / Resistance Zone and Trade accordingly.. Recommendation: Use this Indicator along with my another Indicator --->>> Dr. Trend   <<<--- Click Here ; To get the best output result feel free to contact me ; Best of Luck It can be used for: All Pairs: Forex, Cryptocurrencies, Metals, Stocks, Indices etc. All Timeframe All Brokers All type of Trading Style like Scalping, Swing, Intraday, Short-Term, Lon
Introducing the Precision Data Extractor: EMA , an MQL5 utility crafted for traders, analysts and quants who need accurate historical data to build robust datasets. This tool lets you selectively pull historical price and indicator data— Exponential Moving Average ( EMA )—from multiple applied prices , timeframes , and periods , then stores it in a CSV format, making it easy to feed into machine learning models, trading algorithms, or in-depth market analyses . Compatible with Forex, Stocks, and
Easy GOLD MT5
Franck Martin
3.97 (31)
Easy Gold is the latest addition to the BotGPT family. It is surprising and very powerful. It is ideal for beginners due to its simplicity.  There is absolutely nothing to do, it's 100% automated, simply indicate the percentage of risk you want to take per trade and the EA is ready. Whatever your capital, the EA takes care of everything. Optimized on (XAUUSD).  Unleash all the power with the professional version (AGI Gold) and its connection to the neural network, available in my store. My othe
FREE
XCalper CandleTimer
Aecio de Feo Flora Neto
4.62 (13)
This auxiliary indicator displays time left before closing on the current timeframe with continuous update . It also shows the last trade price and variation from a previous day close in percentage and points. This indicator is pretty handy for daytraders and scalpers who want to precisely monitor closing and opening of candles. Indicator parameters Show in shifted end - Default: False. Display time and values on screen. If True, Displays only time to close aside last candle. Distance from the
FREE
Introducing the BlackWing Signal Provider—an advanced EA designed to enhance your trading experience by facilitating seamless communication between your MetaTrader 5 platform and Telegram channels, groups, or individual users. Key Features: 1. Real-Time Event Notifications: Receive instant alerts on new trades, modified orders, closed positions, and deleted orders. Stay informed and make well-timed decisions. 2. Interactive Chart Snapshots: Share chart snapshots along with new trades and
Magic EA MT5
Kyra Nickaline Watson-gordon
Magic EA is an Expert Advisor based on Scalping, Elliot Waves and with filters such as RSI, Stochastic and 3 other strategies managed and decided with the robot smartly. Large number of inputs and settings are tested and optimized and embedded in the program thus inputs are limited and very simple. Using EA doesn't need any professional information or Forex Trading Knowledge. EA can trade on all symbols and all time frames, using special and unique strategies developed by the author. The EA
The utility displays the order book, as well as increases its depth, remembering the location of applications that have gone beyond the current "window" view. With the utility user can perform quick trading actions in one click - placing/cancelling/editing of explicit and hidden orders, and also opening/editing positions. Utility features The orders book display works only on those trading symbols for which it is broadcast by the broker. To reset the information about the rows that were record
Matreshka
Dimitr Trifonov
5 (2)
Matreshka self-testing and self-optimizing indicator: 1. Is an interpretation of the Elliott Wave Analysis Theory. 2. Based on the principle of the indicator type ZigZag, and the waves are based on the principle of interpretation of the theory of DeMark. 3. Filters waves in length and height. 4. Draws up to six levels of ZigZag at the same time, tracking waves of different orders. 5. Marks Pulsed and Recoil Waves. 6. Draws arrows to open positions 7. Draws three channels. 8. Notes support and re
Countdown Candle Close
Sid Ali Temkit
3 (1)
The Candle Countdown Timer for MetaTrader 4 (also available for MT5) is a vital indicator designed to help you manage your trading time effectively. It keeps you updated about market open and close times by displaying the remaining time before the current candle closes and a new one forms. This powerful tool enables you to make well-informed trading decisions. Key Features: Asia Range: Comes with an option to extend the range. Broker Time, New York, London Time: Displays the current broker time
FREE
Harmo EA
Matteo Schizzerotto
수익성이 높은 조화 패턴을 자동으로 찾아낼 수 있는 트레이딩 도우미를 갖고 싶었던 적이 있습니까? 우리는 외환 세계의 조화 패턴을 기반으로 한 혁신적인 전문 자문을 자랑스럽게 소개합니다. 우리의 Expert Advisor는 금융 시장 데이터를 분석하고 가장 수익성이 높은 거래 신호를 식별하도록 특별히 설계된 고급 알고리즘으로 구동되는 정교한 소프트웨어입니다. 놀라운 정확성을 갖춘 이 강력한 기술은 외환 시장에서 상당한 수익 기회를 제공하는 것으로 유명한 조화 패턴을 실시간으로 찾아낼 수 있습니다. 그러면 고조파 패턴이란 무엇입니까? 이는 수학적, 기하학적 원리에 기초하여 미리 결정된 패턴을 따르는 가격 형성입니다. 이러한 고유한 패턴은 가격 변동에 반영되며 거래자에게 추세 반전 또는 추세 지속 단계를 예측할 수 있는 능력을 제공합니다. 우리의 전문가 고문은 이러한 귀중한 형성을 빠르고 정확하게 식별하고 적시에 거래 신호를 거래자에게 보낼 수 있습니다. 이는 귀하가 정보에
Order Book, known also as Market Book, market depth, Level 2, - is a dynamically updated table with current volumes of orders to buy and to sell specific financial instument at price levels near Bid and Ask. MetaTrader 5 provides the means for receiving market book from your broker, but in real time only, without access to its history. The indicator OrderBook Cumulative Indicator accumulates market book data online and visualizes them on the chart. In addition, the indicator can show the market
Market Screener
Andrey Khatimlianskii
5 (1)
Professional tool for professional traders It allows you to browse all available financial instruments and select best ones to trade with lightning speed. Fastest market screening ever Move your mouse over the instruments and instantly see 3 charts with selected timeframes and predefined indicators! Click on the symbol name to hold it. Use UP and DOWN keys to select previous /  next instrument. Ultimate charting Smooth scale, automatic indicator lines width, smart grid and much more. You'll
Advanced Entry Bot
Jacob Nickolaus A Torres
This bot is designed to compliment your existing trading strategy.  The Advanced Entry Bot is NOT FULLY AUTOMATED. Once the user finds an area of interest, he or she can set the bot to BUY or SELL and input their area of interest into the settings. In essence, this bot enables traders to do their analysis of the market; then utilize the Advanced Entry Bot to benefit from a mechanical and automated system that takes entries once price reaches their area of interest. I created this bot as a way to
Pattern 123 MT5
Pavel Verveyko
"Pattern 123" is an indicator-a trading system built on a popular pattern, pattern 123. This is the moment when we expect a reversal on the older trend and enter the continuation of the small trend, its 3rd impulse. The indicator displays signals and markings on an open chart. You can enable/disable graphical constructions in the settings. The indicator has a built-in notification system   (email, mobile terminal, standard terminal alert). "Pattern 123" has a table that displays signals fr
Crash and Boom Panel
Harifidy Razafindranaivo
INTRODUCTION : This new brand product is an application capable of catching spikes automatically in real time of trade session. The report of the test shows how this panel brings a great profitable advantage in action. This robot functions autonomousely with a minimum risk. This trading Panel permits users to proceed a Copy trading. IMPORTANT : It is recommended to use Virtual Hosting Server VPS to optimize the trading Panel methods implemented and to operate 24h a day. REQUIREMENTS : R
Ferramenta derivada do DR Assistant, a versão Lite conta com recursos semelhantes, mas sendo mais específica em sua aplicação, destina-se exclusivamente ao uso para gestão de ordens abertas a partir de suas funções. Deste modo, quaisquer outras negociações ou posições abertas por outras ferramentas ou manuais serão ignoradas pelo Assitant Lite. Os parâmetros e configurações disponíveis, bem como suas principais funções são: - Take Profit e Stop Loss: duas opções de Steps, em pontos, para ambas a
Neowave Chart Plotter
Bahador Baradari
5 (1)
This Expert Advisor is applicable to plot wave charts as per the NeoWave  method (Neely Extension of Wave Theory).  NeoWave is a scientific, objective and revolutionary style of Elliott Wave Theory that was invented by Glenn Neely in 1990 in the “Mastering Elliott Wave” book. To start analyzing with this method, we need a particular chart called the Wave Chart or Cash Data chart . This is the first step for a good wave analysis. To draw this chart, Highs and Lows should be plotted in the order t
다윈IA 실버 등급 95.09 - 월 할당량 145,000 € - 2024년 7월 다윈엑스 제로에서 사용하기 위해 단 한 장만 판매되는 독점적인 유일무이한 전문가입니다. 다윈엑스에서는 카피 거래에 대한 엄격한 통제가 있기 때문에 독점 전문가를 사용해야 합니다. 이 전문가는 다윈엑스의 규칙과 기대치를 완벽하게 준수합니다. 이 전문가는 가격 움직임, 강도 및 추세를 꼼꼼하게 분석하는 헌터 역할을 합니다. 놀라운 효과로 작업을 수행할 최적의 기회를 참을성 있게 기다립니다. 전문가 전략은 가격 행동, 스마트 머니 개념(SMC), 피보나치에 기반을 두고 가장 중요한 가격 변동을 타겟팅하고 가장 유망한 기회를 포착합니다. 또한 이 엑스퍼트는 자체 개발자가 만든 몇 가지 독점 지표를 사용합니다. 주의 1 회 구매 후이 전문가는 시장에서 숨겨집니다. 지난 6개월 동안의 백테스팅 결과 95.09 의 등급을 받았으며, 이는 월 145,000 유로의 할당을 보장합니다. 이 성능은 이전 백테
INTRODUCTION : This new Panel is a fully application who runs without interruption to catch the spikes with just a  simple one click. It works 24h/24 and 7/7. This application runs with a minimum risk. It's a best Users Graphical Panel for a professional trader. This last one works only with Crash and Boom 600 index. This trading Panel permits Users to proceed a Copy trading. IMPORTANT : It is recommended to use Virtual Hosting Server VPS to optimise the trading Panel methods implemented and
Drawdown Manager by Ofx
Osama Essameldin Ibrahim Abdelaal
In the ebb and flow of financial markets, the Drawdown Manager (by Ofx) stands out as an essential companion for traders utilizing grid and martingale strategies. This innovative tool is engineered to provide an analytical approach to managing trading drawdowns. By selectively utilizing floating and realized profits, the DDM tactically help traders control their drawdown exposure during market downturns. Its customizable settings empower traders with the flexibility to adjust operations accordi
Seasonal Pattern Trader
Dominik Patrick Doser
Disclaimer : Keep in mind that seasonal patterns are not always reliable. Therefore, thoughtful risk management is crucial to minimize losses.  Seasonal patterns in the financial world are like a well-guarded secret that successful investors use to their advantage. These patterns are recurring price movements that occur during specific periods or around special events. Additionally, there are also intraday patterns that repeat. For example, Uncle Ted from Forex Family suggests examining previou
이 제품의 구매자들이 또한 구매함
$450 (-20%) instead of $565 until 11/29 B e sure to watch this video before using A community for users, product discussion, update news, and first line of support  Use Webmoney For payments in cryptocurrencies. How I use this algo tool   Lazy Trader is NOT SUITABLE FOR SCALPING EVERY MINUTE MOVEMENT, ESPECIALLY IN CRYPTO. WITHOUT UNDERSTANDING WHAT IS HAPPENING ON THE CHART, THERE IS NO POINT IN BLINDLY HOPING FOR PROFITS! Lazy Trader does NOT USE openAI chat-gpt-4 technologies, which are ad
Unlimited Trade Copier Pro MT5 is a tool to copy trade remotely to multiple MT4, MT5 and cTrader accounts at different computers/locations over internet. This is an ideal solution for you if you are a signal provider and want to copy your trades to other receivers globally on your own rules. One provider can copy trades to multiple receivers and one receiver can get trade from multiple providers as well. The provider can even set the subscription expiry for each receiver, so that receiver will n
YuClusters
Yury Kulikov
4.93 (41)
Attention: You can view the program operation in the free version  YuClusters DEMO .  YuClusters is a professional market analysis system. The trader has unique opportunities to analyze the flow of orders, trade volumes, price movements using various charts, profiles, indicators, and graphical objects. YuClusters operates on data based on Time&Sales or ticks information, depending on what is available in the quotes of a financial instrument. YuClusters allows you to build graphs by combining da
Mentfx Mmanage mt5
Anton Jere Calmes
4.25 (8)
The added video will showcase all functionality, effectiveness, and uses of the trade manager. Drag and Drop Trade Manager. Draw your entry and have the tool calculate the rest. Advanced targeting and close portions of a trade directly available in tool (manage trades while you sleep). Market order or limit order on either side with factored spread. Just draw the entry, the tool does the rest. Hotkey setup to make it simple. Draw where you want to enter, and the stop loss, the tool calculates al
The  Easy Strategy Builder (ESB)  is a " Do It Yourself " solution that allows you to create a wide range of the automated trading strategies without any line of codes. This is the world’s easiest method to automate your strategies that can be used in STP, ECN and FIFO brokers. No drag and drop is needed. Just by set conditions of your trading strategy and change settings on desired values and let it work in your account. ESB has hundreds of modules to define unlimited possibilities of strategi
Trading Chaos Expert
Gennadiy Stanilevych
5 (10)
This software has no equals in the world and represents a universal trade "console" covering trading signals, automated market entry, setting of Stop Loss and Take Profit, as well as Trailing Profit for multiple trades at the same time in a single open window. Intuitive control of the Expert Advisor in "three clicks" ensures a comprehensive use of all its functions on different computers, including tablets PCs. Interacting with additional signal indicators that mark the chart to give a real mark
Binance Future용 Mt5 봇(전문가) 시스템은 Binance Future 시장에서 실행됩니다. 이를 자신의 코드에 쉽게 통합하여 작업을 자동화할 수 있습니다. 수동 조작 패널을 사용할 수 있습니다. 헤지 모드 호환. 모든 작업은 화면에서 수동으로 수행할 수 있습니다. 많은 암호화폐를 동시에 제어하는 가장 효과적인 방법입니다. 화면은 바이낸스 화면이 있는 템플릿 형식입니다. 링크에서 템플릿 파일을 다운로드할 수 있습니다. https://drive.google.com/file/d/1WHqGhym0QIK31l7kwfit9_tXb7YbqSuT/view?usp=sharing 이 프로그램은 설치가 필요합니다. https://www.mql5.com/tr/market/product/68694 https://www.mql5.com/tr/market/product/73887 매개변수 API 키 = 바이낸스 API 키 비밀 키 =
Hedge Ninja
Robert Mathias Bernt Larsson
3 (2)
Make sure to join our Discord community over at www.Robertsfx.com , you can also buy the EA at robertsfx.com WIN NO MATTER IN WHICH DIRECTION THE PRICE MOVES This robot wins no matter in which direction the price moves by following changing direction depending on in which direction price moves. This is the most free way of trading to this date. So you win no matter which direction it moves (when price moves to either of the red lines as seen on the screenshot, it wins with the profit target yo
HYT utility
Sergey Batudayev
5 (1)
HYT (Help Your Trading) is a tool designed to help you average down your losing positions using two main techniques: Standard averaging . Hedging with subsequent opening of positions in the direction of the trend . Buy 1 and 1 get FREE This tool allows you to manage multiple positions opened in different directions, both for buying and selling. HYT automatically calculates the size of the next position , order price, direction for averaging, and closing the position with a specified take-profit
News Trade EA MT5
Konstantin Kulikov
4.5 (10)
제가 몇 년 동안 사용하고 있는 유용한 로봇을 소개드립니다. 반자동뿐만 아니라 자동 모드로도 사용할 수 있습니다. 본 프로그램에는 경제 캘린더의 뉴스별로 유연한 거래 설정이 포함되어 있습니다. 전략 테스터에서 확인할 수 없습니다. 진짜 작업뿐입니다. 터미널 설정에서 허용된 URL 목록에 뉴스 사이트를 추가해야 합니다. 서비스>설정 > 조언자>를 클릭합니다. "다음 URL에 대해 WebRequest 허용:" 확인란을 선택합니다. 다음을 추가합니다 (공백 삭제): https://  nfs.faireconomy.media 자동 모드 시 기본 설정 관리: https://www.mql5.com/ko/signals/1447007 . 동일한 결과를 얻으려면 임의 기간 (기간이 얼마정도인지 상관 없음)의 GBPUSD 차트에 전문가를 첨부하십시오. 이 전문가를 위해 고유 설정 세트를 만들 때 블로그의 모든 매개변수에 대한 설명을 참조하십시오: https://www.mql5.com/en/
Attention: this is a multicurrency EA, which trades by several pairs from one chart!  Therefore, in order to avoid duplicate trades, it is necessary to attach EA only to one chart, ---> all trading in all pairs is conducted only from one chart! we can trade simultaneously in three different pairs, as by default (EURUSD + GBPUSD + AUDUSD), which take into account the correlation when entering the market for all three; we can trade only EURUSD (or any currency pair) and at the same time take into
Adam FTMO MT5
Vyacheslav Izvarin
5 (2)
ADAM EA Special Version for FTMO Please use ShowInfo= false for backtesting ! Our 1st EA created using ChatGPT technology Trade only GOOD and checked PROP FIRMS  Default parameters for Challenge $100,000 Tested on EURUSD and GBPUSD only  Use 15MIN Time Frame Close all deals and Auto-trading  before Weekend at 12:00 GMT+3  Friday For Prop Firms MUST use special Protector  https://www.mql5.com/en/market/product/94362 -------------------------------------------------------------------------------
GRat Crypto
Ivan Titov
4.5 (2)
Trade on crypto exchanges in MT5! GRat_Crypto is a tool for manual and automated trading , including ANY available EA, ANY  cryptocurrency  on most popular crypto exchanges in the familiar MT5 environment 24/7. Features 1. ALL instruments of the 8 most popular crypto exchanges are available: Binance, BingX, Bybit, CommEX, Kraken,   KuCoin, MEXC and OKX . 2. The ability to place ANY type of order available in MT5, both market and pending, to modify orders and positions, to delete orders and clos
In trading, losses are inevitable, but they can be managed effectively with the right tools. Lock Guard    can be used for insuring positions in manual trading or as an addition to another robot. It is a powerful tool for saving a trader's main positions because it can prevent losses from getting out of hand. Lock Guard is a trading tool that helps manage losses by automatically placing pending stop orders, which act as counter orders that become market orders when the price moves against t
Trade like a time traveler thanks to latency arbitrage Everyone knows that the best way to make money in the markets is by knowing the future. Have you ever wished to know the future price of something in advance? Even if it were just a few days, hours, or minutes ahead? What if it were possible to know it but with less than a second of advance notice? That's precisely what the PZ Latency Arbitrage EA robot does. PZ Latency Arbitrage EA is your personal time machine: but it can only travel into
Dear traders and investors! We present to you the MT5 Optimization Booster – an innovative product that will revolutionize your optimization experience on MetaTrader 5! The MT5 Optimization Booster is based on the innovative Quantum Swap Protocol (QSP) algorithm – a unique proprietary optimization strategy that forms the core of the product and elevates the process of finding optimal solutions to a new level. After the purchase , be sure to contact me . The product is designed to enhance the
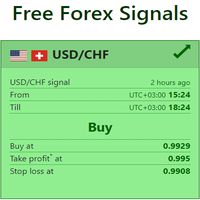
Live Forex Signals 사이트 신호에 거래를 위해 설계   https://live-forex-signals.com/en 그리고  https://foresignal.com/en . Live Forex Signal for MetaTrader 4   https://www.mql5.com/en/market/product/81445 매개 변수 사용자 이름 및 암호는 사이트에 가입 한 경우 live-forex-signals.com/foresignal.com 구독이 없으면 필드를 비워 둡니다; 댓글 개설 된 거래에 대한 댓글 위험 위험 거래에 대한 예금의 백분율로,위험=0 인 경우,다음 값 많이 사용됩니다 거래에 대한 많은 고정 볼륨 사이트에서 이익을 가져 가라 웹 사이트에서 정지 손실을 사용 빈도신호업데이트고문의 사이트 방문 빈도 분 최대 스프레드무역에 허용되는 최대 스프레드를 거래합니다.스프레드가 더 높으면 보류 중인 주문 세트가 취소됩니다 사용트레일링 사용 후행 정지 트레일
Spike Auto Catcher
Harifidy Razafindranaivo
INTRODUCTION : This Panel is made to detect the spike presence and opens trade transaction automatically after providing  a signal of control to operate autonomiousely the trade. It is a best scalper and a good spike catcher.   IMPORTANT : It is recommended to use Virtual Hosting Server VPS to optimize the methods implemented and to operate 24h a day. REQUIREMENTS : Relevant Terminal : Metatrader 5 - MT5. Brokers : Deriv Ltd and Others. Currency : Boom and Crash 1000 index Lot size : opti
FiboPlusWaves MT5
Sergey Malysh
5 (1)
FiboPlusWave Series products Ready-made trading system based on Elliott waves and Fibonacci retracement levels . It is simple and affordable. Display of the marking of Elliott waves (main or alternative option) on the chart. Construction of horizontal levels, support and resistance lines, a channel. Superposition of Fibonacci levels on waves 1, 3, 5, A Alert system (on-screen, E-Mail, Push notifications).    Features: without delving into the Elliott wave theory, you can immediately open one of
FTMO Protector 8
Vyacheslav Izvarin
PROTECT YOUR FTMO Account in a simplest way Must-Have Account Protector for any Prop-trading Account and Challenge MT4 / MT5 Expert Advisor that protects your Forex Prop Trading account from an unexpected drawdown! FTMO Protector  is a Tool that lets you manage trades and control your profit and loss across multiple Robots and currency pairs using a simple parameters and settings. Use as many EAs and Instruments you need, the Protector will: 1.   Calculate your midnight (01:00 System time) Balan
News Trader Pro is a unique robot that allows you to trade the news by your predefined strategy. It loads every piece of news from several popular Forex websites. You can choose any news and preset the strategy to trade it, and then News Trader Pro will trade that news by selected strategy automatically when the news comes. News release gives opportunity to have pips since the price usually has big move at that time. Now, with this tool, trading news becomes easier, more flexible and more exciti
If you wish to draw Support and Resistance lines, view: daily market opening, classical pivot levels, Fibonacci pivot levels, trend lines, Fibonacci levels, the remaining time to candle closing, and current spread. If you seek to place your orders with the exact lot that meets your desired stop loss risk. If you wish to do all this and more with just one click, then this is the perfect tool to use. This tool will allow you to feel more relaxed when deciding to open orders, as well as predicting
The new version of  MirrorSoftware 2021  has been completely rewriten and optimized.  This version requires to be loaded only on a single chart because  it can detect all actions on every symbol and not only the actions of symbol where it is loaded. Even the  graphics and the configuration mode  have been completely redesigned. The MirrorSoftware is composed of two components (all components are required to work):  MirrorController  (free indicator): This component must be loaded into the MAST
1. Record the price data for each Tick transaction. Data file contents: "Tick time", "ASK price", "BID price", "SPREAD SPREAD", "Tick quoted quantity". 2. Meanwhile, generate a quotation data file with a 1-minute period. Content of 1min data file: "ASK time", "ASK OPEN price", "ASK HIGH price", "ASK LOW price", "ASK CLOSE price", "BID time", "BID OPEN price", "BID HIGH price", "BID LOW price", "BID CLOSE price", "Tick quoted quantity". 3. Save all quotation data in one file every day, which is c
Mt5BridgeBinary
Leandro Sanchez Marino
I automated its commercial strategies for use of binary in MT5 and with our Mt5BridgeBinary I sent the orders to its Binary account and I list: begin to operate this way of easy! The expert advisers are easy to form, to optimize and to realize hardiness tests; also in the test we can project its long-term profitability, that's why we have created Mt5BridgeBinary to connect its best strategies to Binary. Characteristics: - It can use so many strategies as I wished. (Expert Advisor). - He doe
Xrade EA
Yao Maxime Kayi
Xrade EA is an expert advisor as technical indicator. For short period trade it's the best for next previsions of the trend of the market. +--------------------------------------------------------------------------------------- Very Important Our robot(data anylizer) does'nt take a trade procedure. If using only our robot you must take positions by yoursels +--------------------------------------------------------------------------------------- The technical indiator provide for a give
News: IDEA 2.0 is out with lot of features, like telegram bot notifications and Limits order! Check the changelog at bottom of page (*). Hi all, here you can find my Expert Advisor, called IDEA  (Intelligent Detection & managEr Algorithm) . In short, with this software you can: Have   a clear view of market status , with an indication of current trend. Simply add symbols you want to monitor to your market watch, and IDEA will notify you if some of them are in trend; Have an   automatic lots
Technical confluence zones is a very popular tool for traders. This EA detects such zones by studying chart patterns, naked price levels, fib levels, SMA/EMA over multiple timeframes and more. The source data is loaded from Mytradingpet.com. To find out what are factored in when determining such zones, visit https://mytradingpet.com - a free service for all traders. The zones are color coded. Purple indicates the highest level of confluence.
Oracle
Denis Sotnikov
5 (2)
Эксперт - торговый помощник, созданный по одноимённой торговой стратегии Оракул в сотрудничестве с ее автором Нео. Определяет на графиках в автоматическом режиме разворотные импульсные модели и строит по ним Вилки Нео - авторский инструмент, позволяющий определять циклы движения цены и указывающий на ожидаемую цель TakeProfit . Поиск ведется на всех заданных периодах графиков одновременно с фильтрацией совпадений. Осуществляется фильтрация неверных Вилок с указанием кода ошибки. Утилита имеет
SystemLiveMxPips
Harold Alonso Hernandez
Automatice sus estrategias comerciales con nuestra sencilla herramienta de creación de estrategias "similar a un rompecabezas".   Cree fácilmente estrategias que operen por usted en modo de piloto automático.   También puede cargar estrategias creadas por otras personas, como la clásica   Estrategia Martingala,   para usarla como muestra para su propia estrategia. Características clave Cree su estrategia a través de funciones simples de arrastrar y soltar, sin necesidad de conocimientos de pr
제작자의 제품 더 보기
Fibo World MT5
Pavel Verveyko
The indicator builds a graphical analysis based on the Fibonacci theory. Fibo Fan is used for the analysis of the impulses and corrections of the movement. Reversal lines (2 lines at the base of the Fibonacci fan) are used to analyze the direction of movements. The indicator displays the of 4 the target line in each direction. The indicator takes into account market volatility. If the price is above the reversal lines, it makes sense to consider buying, if lower, then selling. You can op
Ichimoku Map MT5
Pavel Verveyko
Ichimoku Map (instant look at the markets) - built on the basis of the legendary Ichimoku Kinko Hyo indicator. The task of the Ichimoku Map is to provide information about the market strength on the selected time periods and instruments, from the point of view of the Ichimoku indicator. The indicator displays 7 degrees of buy signal strength and 7 degrees of sell signal strength. The stronger the trend, the brighter the signal rectangle in the table. The table can be dragged with the mouse. T
Scalper Assistant MT5
Pavel Verveyko
5 (2)
The indicator is a trading system for short-term trading. Scalper Assistant helps to determine the direction of the transaction, and also shows the entry and exit points. The indicator draws two lines (possible points for opening positions). At the moment of the breakdown of the upper line up (and when all trading conditions are met), an up arrow appears (a buy signal), as well as 2 goals. At the moment of the breakdown of the lower line down (and when all trading conditions are met), a do
Running along Lines MT5
Pavel Verveyko
5 (1)
The indicator draws support and resistance lines on an important part of the chart for making decisions. After the trend line appears, you can trade for a breakout or rebound from it, as well as place orders near it. Outdated trend lines are deleted automatically. Thus, we always deal with the most up-to-date lines. The indicator is not redrawn . Settings: Size_History  - the size of the calculated history. Num_Candles_extremum  - the number of candles on each side of the extremum. Type_Ar
Gold n XAU MT5
Pavel Verveyko
The trading system is designed to work with gold on time periods: 30M, 1H. The indicator allows you to adjust to the market situation. Parameters for 1H :   PERIOD=9F ,   FILTER=300 .   Parameters for  30M :   PERIOD=22B ,   FILTER=450 .     A small adjustment to a specific broker is allowed .   If you change the amount of history displayed, you may also need to adjust the parameters. The indicator is not redrawn.     "Gold n XAU" uses different rules for entering a trade and different
Turn
Pavel Verveyko
The indicator shows the market turning points (entry points). Reversals allow you to track rebound/breakout/testing from the reverse side of the lines of graphical analysis or indicators. Reversals can be an independent signal. The indicator allows you to determine reversals taking into account the trend and without it. You can choose a different period for the movement preceding the reversal, as well as the volatility coefficient. When plotting reversals, the indicator takes into account vola
Length Movement
Pavel Verveyko
5 (1)
Measures the length of the selected movement in points, shows the duration of the movement, as well as the speed of movement.   Outputs the average value of each dimension. It is designed to calculate the expected target based on typical market movements. The intended goal will provide information about the ratio of the stop size to the possible profit and will allow you not to open positions with a small expected profit. It will also help you determine the point at which it is more logical t
The indicator allows you to quickly switch from one instrument to another, from one time period to another using the keyboard or buttons on the monitor. Each command can be assigned a hot key from 0-9, a-Z (case-insensitive) and VK_OEM_COMMA ("<" on the keyboard) and VK_OEM_PERIOD (">" on the keyboard). This can help you to operate the maximum number of instruments that are available at your broker, analyze more instruments/periods in less time. This product cannot be tested in the tester , beca
Ratio TP SL
Pavel Verveyko
5 (1)
This indicator allows you to measure the profitability of each specific transaction (the ratio of Stop and Profit). The indicator allows you to adjust the ratio by step size and number of steps. You can build an unlimited number of ratios to compare the risks from different movements. Note: in MT4, the number of horizontal lines in a single ratio cannot exceed 32. Building a line : click the " Ratio " button and draw a line (mouse click - the first point of the line, where the mouse is relea
Corporate Report
Pavel Verveyko
5 (1)
The script displays info about the share's corporate reports and dividends. The data is downloaded from   investing.com : Report date Profit per share (EPS) Revenue Market capitalization Amount of dividends Date of payment of dividends Dividend income The product cannot be tested in the tester (since it is not possible to receive data from the Internet). Before launching:  Add 2   URL   https://ru.investing.com/earnings-calendar/Service/getCalendarFilteredData  and   https://ru.investing.com/
Channel FTF
Pavel Verveyko
The Envelopes indicator determines the presence of a trend or flat. It has 3 types of signals, shows the probable retracement levels and levels of the possible targets. The Fibonacci coefficients are used in the indicator's calculations. Signals (generated when touching the lines or rebounding from lines): Trend - the middle line of the Envelopes has a distinct inclination; the lines below the channel's middle line are used for buy trades, the lines above the middle line and the middle line itse
Mr Big
Pavel Verveyko
The indicator shows and highlights the chart candles, which are formed as a result of large players entering the market in large volumes. Such candles can also be formed after achieving a certainty on the market, when most of the participants hold positions in the same direction. The movement is likely to continue in that direction after such candles. The indicator highlights the significant candles from the existing ones on the chart; The indicator allows identifying the trends based on candles
Splash
Pavel Verveyko
The indicator identifies the most suitable moment for entering the market in terms of market volatility, when the market has the strength to move (the signal is indicated by an arrow under the candle). For each of the signals, the presence of trends on the current and higher timeframes is determined, so that the signal is in the direction of the majority of positions opened on the market (denoted near the signal by abbreviations of timeframes with a trend present). The signal appears after the c
The indicator displays the key support and resistance levels on the chart. The significance of these levels lies in that the price may reverse or strengthen the movement when passing such levels, since they are formed as a consequence of the natural reaction of market participants to the price movement, depending on which positions they occupied or did not have time to occupy. The psychology of the level occurrence: there always those who bought, sold, hesitated to enter or exited early. If the
This indicator is a multitimeframe trading strategy. It has the levels for stop loss, take profit and entry point. The order level can also be set manually. The indicator uses the regularity of the market, which manifests itself on all instruments, and does not require adjustment of the parameters. The strategy uses a proprietary approach to determining: trend, volatility, hierarchy of timeframe significance, the size of the history period (the number of candles), which is important for making a
Trend Sync
Pavel Verveyko
5 (1)
The indicator shows the trend of 3 timeframes: higher timeframe; medium timeframe; smaller (current) timeframe, where the indicator is running. The indicator should be launched on a chart with a timeframe smaller than the higher and medium ones. The idea is to use the trend strength when opening positions. Combination of 3 timeframes (smaller, medium, higher) allows the trend to be followed at all levels of the instrument. The higher timeframes are used for calculations. Therefore, sudden change
The indicator detects important peaks and troughs (extremes) on the chart. These points can be used to plot support/resistance levels and trend lines, as well as any other graphical analysis. These points can serve as reference points for setting trading orders. The indicator does not redraw . Settings: Size_History  - the size of the calculated history. Num_Candles_Right  - number of candles to the right of the peak or trough. Num_Candles_Left  - number of candles to the left of the pea
Running along Lines
Pavel Verveyko
3 (2)
The indicator draws support and resistance lines on an important part of the chart for making decisions. After the trend line appears, you can trade for a breakout or rebound from it, as well as place orders near it. Outdated trend lines are deleted automatically. Thus, we always deal with the most up-to-date lines. The indicator is not redrawn . Settings: Size_History  - the size of the calculated history. Num_Candles_extremum  - the number of candles on each side of the extremum. Type_Ar
Key Volumes
Pavel Verveyko
1 (1)
The indicator shows key volumes confirmed by the price movement. The indicator allows you to analyze volumes in the direction, frequency of occurrence, and their value. There are 2 modes of operation: taking into account the trend and not taking into account the trend (if the parameter Period_Trend = 0, then the trend is not taken into account; if the parameter Period_Trend is greater than zero, then the trend is taken into account in volumes). The indicator does not redraw . Settings Histo
Catch Impulse
Pavel Verveyko
This trading system is based on market impulses of varying complexity.   To generate a signal, the indicator uses the moments when the direction of the pulse and the necessary section of the trend coincide. The indicator also takes into account the current market volatility. Stop_loss tags can be set with the parameter "0" or "1", then Stop_Loss will take into account market volatility.   Take_Profit tags can be set with the parameter "0", then Take_Profit will take into account market volat
Indexes
Pavel Verveyko
The stocks that make up the index are one of the drivers of the movement. Analyzing the financial performance of all elements of the index, we can assume further development of the situation. The program (script) displays corporate reports of shares that are part of the index selected in the settings.   "Indexes" cannot be tested in the tester (since there is no way to get information from the Internet). Information is downloaded from the site investing.com: Report Date Earnings per share
Fibo World
Pavel Verveyko
The indicator builds a graphical analysis based on the Fibonacci theory. Fibo Fan is used for the analysis of the impulses and corrections of the movement. Reversal lines (2 lines at the base of the Fibonacci fan) are used to analyze the direction of movements. The indicator displays the of 4 the target line in each direction. The indicator takes into account market volatility. If the price is above the reversal lines, it makes sense to consider buying, if lower, then selling. You can op
The indicator determines the state of the market: trend or flat. The state of the market is determined by taking into account volatility. The flat (trading corridor)is displayed in yellow. The green color shows the upward trend. The red color shows the downward trend. The height of the label corresponds to the volatility in the market. The indicator does not redraw . Settings History_Size   - the amount of history for calculation. Period_Candles  - the number of candles to calculate the
The indicator plots flexible support and resistance levels (dots). A special phase of movement is used for construction. Levels are formed dynamically, that is, each new candle can continue the level or complete it. The level can provide resistance or support to the price even where it is no longer there. Also, support and resistance levels can change roles. The importance of levels is affected by: the amount of time the level is formed and the number of touches. The significance of these l
The indicator is a trading system for short-term trading. Scalper Assistant helps to determine the direction of the transaction, and also shows the entry and exit points. The indicator draws two lines (possible points for opening positions). At the moment of the breakdown of the upper line up (and when all trading conditions are met), an up arrow appears (a buy signal), as well as 2 goals. At the moment of the breakdown of the lower line down (and when all trading conditions are met), a do

Gold n XAU
Pavel Verveyko
The trading system is designed to work with gold on time periods: 30M, 1H. The indicator allows you to adjust to the market situation. Parameters for 1H :   PERIOD=9F ,   FILTER=300 .   Parameters for  30M :   PERIOD=22B ,   FILTER=450 .   A small adjustment to a specific broker is allowed .   If you change the amount of history displayed, you may also need to adjust the parameters. The indicator is not redrawn.     "Gold n XAU" uses different rules for entering a trade and different ru
The indicator builds "psychological levels": levels of round numbers and intermediate levels of round numbers. Round numbers play an important role in forming support and resistance levels. There is a pattern in which the decline or growth of the price can stop at round numbers. The level whose price ends at 0 is the level of a round number of the first order. Intermediate level, this is the level between two round levels, for example, between 10 and 20 this is level 15. In the " Num_Zero
Ichimoku Map
Pavel Verveyko
Ichimoku Map (instant look at the markets) - built on the basis of the legendary Ichimoku Kinko Hyo indicator. The task of the Ichimoku Map is to provide information about the market strength on the selected time periods and instruments, from the point of view of the Ichimoku indicator. The indicator displays 7 degrees of buy signal strength and 7 degrees of sell signal strength. The stronger the trend, the brighter the signal rectangle in the table. The table can be dragged with the mouse. T
The indicator displays a stock chart of a non-standard type, in which the price and time have the same value. The usual chart of Japanese candlesticks does not take into account all the information that the time analysis can give. Renko charts do not use all the information that price can give in relation to time. The "Chart Price and Time" indicator takes into account price and time equally and shows the predominance of price or time. Taking into account price and time equally gives an i
The indicator tracks sharp volatility (moments when the market has shown increased activity and movement may occur), on the selected instruments and time periods. The information is displayed as colored rectangles. Thus, it is possible to assess at a glance which tool should be given priority attention. The indicator will be useful for scalpers when they need a quick reaction or for traders working with a large number of instruments. The indicator does not redraw. The indicator displays 8 degr
필터:
mambobody
462
mambobody 2022.05.04 01:45 
 

사용자가 평가에 대한 코멘트를 남기지 않았습니다

all2me
66
all2me 2021.03.10 00:41 
 

Удобный и простой в использовании инструмент для тех кому важна информация об отчетах и нет желания тратить время на ее изучение в других приложениях. Автор быстро и информативно отвечает на вопросы, при этом оказывает содействие в дополнительных настройках.

리뷰 답변
버전 1.6 2021.03.21
Added information about dividends.
버전 1.5 2020.12.20
Search optimization
버전 1.4 2020.12.19
1 Improved search.
2 While searching for information, the background of the graph changes color to blue.
버전 1.3 2020.12.16
Updated the list of shares.
Search for tickers is optimized, search results are displayed in the "experts" tab.
버전 1.2 2020.06.09
Recompilation.
버전 1.1 2017.08.31
Fixed an error that could occur if the broker's server was missing a history for a certain period of time on the requested instrument (but which should certainly be available).