DG TrendSigns
- 지표
- David Gadelha
- 버전: 3.31
- 활성화: 5
Purpose
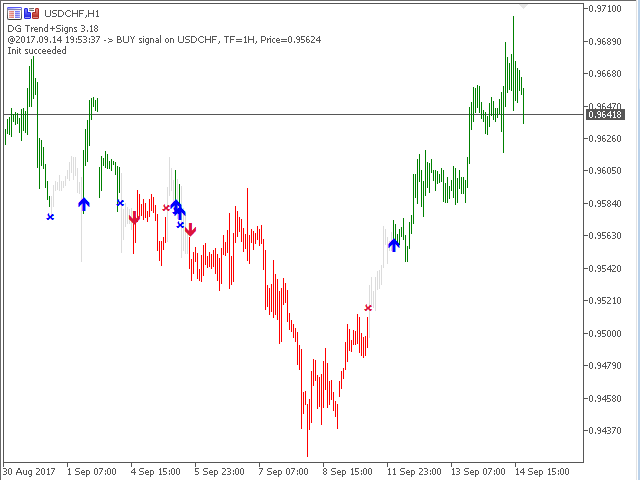
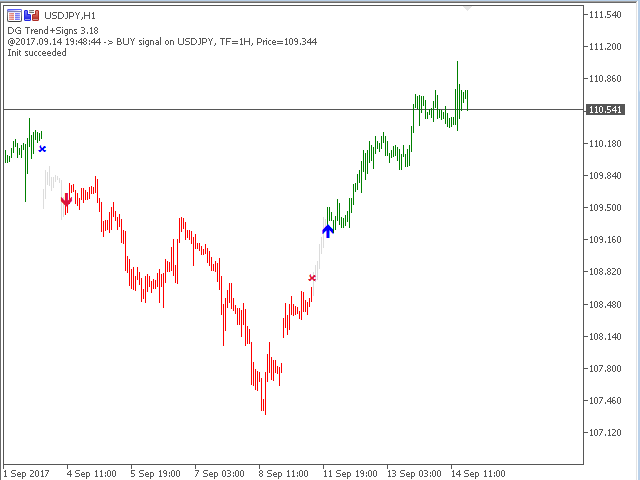
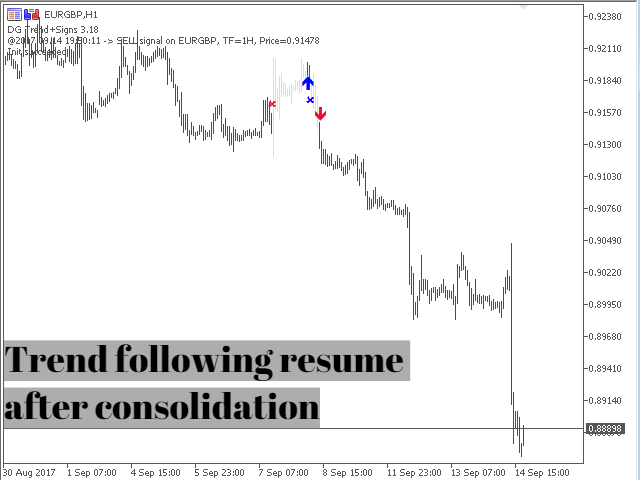
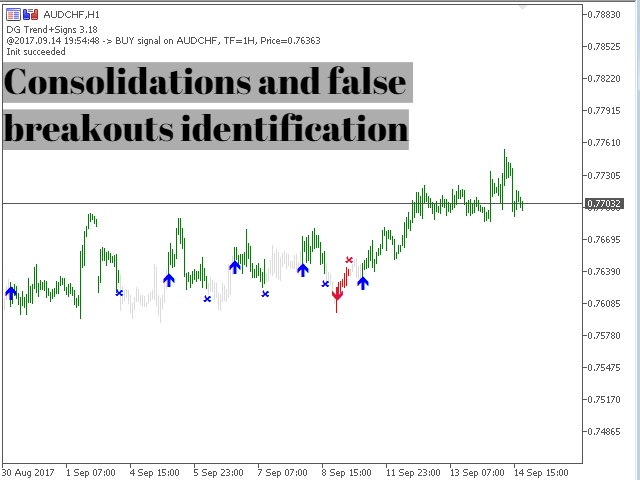
DG Trend+Signs is an indicator that paints candles with trend colors and clearly shows consolidations, using both DoGMA Trend and DoGMA Channel indicators.
It was created to help users in their trades, showing trends, consolidations and marking entry and exit points. The indicator also takes consolidations in consideration to identify breakouts.
Key features
- Designed to be simple to use, with a few parameters
- Does NOT repaint
- Does NOT recalculate
- Signals on entries
- Works in ALL pairs
- Works in ALL timeframes
- Many kinds of alerts
Main Indicator Parameters and How to Use Them:
- Signal Sensibility - The sensibility of the of the price change detection (the greater, the less sensible)
Use this parameter to tune the sensibility of the DoGMA signal, that means how much price variations are needed to be considered relevant. Similar to the MACD signal, however, it is more sensible.
If you using low timeframes (from M1 to M15), for daytrading, use a low integer number (from 3 to 20, e.g.). If you want to make swing or position trades use greater values (above 21, e.g.). Remember to set this parameter lower than Trend Sensibility to achieve better results.
- Trend Sensibility - The sensibility of the trend detection (the greater, the less sensible)
This parameter is used to identify trends, it's the main value for the coloring candles feature. As the previous parameter, if you using low timeframe (from M1 to M15), for daytrading, use a low integer number (from 19 to 36, e.g.). If you want to make swing or position trades, analyze greater timeframes (H1, D1) and use greater values (above 144, e.g.).
- Congestion Sensibility - Channel breakout sensibility (the greater, the less sensible)
The indicator tunes its sensibility to long periods of consolidations through this parameter. Usually, if you are doing daytrades, use it low (e.g., between 8 and 24), to longer trades, use values from 14 to 36.
- Sigma Sensibility - Amplitude variation of DoGMA Channel
Sigma is an advanced parameter and it is related to the variation speed of the DoGMA channel. The greater, the less sensible. We recommend a value between 1.6 and 2.4. If you are beginning to use DG TrendSigns, use the default value (2.1).
- Minimum Tick variation Sensibility - Minimum tick variation to be considered as a meaningful price movement.
Mininum number of ticks of which the price should go before consider it a breakout or a meaningful price movement. Use it carefully, and adjust it to each asset and stock market, since it's linked to the price values itself. If you new to DG TrendSigns or don't know how to use it yet, please set it to 1 or accept the default value.
- Price to be considered - The price to be used by the indicator in its calculations
- Do not paint candles on weak trends/consolidations - Should the indicator paint grayish candles when the trend is weak?
- Arrow shift - The vertical shift of signal arrow
- Bars analyzed - The number of bars to be analyzed
- Alerts - Set your preferred alerts
Example Settings
- EURUSD - M1 to M15 charts - Daytrading
Trend Sensibility 74
Min Tick var 2
Consolidation Sensibility 38
DoGMA Channel Sigma 1.8
- EURUSD - H1 to D1 charts - Swing trading
Trend Sensibility 144
Min Tick var 10
Consolidation Sensibility 36
DoGMA Channel Sigma 2.1
- EURUSD - H1 to W1 charts - Position trading
Trend Sensibility 310
Min Tick var 14
Consolidation Sensibility 34
DoGMA Channel Sigma 2.1
Notes
This indicator is a manual trading tool that can be used in many ways. It's up to you to find the best setting to fit your purposes.
DoGMA Trend is a copyrighted method that uses combined zero lag averages algorithms to identify a trend, DoGMA Channel is a new approach to calculate a dynamic channel, sensible to consolidations, minimum variations, and quick price spins.


Really like this indicator, great concept and thought went into this, many possibilities. Not really reprint, only when bar changes direction, but once exit or entry is set it does not reprint. Nice features thanks. Needed assistance on buffer for arrows, also indicator prints on chart data top left, this is slowing test and obstructing chart view, no option to remove this. He has not responded to several messages over months.