Levels HighLow 2TF
- 지표
- Andrei Fandeev
- 버전: 3.0
- 업데이트됨: 21 12월 2018
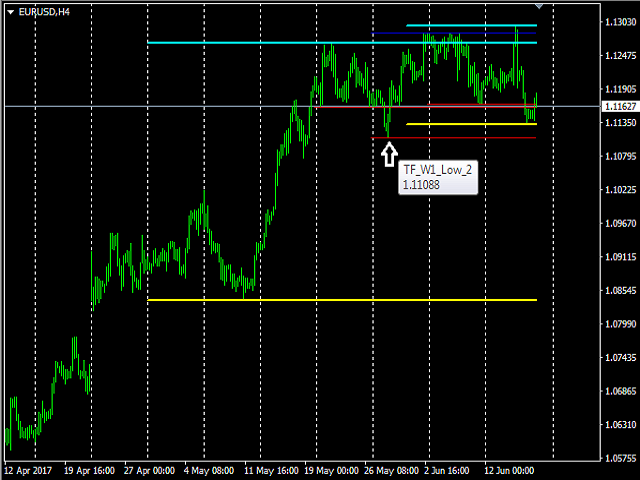
The indicator shows the High and Low levels of candles for timeframes selected in the settings.
It is recommended to use it on smaller timeframes to determine the levels of higher timeframes.
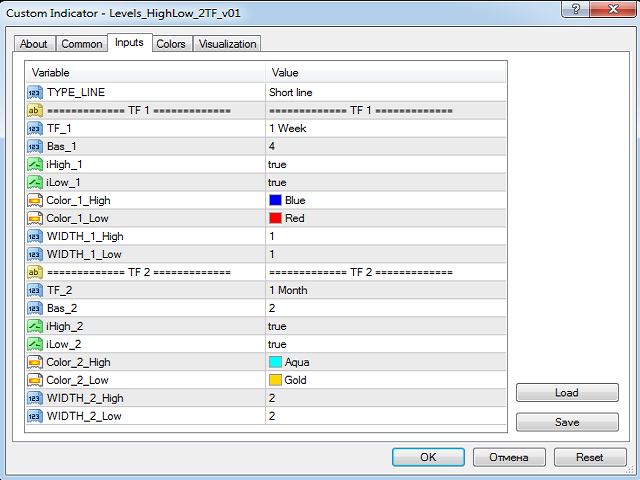
Parameters
- TYPE_LINE - type of the line (short based on the bar time, or long for the entire chart)
- ============= TF 1 ============= block of lines for the first timeframe
- TF_1 - timeframe of the first block of lines
- Bars_1_from=1 - Bar of the beginning of the line of the corresponding Timeframe.
- Bars_1_for=1 - Bar of the end of the line of the corresponding TimeFrame.
- Color_1_High - color of the High lines
- Color_1_Low - color of the Low lines
- TYPE_LINE - type of the line (short based on bar, or long for the entire chart)
- ============= TF 2 ============= block of lines for the second timeframe
- TF_2 - timeframe of the second block of lines
- Bars_2_from=1 - Bar of the beginning of the line of the corresponding Timeframe.
- Bars_2_for=1 - Bar of the end of the line of the corresponding TimeFrame.
- Color_2_High - color of the High lines
- Color_2_Low - color of the Low lines
- WIDTH_2_High - width of the High lines
- WIDTH_2_Low - width of the Low lines





사용자가 평가에 대한 코멘트를 남기지 않았습니다