YFX Symbol Watermark
- 지표
- Richard Yancy
- 버전: 6.1
- 업데이트됨: 23 5월 2022
- 활성화: 5
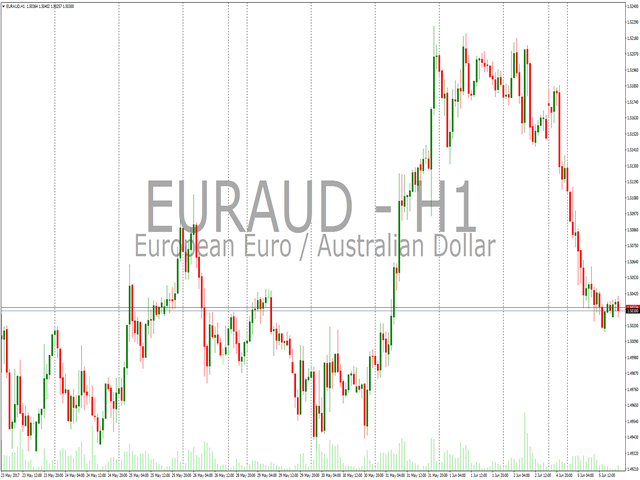
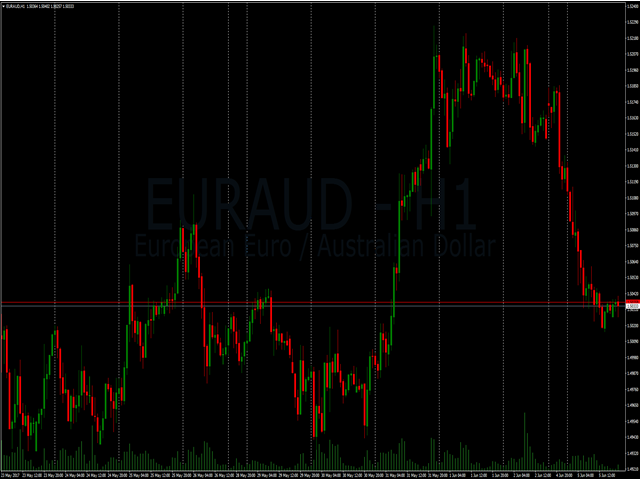
The YFX Symbol Watermark indicator is used to display a watermark on your chart, which makes it easy to see at a glance the symbol information for any chart. The displayed information includes:
- Symbol Name and Timeframe on the chart
- Description of the currencies
- Tag line, which can contain any user-defined information
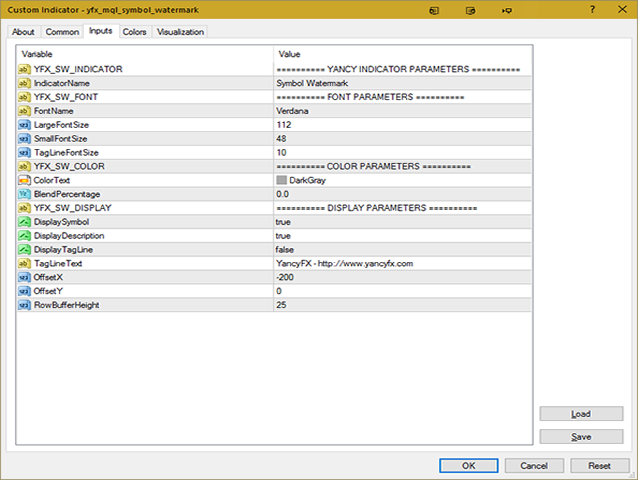
All the information can be displayed on the chart so that it can be easily read. The indicator also has parameters that can be set to customize which information is displayed. Parameters are organized into categories:
- Indicator
- Font
- Color
- Display
Also note that the categories are not mutually exclusive. Information may be applicable to multiple categories but will only be shown in one section for simplicity. All the parameters are assigned to default values that work fine in most cases. It is advised not to change default values until one becomes more familiar with the indicator.
Section: YFX_SW_INDICATOR
- IndicatorName : “Symbol Watermark” – Name of the indicator that is included in the name displayed in the data window.
Section: YFX_SW_FONT
- FontName : “Verdana” – Font used to display text for indicator. Can be any font available on your system.
- LargeFontSize : 56 – Size of largest font used to display the chart symbol.
- SmallFontSize : 24 – Size of smallest font used to display symbol description on the chart symbol.
- TagLineFontSize : 8 – Default size of font used to display tag line on the chart.
Section: YFX_SW_COLOR
- ColorText : “SteelBlue” – Color used to draw text on chart
- BlendPercentage : 70.0 – Amount of blend (transparency) to use for text color.
Section: YFX_SW_DISPLAY
- DisplaySymbol : true – Display symbol information if true
- DisplayDescription : true – Display symbol description if true.
- DisplayTagLine : false – Display tag line if true.
- TagLineText : “http://www.yancyfx.com” – Text to display as tag line. Only shown if flag to display it is enabled.
- OffestX : 0 – Adjustment of location along the time axis. This is an offset from the center of the chart
- OffsetY : 0 – Adjustment of location along the price axis. This is an offset from the center of the chart
- RowBufferHeight : 5 – Amount of space to leave between lines of text in the indicator. Value is in number of pixels.

