ACI Bollinger Bands
- 지표
- Marat Sultanov
- 버전: 1.1
- 업데이트됨: 5 12월 2021
Tired of adjusting the indicator settings losing precious time? Tired of the uncertainty regarding their efficiency? Afraid of the uncertainty in their profitability? Then the indicator ACI (automatically calibrateable indicator) is designed exactly for you. Launching it, you can easily solve these three issues just performing the simplest action: clicking a single Calibrate button. To achieve the highest efficiency, you should perform another additional action: move the power slider to the maximum.
ACI will save you a lot of time that can be spent on more useful things, for example, vacation, but the effeciency will increase many times. In addition, thanks to the separate graphical interface, you can not only watch but also easily change the settings of the indicator on the fly, with the ability to select calibration areas visually on the chart.
Useful information
If you to get more info about a similar indicator before making a purchase, clicking on the link to try the simplest indicator of ACI series for free. You will also find a demonstration video there.
Indicator for calibrating
Standard built-in Moving Average is used as a calibrated one. The following properties are used as calibrated ones:
- Period for average line calculation.
- Number of standard deviations (bonus property).
- Shift of the indicator relative to the price chart.
- Smoothing type:
- Simple averaging,
- Exponential averaging,
- Smoothed averaging,
- Linear-weighted averaging.
- The price used:
- Close price,
- Open price,
- The maximum price for the period,
- The minimum price for the period,
- Median price,
- Typical price,
- Average price.
Standard input/output signals are used to calculate the quality (profitability):
If the price crosses below the lower level of the indicator, the signal is considered as a buy one. If the price crosses above the higher level of the indicator, the signal is considered as a sell one.
ACI
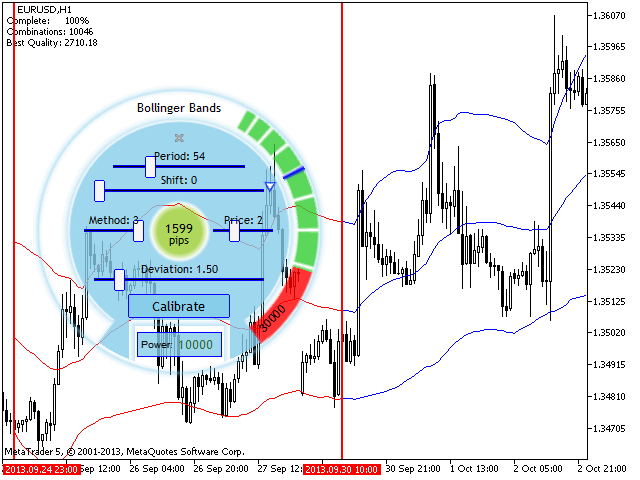
Automatic calibrator and the calibrated indicator can be controlled by ACI graphical interface which reduces the amount of actions you should perform to a minimum. To start the calibration process, click Calibrate button. When the calibration power reaches the specified mark, calibration stops, or else it can be stopped by another click.
Besides calibration, ACI also quickly calculates and displays the quality (profitability) of the selected parameters of the calibrated indicator at a specified time interval of a chart. The calculation is made by the method specified in the settings ("Criterion for calibration" parameter). The time interval on the chart can be changed using the levels. To do this, move the cursor to the upper or lower part of the level, highlight it with a click and start changing.
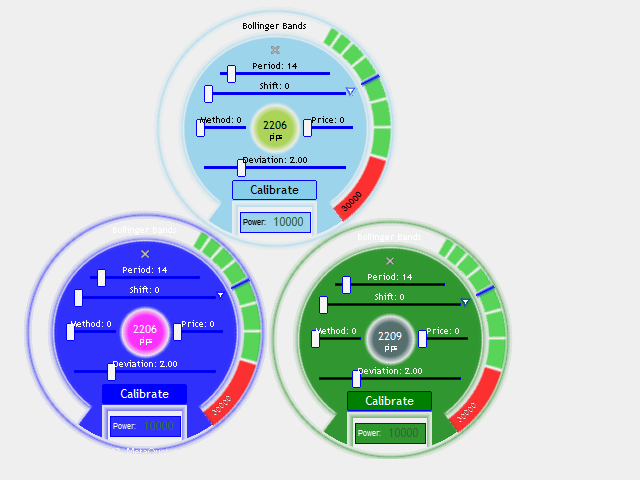
If necessary, you can increase or decrease the power (Power) calibrator moving the slider clockwise or counterclockwise, respectively. The dial's transparent area allows you to adjust from 0% to 20% of the total power, the green one - from 20% to 50% and the red one - from 50% to 100%. If necessary, you can work with multiple copies of this indicator on the same chart.
Settings
The indicator has multiple settings ranging from calibrated indicator parameters to ACI graphical interface ones.
| Property name | Description |
|---|---|
| Bollinger Bands default settings | |
| Default BB Period | Period for average line calculation, default. |
| Default BB Deviation | Number of standard deviations, default. |
| Default BB Shift | Shift of the indicator relative to the price chart, default. |
| Default BB Method | Smoothing type, default. |
| Default BB Price | The price used, default. |
| Power | |
| Default Power | Default power to be achieved during calibration. |
| Maximum Power | Maximum possible power. |
| Criterion | |
| Criterion for Calibration | Calibration criterion. Method of calculating the quality (profitability). |
| Selected interval of the chart | |
| Start bar | The bar for specifying the time interval beginning. |
| Finish bar | The bar for specifying the time interval end. |
| Bollinger Bands regulator settings | |
| Minimum BB Period | Period for average line calculation, minimum. |
| Minimum BB Deviation | Number of standard deviations, minimum. |
| Minimum BB Shift | Shift of the indicator relative to the price chart, minimum. |
| Minimum BB Method | Smoothing type, minimum. |
| Minimum BB Price | The price used, minimum. |
| Maximum BB Period | Period for average line calculation, maximum. |
| Maximum BB Deviation | Number of standard deviations, maximum. |
| Maximum BB Shift | Shift of the indicator relative to the price chart, maximum. |
| Maximum BB Method | Smoothing type, maximum. |
| Maximum BB Price | The price used, maximum. |
| UI panel settings | |
| Panel size | Panel size (in pixels). 0 - automatic size calculation. |
| Panel Transparent | Transparent level of panel. 0 - fully visible, 100 - fully hidden. |
| Panel color | General panel color. |
| Font color of panel | Panel fonts color. |
| Quality color | Quality (profitability) color. |


Super