MACD stopper x2
- 지표
- Andrii Malakhov
- 버전: 1.31
- 업데이트됨: 11 9월 2017
- 활성화: 5
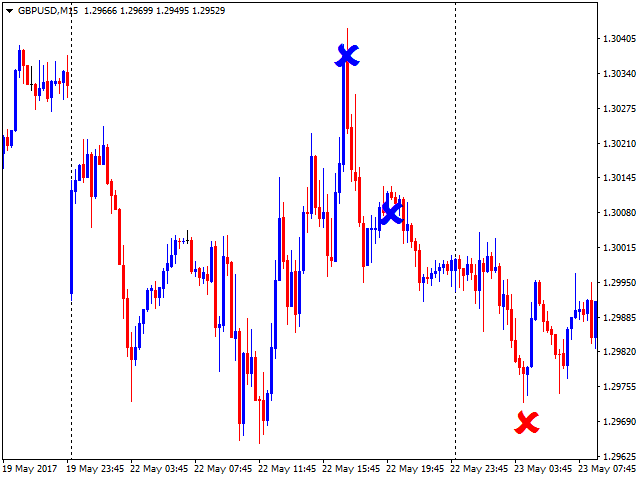
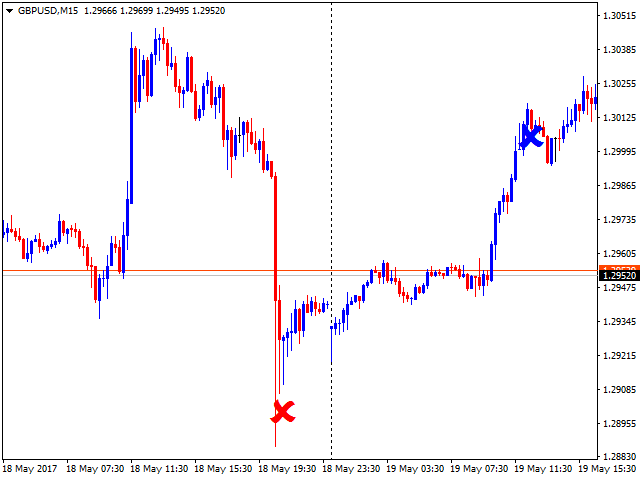
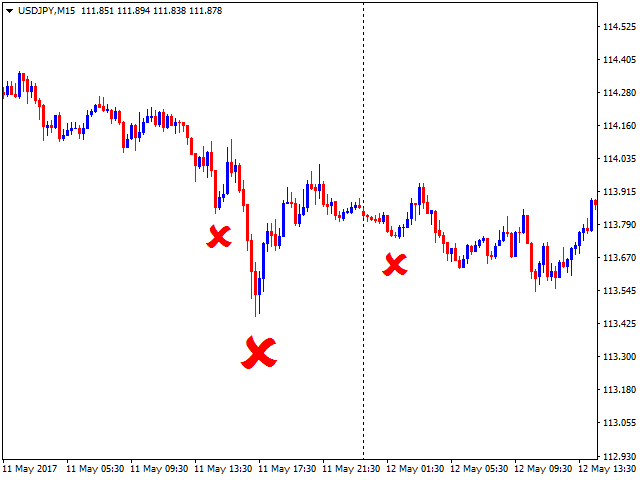
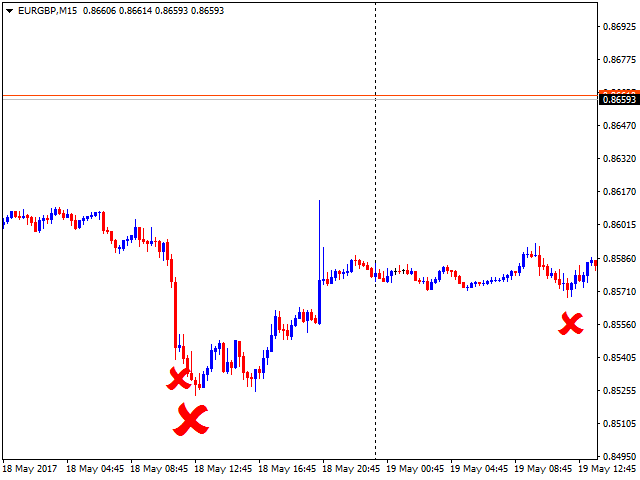
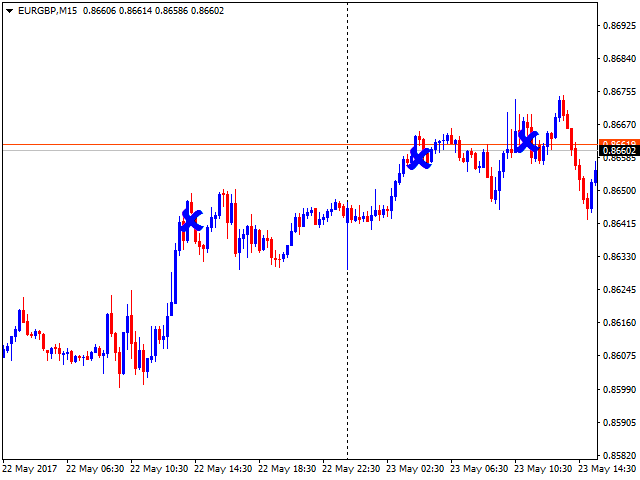
The MACD_stopper_x2 indicator shows where the trend has a tendency to stop or reverse. It uses the standard MACD indicator and a proprietary formula for processing data obtained from MACD.
There are 2 types of stop/reversal signals:
- Small cross - probability of a trend stop/reversal is 70-80%
- Large cross - probability of a trend stop/reversal is 80-80%
If there are open trades (for example, BUY) on the symbol the indicator is attached to, and the BUY trend ends, the indicator sends push notifications and emails to the user.
Indicator parameters
- Days_paint - the number of days, during which the stop signals are to be drawn.
- AlertAndSendPush - send push notifications and email to the user.
- BuyColor1 - color of the stop signal 1 for the BUY orders
- BuySize1 - size of the stop signal 1 for the BUY orders
- BuyColor2 - color of the stop signal 2 for the BUY orders
- BuySize1 - size of the stop signal 2 for the BUY orders
- SellColor1 - color of the stop signal 1 for the SELL orders
- SellSize1 - size of the stop signal 1 for the SELL orders
- SellColor2 - color of the stop signal 2 for the SELL orders
- SellSize2 - size of the stop signal 2 for the SELL orders

사용자가 평가에 대한 코멘트를 남기지 않았습니다