Currency Strength Matrix
- 지표
- Raymond Gilmour
- 버전: 2.65
- 업데이트됨: 2 4월 2019
- 활성화: 15
THE ONLY CURRENCY STRENGTH INDICATOR THAT IS BASED ON PRICE ACTION. DESIGNED FOR TREND, MOMENTUM & REVERSAL TRADERS
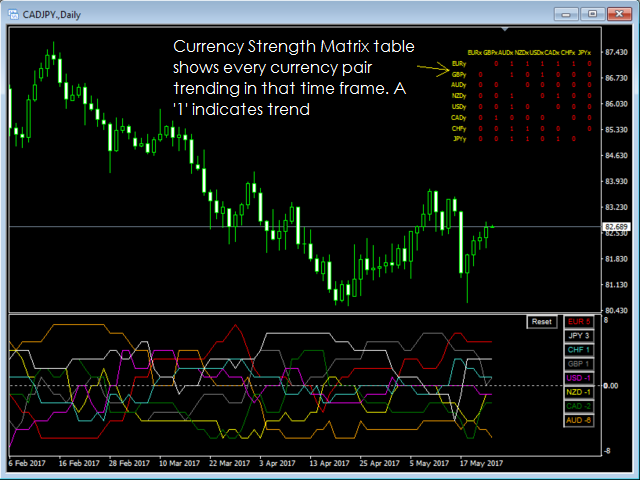
This indicator reads price action to confirm trend and strength. Advanced multi-currency and multi-time frame indicator that shows you simply by looking at one chart, every currency pair that is trending and the strongest and weakest currencies driving those trends.
For full details on how to use this indicator, and also how to get a FREE chart tool, please see user manual HERE.
This indicator intelligently reads the price action of 28 currency pairs simultaneously in any time frame in real time, so you always know the strongest and weakest currencies to pair together. Currency Strength Matrix establishes a currencies true strength by reading price action and cyclicity to determine trend, the only true method for identifying trend.
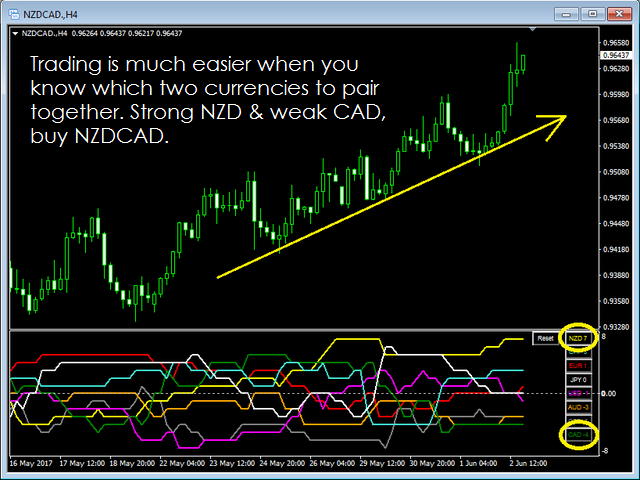
The most important factor in currency trading is each currencies relative strength. A major benefit currency traders have over traders of other markets, is that YOU can pre-select which currencies they wish to pair together to give YOU the highest probability for a successful outcome. Without understanding a currencies core strength, the pairings you choose are less likely to succeed.
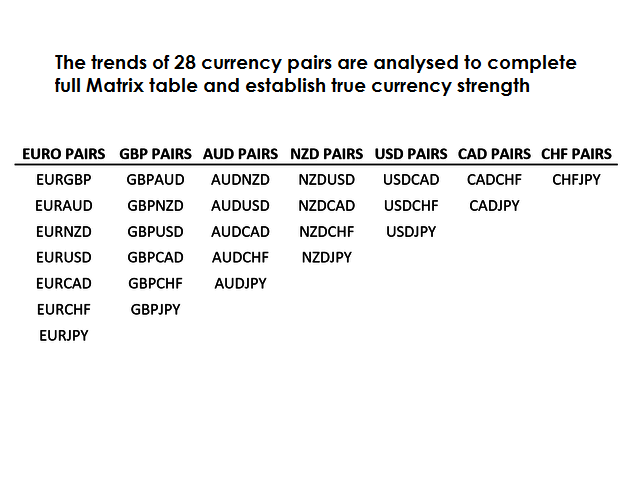
Currency Strength Matrix works with 8 major currencies (USD, EUR, JPY, GBP, AUD, CAD, NZD & CHF) which combined make a total of 28 currency pairs which you can trade using this indicator (check our screenshots below for full pairs list).
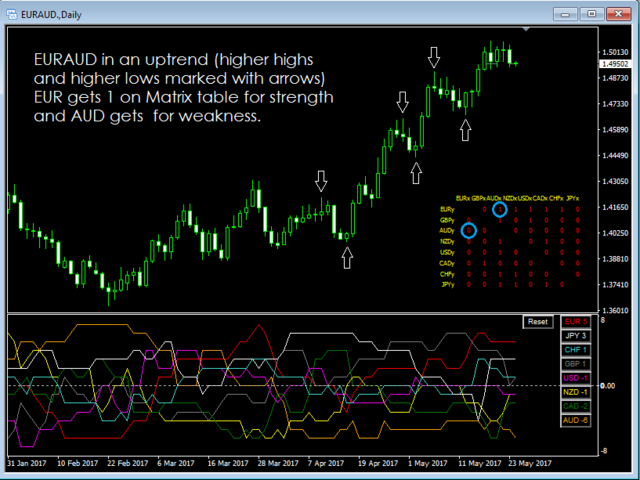
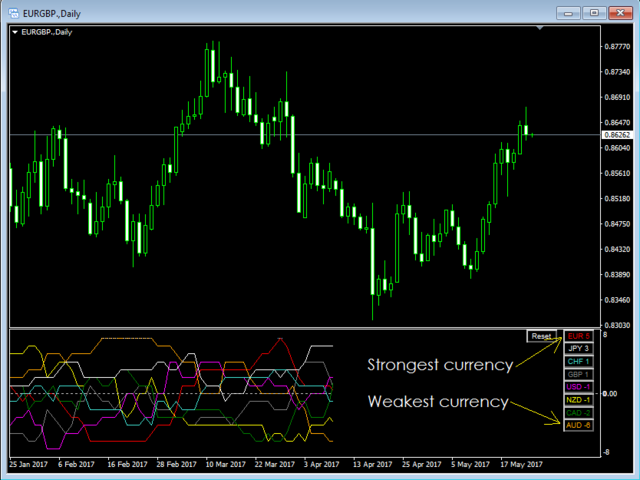
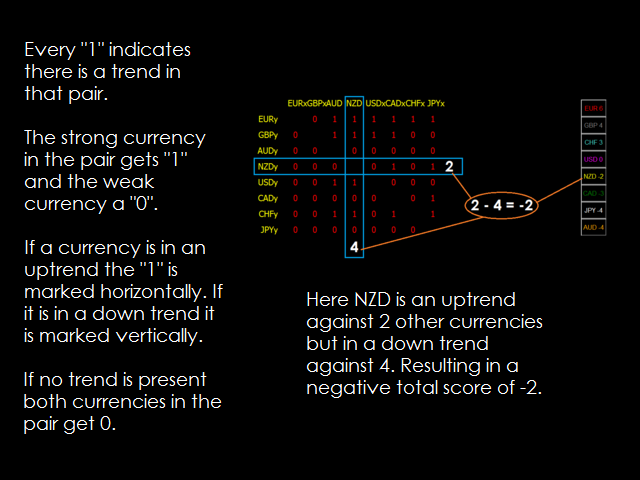
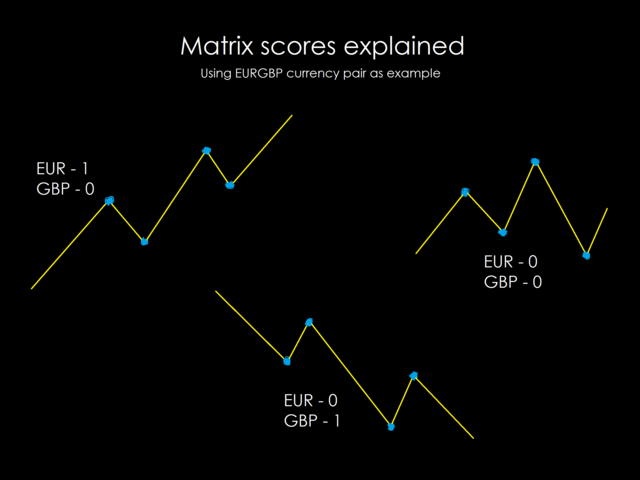
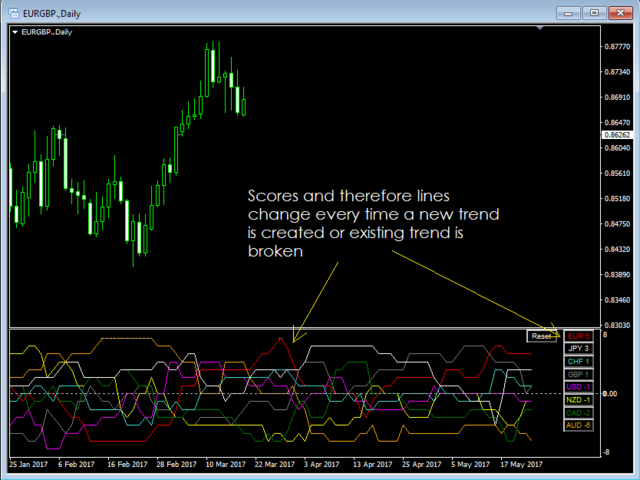
Each currency is ranked from +7 to -7 in each time frame. +7 indicating that a currency is in an uptrend against all 7 other major currencies with -7 indicating it is in a downtrend against all 7 other major currencies. The scores change when a new trend is created or an existing trend is broken.
How to trade using the Currency Strength Matrix
Currency Strength Matrix can be used in conjunction with any existing trend strategy. Currency strength precedes a strategy, which means it will help you choose which pair to trade before implementing your existing strategy.
Tips.
- Pair together a strong currency with positive scores of 5, 6 or 7, with a weak currency with negative scores of -5, -6 or -7. These conditions will ensure you always trading with the existing trend.
- Pair a currency crossing up through the 0 line, meaning it is increasing in strength, with another currency crossing down through the 0 line, meaning it is increasing in weakness. These conditions will have you trading at the midpoint of new trends.
- For early entry into new trends look to pair a strong currency which is losing strength (was a 7 and dropped to 6) with a weak currency gaining strength (a -7 that has just increase to -6). These conditions are the most aggressive but will have you trading right at the beginning of new trends.
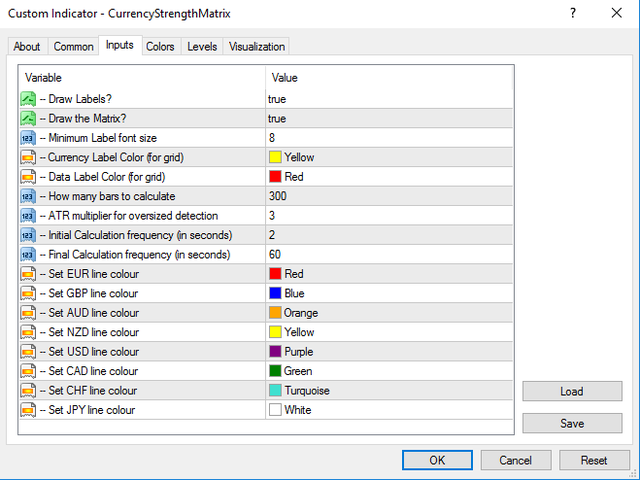
Indicator parameters
- Draw Labels: You can choose to turn off all currency scores and Matrix table and just use the indicator lines.
- Draw Matrix: This setting allows you to turn on and off the Matrix table on its own. When set to true it will show on the top right corner of your chart.
- Label font size: You can choose the size of text in the Matrix table and currency scores.
- Currency Label Color (for grid): This sets the color of the currency titles in X and Y axis of Matrix grid.
- Data Label Color (for grid): This sets the color of the scores in Matrix grid.
- How many bars to calculate: Set how many bars should be calculated and this will set how far the indicator lines extend back in history. You can increase this number if you wish for backtesting. We recommend a minimum of 50 bars.
- ATR multiplier for over-sized detection: This has been added to eliminate any anomaly/over-sized bars from the chart (over-sized bars greater than chosen ATR will not be counted in cycles analysis) so that we can still focus on the true cycles. The default is 3x ATR, but this can be amended to take into account larger or smaller bars. We recommend 3 as a starting point for all users. ATR 14 is the setting used.
- Initial calculation frequency: This is the speed in which the 300 bars are read on first load. Can be adjusted between 1 and 10 seconds.
- Final calculation frequency: This is the frequency in which the indicator checks price action for changes in cycles and therefore scores after all bars have been fully loaded.










Absolutely amazing. This Indicator and the other 3 that I also got which are trend viewer pro, cycle finder and easy draw are all so useful and beneficial. It by far has helped me with my decision making and supported me in understanding market structure for sure. All these indicators have made my trading more than ever easier. I am indeed grateful to Ray for such indicators. I also got the seasonality course on Udemy by Ray last year which was awesome and informative and has for sure changed my approach to the financial markets. My request is that Ray does a course on COT, as combination of seasonality with COT is extra confirmation. Highly recommend as I am hard to please.