Trend Sign
- 지표
- Pavel Gotkevitch
- 버전: 1.1
- 업데이트됨: 24 3월 2022
- 활성화: 5
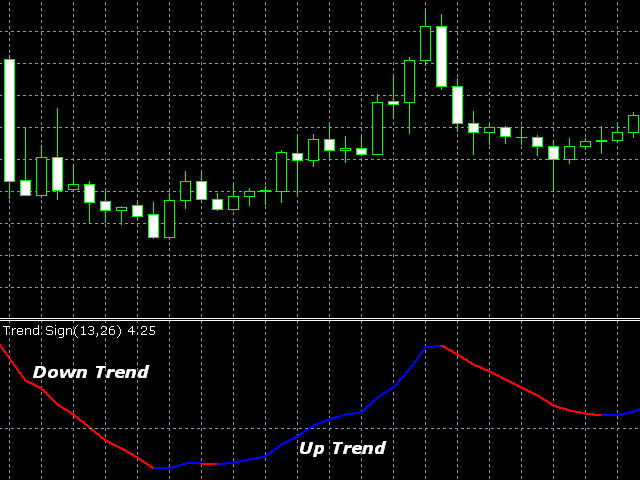
The Trend Sign indicator is a modification of the MACD indicator (Moving Average Convergence Divergence), which allows determining the direction and strength of the trend, as well as a trend change.
The indicator is based on two moving averages - fast and slow, and it can work on any timeframe.
Uptrends are shown by blue color of the indicator line, downtrends by the red color.
Close a short position and open a long one if the line color changes from red to blue.
Close a long position and open a short one if the line color changes from blue to red.
Use a small stop loss, as the line itself may suddenly change its color and direction.
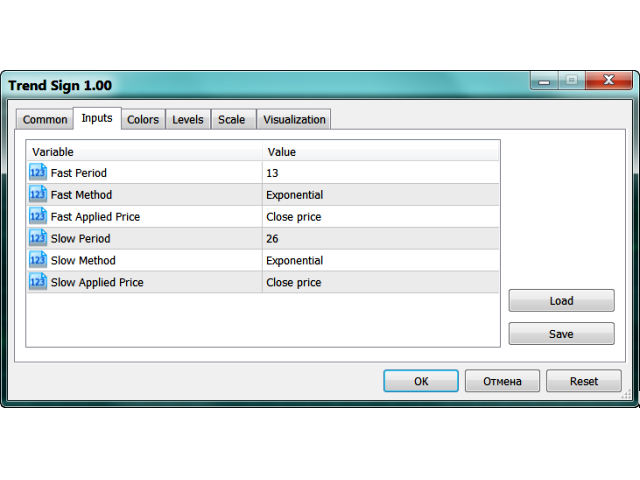
The following can be set in the indicator's Inputs tab:
- period (Fast Period, Slow Period);
- moving average smoothing method (Simple, Exponential, Smoothed, Linear weighted);
- price used calculations (Close, Open, High, Low, Median, Typical, Weighted).
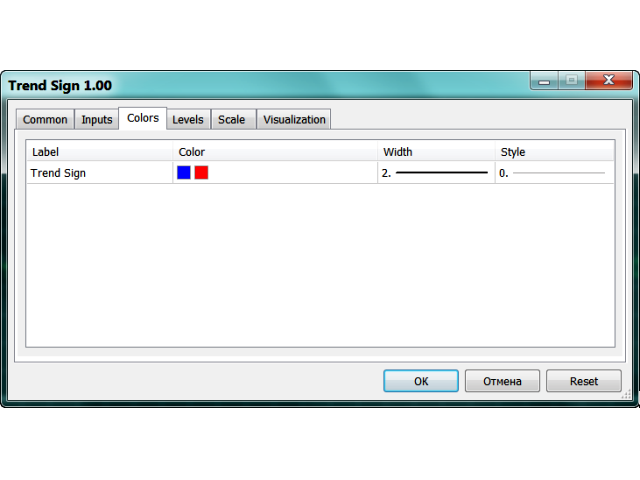
The Colors tab allows to choose the color, width and line style of the indicator.
Parameters
- fast period - number of bars used for fast moving average calculation;
- fast method - smoothing method for the fast moving average;
- fast applied price - applied price for the fast moving average;
- slow period - number of bars used for slow moving average calculation;
- slow method - smoothing method for the slow moving average;
- slow applied price - applied price for the slow moving average;






사용자가 평가에 대한 코멘트를 남기지 않았습니다