Marker Bands
- 지표
- Ramon Sobrevals Arce
- 버전: 2.0
- 업데이트됨: 5 10월 2020
- 활성화: 5
This indicator consists in two different algorithms, in order to profit all fast movements created during noises of the market.
First of all, it plots normalized trend bands to can filter the possible trades. The normalized trend bands are calcualted using an exclusive mathematical algorithm to has both the correct trend and the fast adaptability to the change of trends.
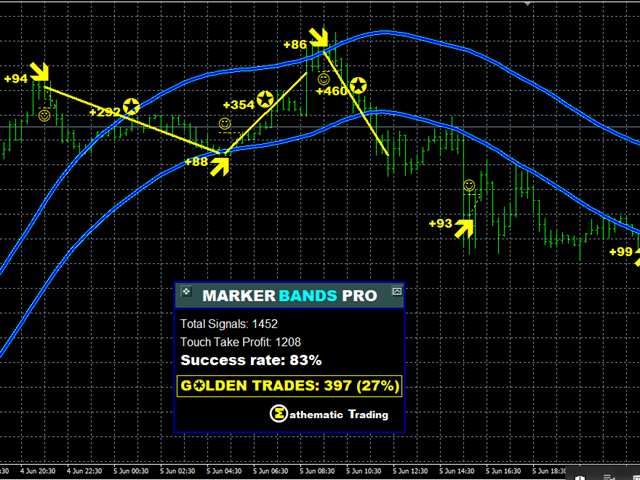
With those bands you can know when you are inside the trend, or when you are outside.
The second alhorithm uses a private formula to determine the best reversal point outside the normalized trending bands. The bands will act like a filter depending on your trading style.
If you want to use it for scalping, we recommend you to use short distance bands; you will have more trades with short movements.
If you want to use it for long term trading, we recommend to use long distance bands; to have less trades but longer distance.
- The trading system is suitable for experienced traders and beginners.
- The signals can be used for manual trading (short-term or long-term trading), scalping or binaries.
Unique features:
-
Accurately calculate the market trend normalization
-
It calculates and indicates buy or sell the best moment to make a reversal operation
-
It signals (if you want and select) the Take Profits and Stop Loss
-
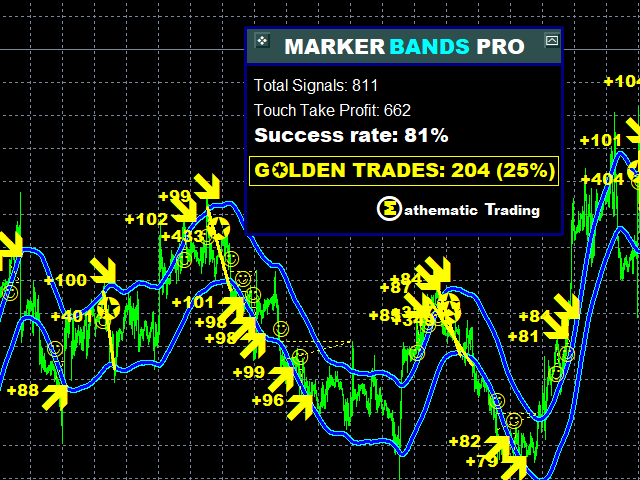
It includes a dashboard which shows the statistics of the average movements of the signals and the score rate of success of the calculation, which will help you to decide your next stop loss or profit.
-
No repaintings
-
Works in all the time frames, pairs, symbols
-
Very visual and simple to use it
-
Included all the sound alerts
-
No minimum account balance
-
Possibility to change the settings instantly
How to use it:
Step 1.- Attach the indicator and select the parameters of the band buffer that works better for you.
Note: there is no need to set up any period, we have already calculate and set up the period that according our algorithms it works efficiently. However you can modify it as you like.
Step 2.- Wait for a signal for buy or sell. Or use the bands to filter your trades.
Input Parameters:
- Bands Buffer: Volatility multiplier, to define the distance between the upper and lower band.
- Bands Period: Period for the calculation of the Bands.
- Signals Period: Period for the calculation of the Signals.
- Arrow Settings: Size and color of the bearish and bullish arrows.
- Alert Settings: Pop up alerts, email or notifications.
- Show DashBoard: Show or hide the Dashboard.
- Take Profit Target: Volatility multiplier to define the Take Profit Level (the happy face) (for the Dashboard simulation)
- Stop Loss Target: Volatility multiplier to define the Stop Loss (for the Dashboard simulation)
- Golden Proportion: Minimum relation between and “profit” and “loss” to be considered one Golden Trade.

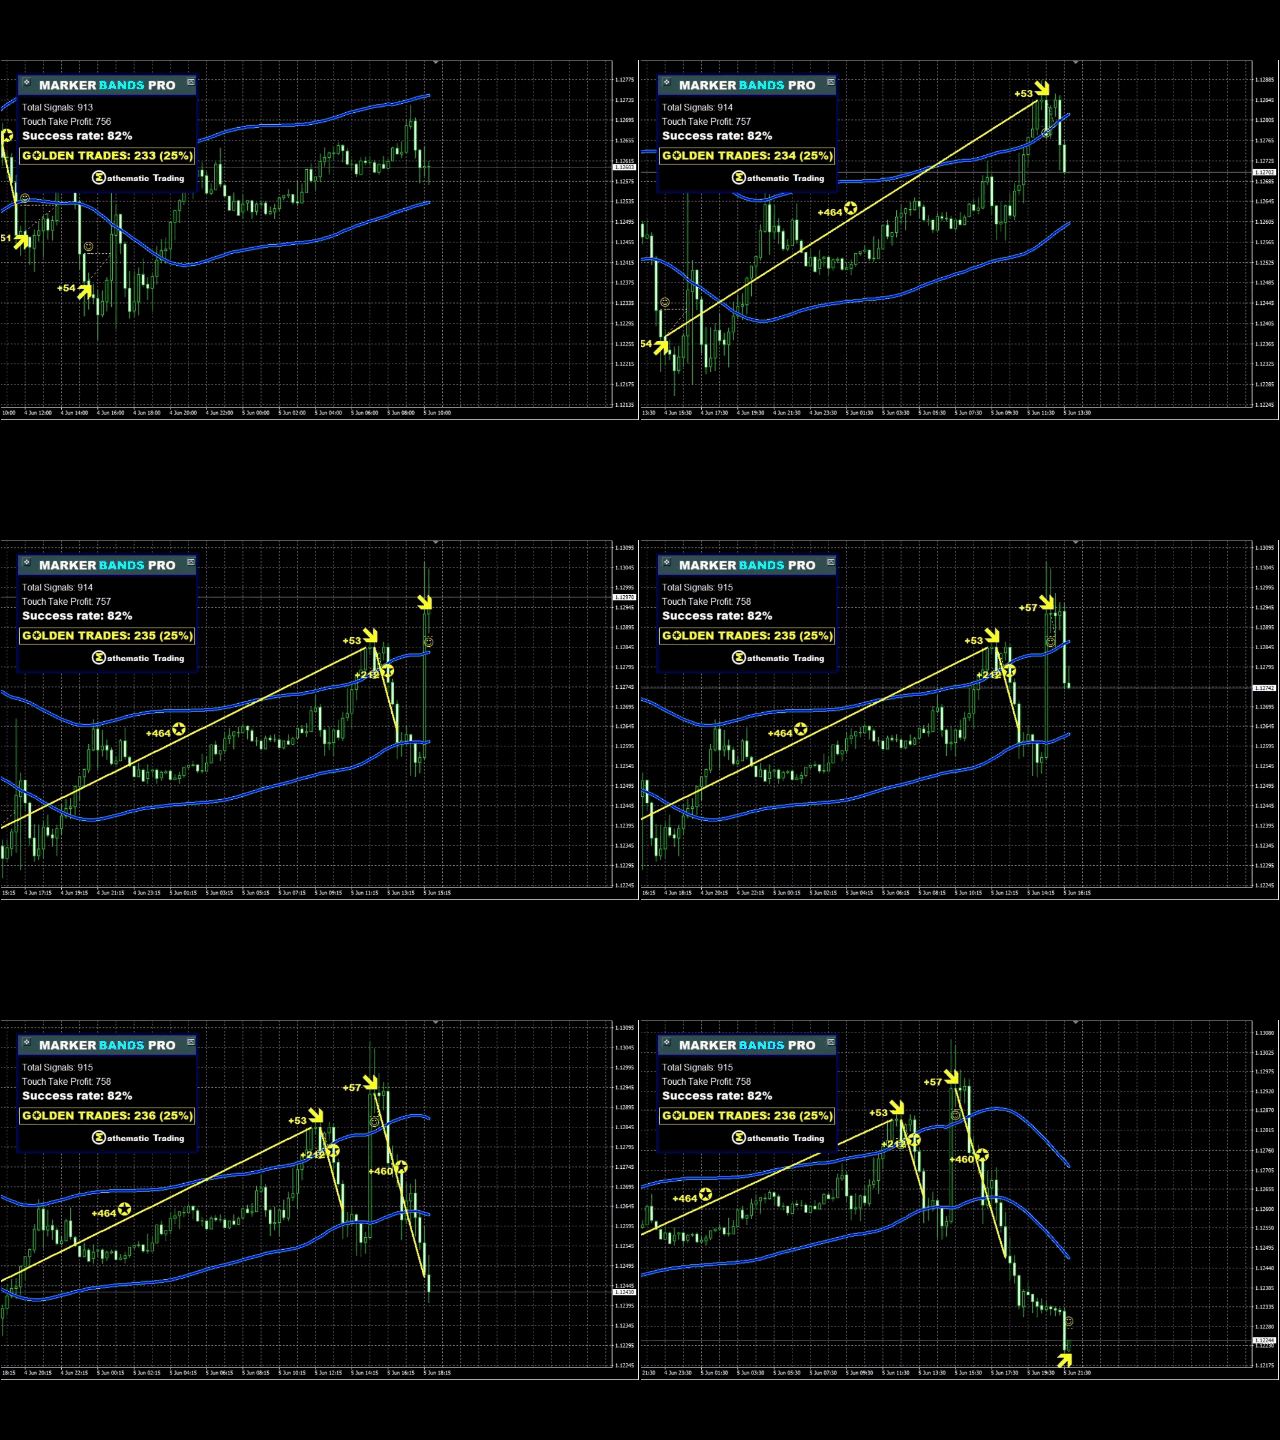












Good, but no so good to go against the trend even on the higher timeframe.