Trend Sight
- 지표
- Pavel Gotkevitch
- 버전: 1.1
- 업데이트됨: 24 3월 2022
- 활성화: 5
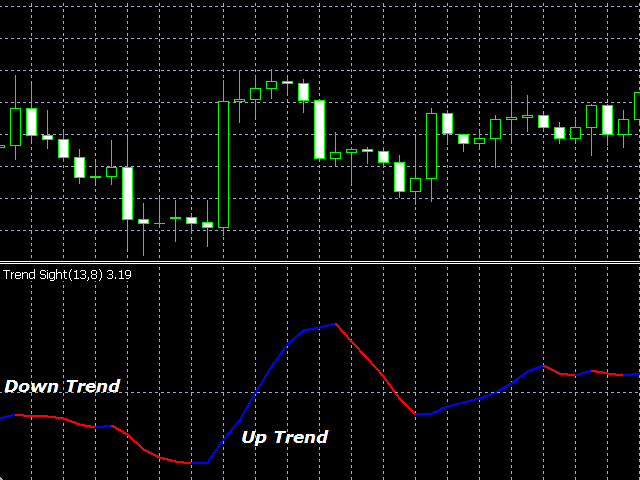
The Trend Sight indicator shows the Moving Average's percent change from the current bar to the other selected bar allowing you to track the smoothed price change rate, as well as trend strength and change.
The uptrend is shown as a blue indicator line, while a downtrend is displayed in red.
Close a short position and open a long one if the line color changes from red to blue.
Close a long position and open a short one if the line color changes from blue to red.
You should use a tight stop loss, because the line color and direction can suddenly be changed.
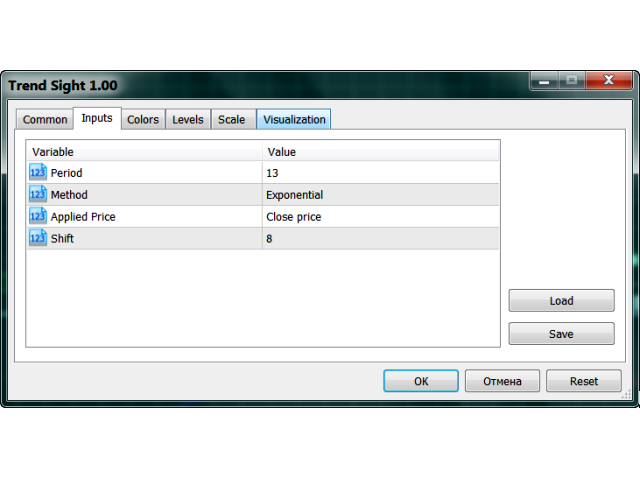
The indicator's Inputs tab allows you to select:
- Moving Average smoothing period
- Moving average smoothing method (Simple, Exponential, Smoothed, Linear weighted)
- Applied price (Close, Open, High, Low, Median, Typical, Weighted)
- Shift of the Moving Average from the current bar to the other selected bar
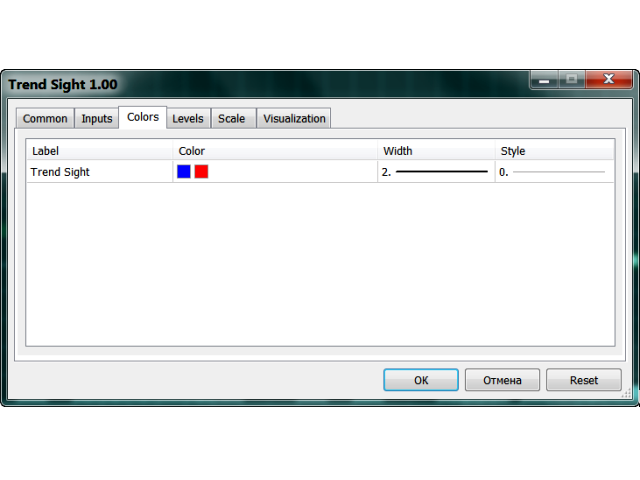
The Colors tab allows you to select the line color, width and style.
Parameters
- period - MA period;
- method - smoothing method (Simple, Exponential, Smoothed, Linear weighted);
- applied price - choose value (Close, Open, High, Low, Median, Typical, Weighted);
- shift - shift of the Moving Average from bar to bar at a distance of Shift.
Note: if Shift is less than 1 or more than Period, the following alert appears: "Incorrect Shift value. The indicator will use the value of Shift = Period.









사용자가 평가에 대한 코멘트를 남기지 않았습니다