Actual Levels
- 지표
- Ilya Fomin
- 버전: 1.2
- 업데이트됨: 19 9월 2018
- 활성화: 10
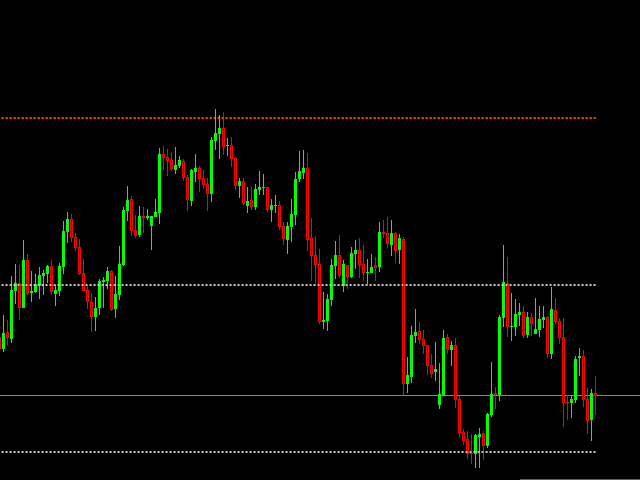
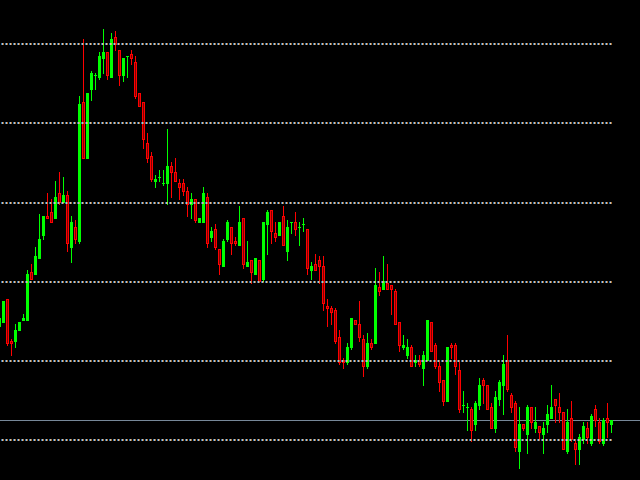
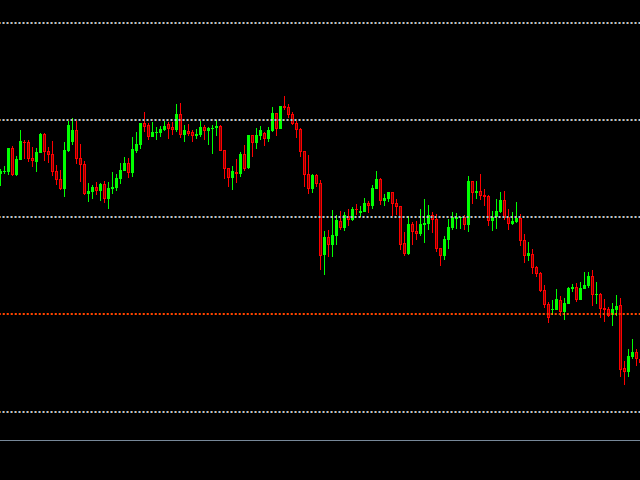
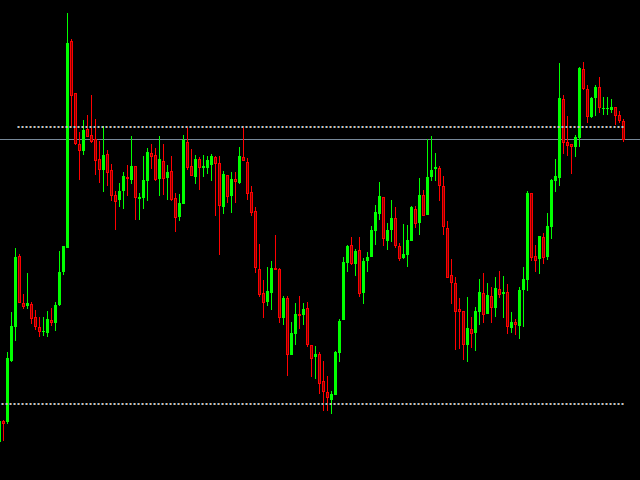
The indicator shows significant support and resistance levels. When the price approaches these levels, it in some way responds either to the levels themselves, or to the areas that are near these levels.
These levels can be viewed as potential reversal zone. Accordingly, the levels can be used for performing trading operations or closing previously opened positions.
For example
You can buy if the price rolls back from the support level upwards, or sell if the price rolls back from the resistance level downwards. You can also perform breakout operations. If the support level is broken (the price is below the level), you can sell. Conversely, if the resistance level is broken (when the price is above), you can buy expecting that the price will go up to the next resistance level.
Indicator Parameters
- Period - indicator calculation period for drawing the levels
- Bars - the number of bars on which the indicator is displayed
- Normal levels - the color of normal levels
- Strong levels - the color of strong levels


Great indicator. Personally I use it for binary options on the 5 minute time frame.
I have a request ... On the next update insert the possibility of having the dots or the classic line.