Waves Of Fibonacci
- 지표
- Roman Vashchilin
- 버전: 2.55
- 업데이트됨: 7 9월 2021
- 활성화: 12
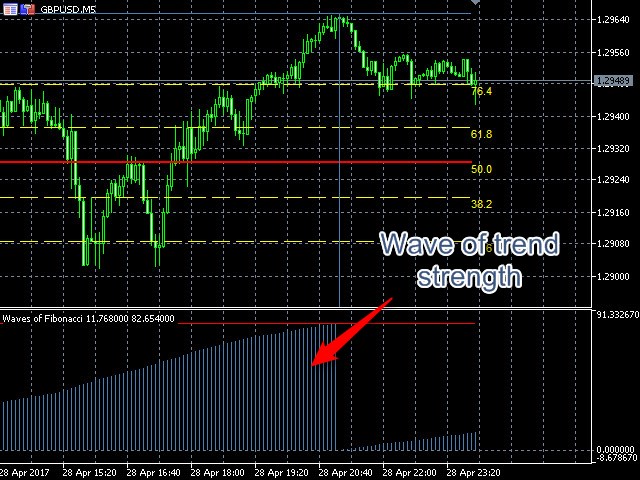
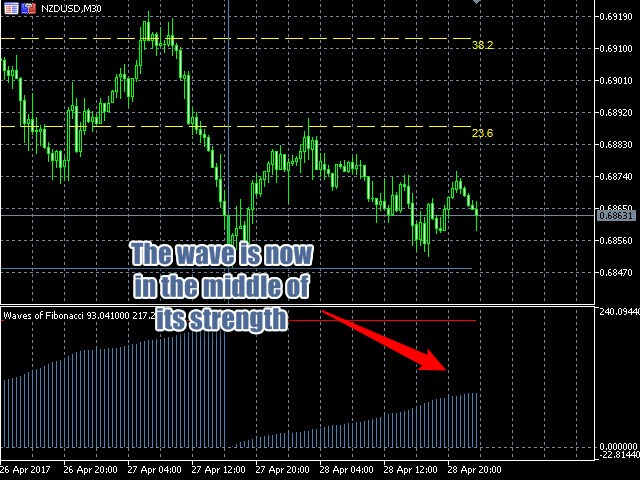
The principle of the indicator operation lies in the analysis of the currency pair history and determining the beginning and the end of the "power" driving the current trend. It also determines the Fibonacci levels in the main window. The indicator also shows how long ago the local Highs and Lows have been reached.
How to Use
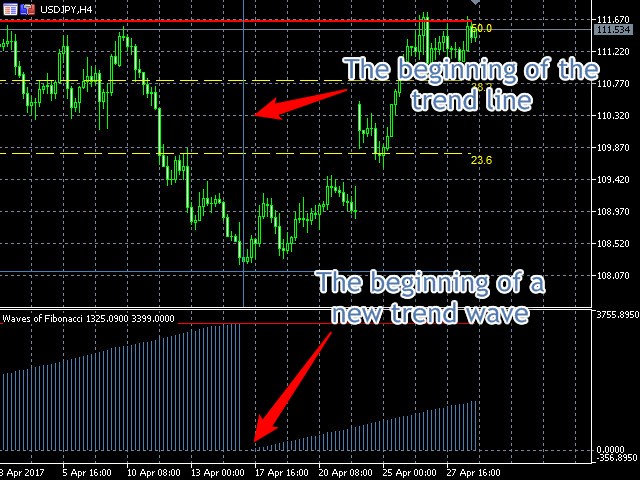
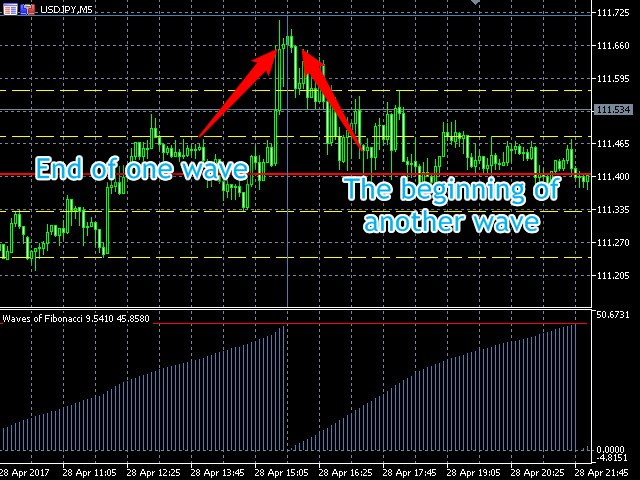
- Waves in the subwindow show the strength and the stage of the trend movement. That is, if the waves only start rising, then the trend is in the initial stage. If the waves rose and they are now reaching the red line on top - the trend will end soon and will possibly reverse;
- Use the indicator waves in the subwindow to determine the beginning and the end of the current trend movement;
- If the waves show that the trend is just starting to gain strength (i.e., if the wave did not reach the middle of the waves window), this means that the trend is likely to continue its movement in the current direction. This is a signal that it is possible to open a position along the trend;
- If the waves show that the trend is finishing its movement (i.e., the wave reached the red line), then the trend is about to reverse. This indicates that a position can be opened soon in the direction opposite to the current trend;
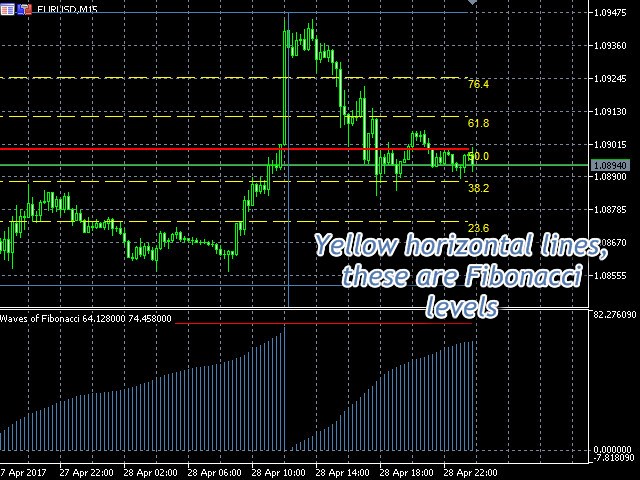
- Also, the indicator automatically shows the Fibonacci levels, which provides vast opportunities for trading numerous strategies related to the Fibonacci levels:
- The essence of the strategy is that a position is opened once the price on the chart bounces off one of the three Fibonacci levels (38.2%, 50% or 61.8%) and formed another retracement below that level. Entries are made on any line of the plotted Fibonacci grid for the new rectracement in the direction of the current trend;
- The Fibonacci levels can also be used for setting the stop loss and take profit levels.
Indicator Features
- The indicator works on any time frame;
- IT works on any currency pair;
- Combines multiple indicators for a full analysis of the market;
- Shows the current state of the trend in real time, which gives the ability to see where and when a trend ends and a new one starts;
- All indicators are plotted automatically, no need to waste time on it;
- All indicators are automatically adjusted to the market movement, no need to readjust them when the market moves;
- Combines numerous possibilities of trading based on different strategies.
Parameters
- Waves (200 by default) - the number of analyzed bars in history of the currency pair. Affects the length of the displayed indicator wave on the chart. The greater the value, the longer the wave and the more accurate the indicator;
- Show Fibo (true by default) - show/hide the automatic Fibonacci lines on the chart.
- For the correct operation of the indicator, the currency pair history must be fully downloaded. It can be downloaded in the Symbols tab in the main menu at the top of the MetaTrader 5 trading terminal.
- If the indicator flickers or lags a bit, this means that the history is not sufficient and it must be downloaded.
Enjoy your trade!





Это не святой Грааль. Этот индикатор просто отлично делает свое дело!