• 미리보기
  • 리뷰 (4)
  • 코멘트 (6)
  • 새 소식

MACD Volume

The MACDVolume indicator is a trading system based on the increase in tick volumes in bars, which match the trend.


Indicator Parameters

  • Fast Moving Average - period of the fast moving average;
  • Slow Moving Average - period of the slow moving average;
  • MA method - averaging method of the moving averages (simple averaging, exponential, smoothed and linear-weighted);
  • Apply to - applied price of the moving averages (Close, Open, High for the period, Low for the period, Median, Typical and Linear-Weighted);
  • Signal Line - period of the signal line;
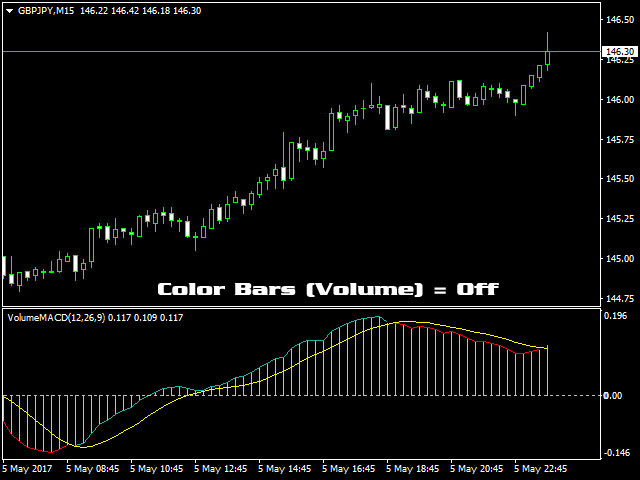
  • Color Bars (Volume) - change the indicator bar colors when the tick volumes in bars increase.

If set to Color Bars (Volume) = On, the MACD histogram bars are colored when the tick volumes increase: by default, a bullish bar with an increased tick volume is colored in green, while a bearish bar is colored in red. If the volume does not increase, the histogram bars are not colored.

If set to Color Bars (Volume) = Off, only the bar frames are colored according to the MACD trend.

A market entry/exit signal is generated when the trend matches an increase in the tick volumes, i.e. when the bar frame color and the MACDVolume histogram colors are the same.

More functional developments: MACD Message and MACD Converter.

Good luck in trading!

추천 제품
History Pattern Search
Yevhenii Levchenko
표시기는 현재 시세를 작성하여 과거 시세와 비교할 수 있으며 이를 바탕으로 가격 변동을 예측합니다. 표시기에는 원하는 날짜로 빠르게 이동할 수 있는 텍스트 필드가 있습니다. 옵션: 기호 - 표시기가 표시할 기호 선택. SymbolPeriod - 지표가 데이터를 가져올 기간 선택. IndicatorColor - 표시기 색상. HorisontalShift - 지시자가 그린 따옴표를 지정된 막대 수만큼 이동합니다. Inverse - true는 인용 부호를 반대로, false - 원래 보기를 반전합니다. ChartVerticalShiftStep - 차트를 수직으로 이동합니다(키보드의 위/아래 화살표). 다음은 날짜를 입력할 수 있는 텍스트 필드의 설정으로, '엔터'를 누르면 즉시 이동할 수 있습니다.
Master scalping M1
Nataliia Marchuk
Master Scalping M1 is an innovative indicator that uses an algorithm to quickly and accurately determine the trend.The indicator calculates the time of opening and closing positions, the indicator's algorithms allow you to find the ideal moments to enter a deal (buy or sell an asset), which increase the success of transactions for most traders. Benefits of the indicator: Easy to assemble, does not overload the chart with unnecessary information. Can be used as a filter for any strategy. Works on
Japanese Candlesticks Monitor scans Japanese candlesticks. It shows a vertical line and a name of a probable candlestick pattern. The indicator is constantly updated, and new patterns are added. Your feedback is most welcome. I have just started working on the indicator, and your opinions are highly appreciated . The indicator does not work on history data . If the indicator has not been launched at a candle opening, that candle is not considered. This means that the indicator works in real time
Trade with Gann on your side!! MASTER CIRCLE 360 CIRCLE CHART, originally created by Gann admitted that this is “The Mother of all charts”. It is one of the last studies that this great trader left for us. The numeric tab le is apparently quite simple like all the tables and is based on square numbers, the SQUARE OF 12 and is by evolution, one of the most important square numbers. Here we can find CYCLE, PRICE AND TIME thanks to angles and grades, to show past and future support and resistance.
TBP All in One
Dmitry Fedoseev
5 (2)
All patterns from Encyclopedia of Chart Patterns by Thomas N. Bulkowski in one indicator. It draws an up or down arrow whenever a pattern is identified. Patterns are selected in the drop-down list of the Pattern variable (located at the beginning of the properties window). The indicator has numerous external parameters, some of them apply to all patterns, while others are selective. To see more information on the parameters used for the selected pattern, enable the ShowHelp variable (located at
Alpha Trend sign has been a very popular trading tool in our company for a long time. It can verify our trading system and clearly indicate trading signals, and the signals will not drift. Main functions: Based on the market display of active areas, indicators can be used to intuitively determine whether the current market trend belongs to a trend market or a volatile market. And enter the market according to the indicator arrows, with green arrows indicating buy and red arrows indicating se
PZ Trend Trading
PZ TRADING SLU
4.8 (5)
Capture every opportunity: your go-to indicator for profitable trend trading Trend Trading is an indicator designed to profit as much as possible from trends taking place in the market, by timing pullbacks and breakouts. It finds trading opportunities by analyzing what the price is doing during established trends. [ Installation Guide | Update Guide | Troubleshooting | FAQ | All Products ] Trade financial markets with confidence and efficiency Profit from established trends without getting whip
Swing or Scalp
Jermaine Wedderburn
Coloured price charts, generating black arrows.  User can change the colours of the arrows in the colour section of the indicator.  It is consider a great scalping tool on lower time-frames, while higher time frames will have fewer opportunities but trades will possibly last longer.  There is an input for Alert on or off.  This can be used effectively on M15/M30 Chart until up to H4 chart time.  It is best if the user has some experience with money management, utilising trailing stop to protect
Smart trends
Yvan Musatov
Smart indicator Smart trend allows you to find the most likely trend reversal points. You will not find this indicator anywhere else. A simple but effective system for determining the forex trend. From the screenshots you can see for yourself the accuracy of this tool. Works on all currency pairs, stocks, raw materials, cryptocurrencies. This is a trend indicator for the MetaTrader 4 trading platform. The alert system (alert, email notifications) will help you monitor several trading instrumen
VR Grid
Vladimir Pastushak
5 (3)
VR 그리드 표시기는 사용자 정의 설정으로 그래픽 그리드를 생성하도록 설계 되었습니다. 표준 그리드 와 달리 VR 그리드는 원형 레벨 을 구축하는 데 사용됩니다. 사용자의 선택에 따라 라운드 수준 사이의 단계는 임의적일 수 있습니다. 또한 VR Grid는 다른 인디케이터나 유틸리티와는 달리 기간이 바뀌거나 단말기를 재부팅해도 그리드의 위치 를 유지합니다. 설정, 세트 파일, 데모 버전, 지침, 문제 해결 등은 다음에서 얻을 수 있습니다. [블로그] 다음에서 리뷰를 읽거나 작성할 수 있습니다. [링크] 버전 [MetaTrader 5] 수직 수준 은 실제 시간 간격을 기준으로 하며 누락 또는 존재하지 않는 기간은 무시 합니다. 따라서 레벨 사이의 단계는 사용자가 선택한 값과 엄격하게 일치합니다. VR 그리드 표시기를 사용할 때 트레이더는 모든 수준에서 스타일 , 수직선 및 수평선의 색상 및 두께를 변경할 수 있습니다. 이를 통해 금융 상품의 라운드 수준 을 제어할 수 있습니다. 라운
FREE
캔들의 종가를 예측하는 지표입니다. 지표는 주로 D1 차트에서 사용하기 위한 것이. 이 지표는 전통적인 외환 거래와 바이너리 옵션 거래 모두에 적합합니다. 지표는 독립형 거래 시스템으로 사용하거나 기존 거래 시스템에 추가로 사용할 수 있습니다. 이 표시기는 현재 양초를 분석하여 양초 본체 내부의 특정 강도 요인과 이전 양초의 매개변수를 계산합니다. 따라서 지표는 시장 움직임의 추가 방향과 현재 양초의 종가를 예측합니다. 이 방법 덕분에 지표는 단기 및 중장기 거래 모두에 적합합니다. 지표를 사용하면 시장 상황을 분석하는 동안 지표가 생성할 잠재적 신호의 수를 설정할 수 있습니다. 표시기 설정에는 이를 위한 특별한 매개변수가 있습니다. 또한 인디케이터는 새로운 신호에 대해 차트의 메시지 형태, 이메일 및 PUSH 알림 형태로 알릴 수 있습니다. 구매 후 저에게 꼭 써주세요! 나는 당신에게 지표와 거래에 대한 나의 추천을 줄 것입니다! 또한 보너스를 받으세요!
FreqoMeterForecast
Stanislav Korotky
The main idea of this indicator is rates analysis and prediction by Fourier transform. Indicator decomposes exchange rates into main harmonics and calculates their product in future. You may use the indicator as a standalone product, but for better prediction accuracy there is another related indicator - FreqoMaster - which uses FreqoMeterForecast as a backend engine and combines several instances of FreqoMeterForecast for different frequency bands. Parameters: iPeriod - number of bars in the ma
PipFinite Exit EDGE
Karlo Wilson Vendiola
4.83 (115)
Did You Have A Profitable Trade But Suddenly Reversed? In a solid strategy, exiting a trade is equally important as entering. Exit EDGE helps maximize your current trade profit and avoid turning winning trades to losers. Never Miss An Exit Signal Again Monitor all pairs and timeframes in just 1 chart www.mql5.com/en/blogs/post/726558 How To Trade You can close your open trades as soon as you receive a signal Close your Buy orders if you receive an Exit Buy Signal. Close your Sell orders if
BE auto
Muhammad Ridzuan Mohd Radzali
5 (2)
Indicator automatically draw bullish and bearish engulfing without any rules. Bearish and Bullish engulf is well known area for supply and demand area marking. This indicator can be used in any strategy that required supply demand zone. Show Last Engulf : Enable this option to show unfresh engulfing  Candle to calculate : set 0 will load all history bar and can use up more memory Bearish Engulfing Colour : Pick any colour that suit Bearish Engulfing Colour  : Pick any colour that suit -Use this
FREE
Infinity Trend Pro
Yaroslav Varankin
1 (1)
This is a trend indicator without redrawing Developed instead of the binary options strategy (by the color of the Martingale candlestick) Also works well in forex trading When to open trades (binary options) A signal will appear in the place with a candle signaling the current candle It is recommended to open a deal for one candle of the current timeframe M1 and M5 When a blue dot appears, open a deal up When a red dot appears, open a trade down. How to open trades on Forex. When a signal is rec
True SnD
Indra Lukmana
5 (1)
This Supply & Demand indicator uses a unique price action detection to calculate and measures the supply & demand area. The indicator will ensure the area are fresh and have a significant low risk zone. Our Supply Demand indicator delivers functionality previously unavailable on any trading platform. Trading idea You may set pending orders along the supply & demand area. You may enter a trade directly upon price hit the specific area (after a rejection confirmed). Input parameters Signal - Set
Auto Fibo Pro m
DMITRII GRIDASOV
"Auto FIBO Pro" Crypto_Forex 지표 - 거래에 유용한 보조 도구입니다! - 지표는 자동으로 Fibo 수준과 로컬 추세선(빨간색)을 계산하여 차트에 배치합니다. - Fibonacci 수준은 가격이 반전될 수 있는 주요 영역을 나타냅니다. - 가장 중요한 수준은 23.6%, 38.2%, 50%, 61.8%입니다. - 역전 스캘핑이나 존 그리드 거래에 사용할 수 있습니다. - Auto FIBO Pro 지표를 사용하여 현재 시스템을 개선할 수 있는 기회도 많습니다. - Info Spread Swap Display가 있습니다. 현재 Spread와 Swap이 부착된 외환 쌍을 표시합니다. - 디스플레이에는 계정 잔액, 자본 및 마진도 표시됩니다. - 차트의 어느 모서리에서나 Info Spread Swap Display를 찾을 수 있습니다. 0 - 왼쪽 상단 모서리, 1 - 오른쪽 상단, 2 - 왼쪽 하단, 3 - 오른쪽 하단. // 훌륭한 트레이딩 로봇과 지표는 여기
Trend PA
Mikhail Nazarenko
5 (3)
The Trend PA indicator uses   Price Action   and its own filtering algorithm to determine the trend. This approach helps to accurately determine entry points and the current trend on any timeframe. The indicator uses its own algorithm for analyzing price changes and Price Action. Which gives you the advantage of recognizing, without delay, a new nascent trend with fewer false positives. Trend filtering conditions can be selected in the settings individually for your trading style. The indicator
Candle Inside indicator - draws Japanese candlesticks of a higher timeframe on the chart. Now, after loading the indicator, it is possible to see what is happening inside each candle. In addition to the standard buttons for selecting the timeframe in the MT-4 terminal, additional buttons are added, when clicked, an older period is selected to display Japanese candles or zones. For example, if you select the standard period M1 and the period of the indicator M5, then the chart will display minute
UPD1 Rails Dashboard
Vitaliy Kuznetsov
인디케이터는 차트에 "레일" 패턴을 표시합니다. 이 패턴은 동일한 몸통과 작은 그림자를 가진 두 개의 다방향 캔들로 구성됩니다. 현재 차트주기에 "레일" 패턴이 표시되면 x2 차트주기에 핀 바(도지) 모양으로 표시됩니다. 이 인디케이터는 쉽게 변경할 수 있는 논리적으로 간단한 설정으로 가장 효율적인 방법으로 패턴을 자동으로 찾기 위해 만들어졌습니다. 추세(2개 이동평균) 및 반전(RSI 및 볼린저 밴드)을 기준으로 필터링할 수 있는 옵션이 있습니다. 다중 통화 패널을 사용할 수 있습니다. 도움을 받으면 차트 사이를 쉽게 전환 할 수 있습니다. 거래 패턴: 추세 재테스트. 거짓 브레이크아웃. 기타. EURUSD, GBPUSD, XAUUSD, ... M15, M30, H1. 입력 매개 변수. 기본. Bars Count - 인디케이터가 작동할 히스토리 막대의 수입니다. Max Candles Shadows / Body Ratio - 캔들 몸통에 대한 그림자의 최대 비율입니다. 그림
Fibonacci retracement and extension line drawing tool Fibonacci retracement and extended line drawing tool for MT4 platform is suitable for traders who use  golden section trading Advantages: There is no extra line, no too long line, and it is easy to observe and find trading opportunities Trial version: https://www.mql5.com/zh/market/product/35884 Main functions: 1. Multiple groups of Fibonacci turns can be drawn directly, and the relationship between important turning points can be seen
Trend Deviation
VLADISLAV AKINDINOV
Trend indicator with calculation of dynamic levels and signaling their intersection. Description of input parameters: StepTF = true; - Calculation of the indicator by closing the bar (true) or by each tick (false) BarsCount = 300; - Number of settlement bars Price = PRICE_CLOSE; - Type of price used TimeFrame = PERIOD_CURRENT; - Estimated timeframe TrendPeriod = 9; - Trend calculation period TrendDeviations = 4.9; - coefficient of deviation PeriodTrendSmooth = 1; - Trend smoothing perio
BoxChart MT4
Evgeny Shevtsov
4.5 (6)
The market is unfair if only because 10% of participants manage 90% of funds. An ordinary trader has slim changes to stand against these "vultures". This problem can be solved. You just need to be among these 10%, learn to predict their intentions and move with them. Volume is the only preemptive factor that faultlessly works on any timeframe and symbol. First, the volume appears and is accumulated, and only then the price moves. The price moves from one volume to another. Areas of volume accumu
Crypto_Forex 지표 "동적 과매도/과매수 구역이 있는 강제 지수" MT4용, 리페인트 없음. - 강제 지수는 가격과 거래량 데이터를 단일 값으로 결합하는 최고의 지표 중 하나입니다. - 동적 과매수 구역에서 매도 거래를 하고 동적 과매도 구역에서 매수 거래를 하는 것이 좋습니다. - 이 지표는 추세 방향으로 모멘텀 거래를 하는 데 매우 좋습니다. - 동적 과매수 구역 - 노란색 선 위. - 동적 과매도 구역 - 파란색 선 아래. - 강제 지수 자체는 강력한 오실레이터로, 가격을 움직이는 데 사용된 전력량을 측정합니다. - PC 및 모바일 알림이 있습니다. // 훌륭한 트레이딩 로봇과 지표는 여기에서 제공됩니다: https://www.mql5.com/en/users/def1380/seller 이 MQL5 웹사이트에서만 제공되는 오리지널 제품입니다.
Switchman
Vitalii Zakharuk
Switchman is a smart indicator without delays or redrawing that shows the trend of the selected timeframes. The most important task of a trader is to spot a trend and follow it on time. Uses an algorithm for calculating finding possible price reversals. It can be used as an additional or auxiliary tool for your trading strategy. The current timeframe the indicator is set to is used. Using arrows for this that show the direction of the pivot points. Can be used with an optimal risk to reward r
Future Candle One Candle is an arrow indicator of candlestick patterns, based on the calculation of historical statistics. It identifies and calculates patterns consisting of one candle. Advantages of the indicator Gives information about the next candle right now; The indicator values are based on statistical data on the history of the current instrument; Forecasts and displays the result of trading based on its signals; The colors of the indicator have been selected for a comfortable operatio
Signal trend indicator. Detects the direction of the trend and is coloured accordingly.  Has built in audible and visual alerts when trends change. Can send notifications to your phone or email. Allows Trend and Counter-Trend trading. Works on all timeframes, all currency pairs, metals, indices and cryptocurrencies. Can be used with binary options. Distinctive features No re-drawing; Simple and clear settings; Four types of alerts; Works on all timeframes and all trading tools; Suitable
Blahtech Market Profile
Blahtech Limited
4.53 (15)
Was: $249  Now: $149   Market Profile defines a number of day types that can help the trader to determine market behaviour. A key feature is the Value Area, representing the range of price action where 70% of trading took place. Understanding the Value Area can give traders valuable insight into market direction and establish the higher odds trade. It is an excellent addition to any system you may be using. Blahtech Limited presents their Market Profile indicator for the MetaTrader community. In
MovingFlatBreakout
Stanislav Korotky
This indicator monitors the market for a flat state and possible breakout. The flat state is detected as a predefined number of consecutive bars during which price fluctuates inside a small range. If one of the next bars closes outside the range, breakout is signaled. The indicator shows 3 lines: blue - upper bound of flat ranges AND consecutive breakout areas; red - lower bound of flat ranges AND consecutive breakout areas; yellow - center of flat ranges (NOT including breakout areas). When a b
이 제품의 구매자들이 또한 구매함
Gann Made Easy
Oleg Rodin
4.8 (116)
Gann Made Easy 는 mr.의 이론을 사용하여 최고의 거래 원칙을 기반으로 하는 전문적이고 사용하기 쉬운 Forex 거래 시스템입니다. W.D. 간. 이 표시기는 Stop Loss 및 Take Profit Levels를 포함하여 정확한 BUY 및 SELL 신호를 제공합니다. PUSH 알림을 사용하여 이동 중에도 거래할 수 있습니다. 구매 후 연락주세요! 내 거래 팁과 훌륭한 보너스 지표를 무료로 공유하겠습니다! 아마도 Gann 거래 방법에 대해 이미 여러 번 들었을 것입니다. 일반적으로 Gann의 이론은 초보자 거래자뿐만 아니라 이미 거래 경험이 있는 사람들에게도 매우 복잡한 것입니다. Gann의 거래 방식은 이론적으로 적용하기 쉽지 않기 때문입니다. 나는 그 지식을 연마하고 Forex 지표에 최고의 원칙을 적용하기 위해 몇 년을 보냈습니다. 표시기는 적용하기가 매우 쉽습니다. 차트에 첨부하고 간단한 거래 권장 사항을 따르기만 하면 됩니다. 지표는 지속적으로 시장 분석 작업
현재 20% 할인 ! 초보자 또는 전문가 트레이더를 위한 최고의 솔루션! 이 대시보드 소프트웨어는 28개의 통화 쌍에서 작동합니다. 2가지 주요 지표(Advanced Currency Strength 28 및 Advanced Currency Impulse)를 기반으로 합니다. 전체 Forex 시장에 대한 훌륭한 개요를 제공합니다. 고급 통화 강도 값, 통화 이동 속도 및 모든(9) 시간대의 28 Forex 쌍에 대한 신호를 보여줍니다. 추세 및/또는 스캘핑 기회를 정확히 파악하기 위해 차트의 단일 지표를 사용하여 전체 시장을 볼 수 있을 때 거래가 어떻게 개선될지 상상해 보십시오! 잠재적인 거래를 식별하고 확인하면서 강력한 통화와 약한 통화를 더욱 쉽게 식별할 수 있도록 이 지표에 기능을 내장했습니다. 이 표시기는 통화의 강세 또는 약세가 증가 또는 감소하는지 여부와 모든 시간대에서 수행되는 방식을 그래픽으로 보여줍니다. 추가된 새로운 기능은 현재 시장 조건 변화에 적응하는
Scalper Inside PRO
Alexey Minkov
4.76 (63)
!SPECIAL SALE! An exclusive indicator that utilizes an innovative algorithm to swiftly and accurately determine the market trend. The indicator automatically calculates opening, closing, and profit levels, providing detailed trading statistics. With these features, you can choose the most appropriate trading instrument for the current market conditions. Additionally, you can easily integrate your own arrow indicators into Scalper Inside Pro to quickly evaluate their statistics and profitability
Gold Stuff
Vasiliy Strukov
4.86 (255)
Gold Stuff는 금을 위해 특별히 설계된 추세 지표이며 모든 금융 상품에서도 사용할 수 있습니다. 표시기가 다시 그려지지 않고 지연되지 않습니다. 권장 기간 H1. 표시기에서 완전 자동 Expert Advisor EA Gold Stuff를 작동합니다. 내 프로필에서 찾을 수 있습니다. 설정 및 개인 보너스를 받으려면 구매 후 즉시 저에게 연락하십시오!   강력한 지원 및 트렌드 스캐너 표시기의 무료 사본을 받으실 수 있습니다. 메시지를 보내주세요. 나!   설정 화살표 그리기 - 켜기 끄기. 차트에 화살표 그리기. 경고 - 가청 경고를 끕니다. 이메일 알림 - 켜기 끄기. 이메일 알림. Puch-notification - 켜기 끄기. 푸시 알림. 다음으로 색 영역을 조정합니다. Gold Stuff는 금을 위해 특별히 설계된 추세 지표이며 모든 금융 상품에서도 사용할 수 있습니다. 표시기가 다시 그려지지 않고 지연되지 않습니다. 권장 기간 H1. 표시기에서 완전 자동
Dynamic Forex28 Navigator
Bernhard Schweigert
5 (5)
Dynamic Forex28 Navigator - 차세대 외환 거래 도구. 현재 49% 할인. Dynamic Forex28 Navigator는 오랫동안 인기 있는 지표의 진화형으로, 세 가지의 힘을 하나로 결합했습니다. 고급 통화 Strength28 지표(695개 리뷰) + 고급 통화 IMPULSE with ALERT(520개 리뷰) + CS28 콤보 신호(보너스). 지표에 대한 자세한 정보 https://www.mql5.com/en/blogs/post/758844 차세대 Strength 지표는 무엇을 제공합니까?  원래 지표에서 좋아했던 모든 것이 새로운 기능과 더 높은 정확도로 강화되었습니다. 주요 기능: 독점적인 통화 Strength 공식.  모든 시간대에 걸쳐 부드럽고 정확한 강도선. 추세와 정확한 진입을 식별하는 데 이상적입니다. 역동적인 시장 피보나치 수준(시장 피보나치).  이 지표에만 있는 고유한 기능. 가격 차트가 아닌 통화 강도에 피보나치가 적용됩니다.
M1 Arrow
Oleg Rodin
5 (17)
시장의 두 가지 기본 원칙에 기반한 일중 전략. 알고리즘은 추가 필터를 사용하여 거래량 및 가격 파동 분석을 기반으로 합니다. 지표의 지능형 알고리즘은 두 가지 시장 요인이 하나로 결합될 때만 신호를 제공합니다. 지표는 더 높은 시간 프레임의 데이터를 사용하여 M1 차트에서 특정 범위의 파도를 계산합니다. 그리고 파동을 확인하기 위해 지표는 볼륨 분석을 사용합니다. 이 표시기는 준비된 거래 시스템입니다. 트레이더가 필요로 하는 모든 것은 신호를 따르는 것입니다. 또한 지표는 자신의 거래 시스템의 기초가 될 수 있습니다. 거래는 분 차트에서만 수행됩니다. 지표가 MTF 원리를 사용한다는 사실에도 불구하고 지표 알고리즘은 가능한 한 안정적입니다. 구매 후 반드시 저에게 편지를 보내주세요! 내 거래 설정 및 권장 사항을 공유하겠습니다!
Scalper Vault
Oleg Rodin
5 (29)
Scalper Vault 는 성공적인 스캘핑에 필요한 모든 것을 제공하는 전문 스캘핑 시스템입니다. 이 표시기는 외환 및 바이너리 옵션 거래자가 사용할 수 있는 완전한 거래 시스템입니다. 권장 시간 프레임은 M5입니다. 시스템은 추세 방향으로 정확한 화살표 신호를 제공합니다. 또한 상단 및 하단 신호와 Gann 시장 수준을 제공합니다.  이 시스템은 사용하기가 매우 쉽습니다. 원하는 시장 지역의 화살표만 따라가면 됩니다. 엑시트는 가격이 적정 수준에 도달하거나 시장의 고점 또는 저점 신호가 나타날 때 수행됩니다.  표시기는 PUSH 알림을 포함한 모든 유형의 경고를 제공합니다. 인디케이터 구매 후 연락주세요. 내 개인 거래 권장 사항과 훌륭한 보너스 지표를 무료로 공유합니다! 나는 당신에게 행복하고 유익한 거래를 기원합니다!
Golden Trend Indicator
Noha Mohamed Fathy Younes Badr
4.9 (10)
Golden Trend indicator  is The best indicator for predicting trend movement this indicator never lags and never repaints and never back paints    and give  arrow buy and sell    before the candle appear  and it will help you and  will make your trading decisions clearer its work on all currencies and  gold and crypto and all time frame This unique  indicator uses very secret algorithms to catch the  trends, so you can trade using this indicator and see the trend clear on charts  manual guide and
Easy Breakout
Mohamed Hassan
5 (10)
After your purchase, feel free to contact me for more details on how to receive a bonus indicator called VFI, which pairs perfectly with Easy Breakout for enhanced confluence!   Easy Breakout is a powerful price action trading system built on one of the most popular and widely trusted strategies among traders: the Breakout strategy ! This indicator delivers crystal-clear Buy and Sell signals based on breakouts from key support and resistance zones. Unlike typical breakout indicators, it levera
Enigmera
Ivan Stefanov
5 (7)
ENIGMERA: 시장의 핵심 중요: MQL5.com의 데모는 Strategy Tester에서 실행되며 Enigmera의 기능을 완전히 반영하지 못할 수 있습니다. 설명, 스크린샷 및 비디오를 확인하여 자세한 내용을 확인하십시오. 질문이 있으면 언제든지 메시지를 보내주세요! 인디케이터의 코드는 완전히 다시 작성되었습니다. 버전 3.0은 새로운 기능을 추가하고 인디케이터가 처음 출시된 이후 누적된 버그를 수정했습니다. 소개 이 인디케이터 및 거래 시스템은 금융 시장에 대한 주목할 만한 접근 방식입니다. ENIGMERA는 프랙탈 주기를 사용하여 정확하게 지원 및 저항 수준을 계산합니다. 실제 축적 단계를 보여주고 방향과 목표를 제공합니다. 트렌드와 수정 모두에서 작동하는 시스템입니다. 작동 방식 인디케이터의 대부분의 기능은 차트 왼쪽에 있는 버튼을 통해 제어되며, 이를 통해 다양한 시장 상황에 빠르게 대응할 수 있습니다. 버튼 ON/OFF – 인디케이터 전체를 표시하거나 숨깁니다.
Linear Trend Predictor - 진입 지점과 방향성 지원선을 결합한 추세 지표입니다. 고가/저가 채널을 돌파하는 원칙에 따라 작동합니다. 지표 알고리즘은 시장 노이즈를 걸러내고 변동성과 시장 역학을 고려합니다. 표시기 기능  평활화 방법을 사용하여 시장 추세와 BUY 또는 SELL 주문을 시작하기 위한 진입 시점을 보여줍니다.  모든 기간의 차트를 분석하여 단기 및 장기 시장 움직임을 파악하는 데 적합합니다.  어떠한 시장과 시간대에도 적용할 수 있으며, 입력 매개변수를 통해 거래자는 자신에게 맞게 지표를 독립적으로 사용자 지정할 수 있습니다.  설정된 지표 신호는 사라지거나 다시 그려지지 않습니다. 이는 캔들 마감 시 결정됩니다. 현재 캔들에 적용하여 신호를 더 일찍 받는 것도 가능하지만, 신호가 바뀔 수 있습니다.  여러 유형의 알림이 화살표와 결합되어 있습니다.  이 지표는 독립적인 거래 시스템으로 사용할 수도 있고, 다른 거래 시스템에 추가하는 용도로도 사용
Algo Pumping MT4
Ihor Otkydach
5 (4)
PUMPING STATION – 당신만을 위한 올인원(All-in-One) 전략 PUMPING STATION은 당신의 외환 거래를 더욱 흥미롭고 효과적으로 바꿔줄 혁신적인 인디케이터입니다. 단순한 보조 도구가 아니라, 강력한 알고리즘을 갖춘 완전한 거래 시스템으로서 보다 안정적인 트레이딩을 시작할 수 있도록 도와줍니다. 이 제품을 구매하시면 다음의 혜택을   무료로   받으실 수 있습니다: 전용 설정 파일: 자동 설정으로 최대의 퍼포먼스를 제공합니다. 단계별 동영상 가이드: PUMPING STATION 전략으로 거래하는 법을 배워보세요. Pumping Utility: PUMPING STATION과 함께 사용하도록 설계된 반자동 거래 봇으로, 거래를 더욱 쉽고 편리하게 만들어줍니다. ※ 구매 후 바로 저에게 메시지를 보내주세요. 추가 자료에 대한 접근 권한을 제공해드립니다. PUMPING STATION은 어떻게 작동하나요? 트렌드 컨트롤: 시장의 추세 방향을 즉시 파악합니다. 추세는
Trend Screener
STE S.S.COMPANY
4.78 (93)
트렌드 표시기, 트렌드 트레이딩 및 필터링을 위한 획기적인 고유 솔루션, 하나의 도구 안에 내장된 모든 중요한 트렌드 기능! Forex, 상품, 암호 화폐, 지수 및 주식과 같은 모든 기호/도구에 사용할 수 있는 100% 다시 칠하지 않는 다중 시간 프레임 및 다중 통화 표시기입니다. 기간 한정 특가: 지원 및 저항 스크리너 지표는 단 100달러에 평생 제공됩니다. (원래 가격 50 달러) (제안 연장) Trend Screener는 차트에 점이 있는 화살표 추세 신호를 제공하는 효율적인 지표 추세 추종 지표입니다. 추세 분석기 표시기에서 사용할 수 있는 기능: 1. 트렌드 스캐너. 2. 최대 이익 분석이 있는 추세선. 3. 추세 통화 강도 측정기. 4. 경고가 있는 추세 반전 점. 5. 경고가 있는 강력한 추세 점. 6. 추세 화살표 Trend Screener Indicator가 있는 일일 분석 예, 일일 신호 성능...등은 여기에서 찾을 수 있습니다.   여기를 클릭하십시오. L
Apollo Secret Trend
Oleg Rodin
5 (6)
Apollo Secret Trend는 모든 쌍과 시간대의 추세를 찾는 데 사용할 수 있는 전문적인 추세 지표입니다. 지표는 거래를 선호하는 쌍이나 기간에 관계없이 시장 동향을 감지하는 데 사용할 수 있는 주요 거래 지표가 될 수 있습니다. 표시기의 특수 매개변수를 사용하여 개인 거래 스타일에 맞게 신호를 조정할 수 있습니다. 표시기는 PUSH 알림을 포함한 모든 유형의 경고를 제공합니다. 표시기의 신호는 다시 칠하지 마십시오! 제공된 스크린샷에서 과매수/과매도 오실레이터 표시기와 함께 Apollo Secret Trend 표시기를 볼 수 있습니다. 이 표시기는 제가 절대적으로 무료로 제공합니다. 구매 후 두 번째 과매수 및 과매도 오실레이터 표시기를 무료로 받으려면 저에게 연락하십시오! 또한 시스템 사용 방법에 대한 지침도 제공합니다. 나는 또한 당신에게 큰 보너스를 공유 할 것입니다!
FX Power MT4 NG
Daniel Stein
4.94 (18)
FX Power: 통화 강세 분석으로 더 스마트한 거래 결정을 개요 FX Power 는 어떤 시장 상황에서도 주요 통화와 금의 실제 강세를 이해하기 위한 필수 도구입니다. 강한 통화를 매수하고 약한 통화를 매도함으로써 FX Power 는 거래 결정을 단순화하고 높은 확률의 기회를 발견합니다. 트렌드를 따르거나 극단적인 델타 값을 사용해 반전을 예측하고자 한다면, 이 도구는 귀하의 거래 스타일에 완벽히 적응합니다. 단순히 거래하지 말고, FX Power 로 더 스마트하게 거래하세요. 1. FX Power가 거래자에게 매우 유용한 이유 통화와 금의 실시간 강세 분석 • FX Power 는 주요 통화와 금의 상대적 강세를 계산하고 표시하여 시장 역학에 대한 명확한 통찰력을 제공합니다. • 어떤 자산이 앞서고 있고 어떤 자산이 뒤처지는지 모니터링하여 보다 현명한 거래 결정을 내릴 수 있습니다. 포괄적인 멀티 타임프레임 뷰 • 단기, 중기 및 장기 타임프레임에서 통화와 금의 강세를
- Real price is 80$ - 40% Discount (It is 49$ now) - Lifetime update free Contact me for instruction, add group and any questions! Related Products:  Bitcoin Expert , Gold Expert - Non-repaint - I just sell my products in Elif Kaya profile, any other websites are stolen old versions, So no any new updates or support. Introduction The breakout and retest strategy is traded support and resistance levels. it involves price breaking through a previous level.  The break and retest strategy is design
FX Volume
Daniel Stein
4.6 (35)
FX Volume: 브로커 시각에서 바라보는 진짜 시장 심리 간단 요약 트레이딩 접근 방식을 한층 더 향상시키고 싶으신가요? FX Volume 는 소매 트레이더와 브로커의 포지션을 실시간으로 파악할 수 있게 해 줍니다. 이는 COT 같은 지연된 보고서보다 훨씬 빠릅니다. 꾸준한 수익을 추구하는 분이든, 시장에서 더 깊은 우위를 원하시는 분이든, FX Volume 을 통해 대규모 불균형을 찾아내고, 돌파 여부를 확인하며 리스크 관리를 정교화할 수 있습니다. 지금 시작해 보세요! 실제 거래량 데이터가 의사결정을 어떻게 혁신할 수 있는지 직접 경험해 보시기 바랍니다. 1. 트레이더에게 FX Volume이 매우 유익한 이유 탁월한 정확도를 지닌 조기 경보 신호 • 다른 사람들보다 훨씬 앞서, 각 통화쌍을 매수·매도하는 트레이더 수를 거의 실시간으로 파악할 수 있습니다. • FX Volume 은 여러 리테일 브로커에서 추출한 실제 거래량 데이터를 종합해 명확하고 편리한 형태로 제공하는
Grabber System MT4
Ihor Otkydach
3 (2)
탁월한 기술적 지표인 Grabber를 소개합니다. 이 도구는 즉시 사용 가능한 “올인원(All-Inclusive)” 트레이딩 전략으로 작동합니다. 하나의 코드 안에 강력한 시장 기술 분석 도구, 매매 신호(화살표), 알림 기능, 푸시 알림이 통합되어 있습니다. 이 인디케이터를 구매하신 모든 분들께는 다음의 항목이   무료로   제공됩니다: Grabber 유틸리티: 오픈 포지션을 자동으로 관리하는 도구 단계별 영상 매뉴얼: 설치, 설정, 그리고 실제 거래 방법을 안내 맞춤형 세트 파일: 인디케이터를 빠르게 자동 설정하여 최고의 성과를 낼 수 있도록 도와줍니다 다른 전략은 이제 잊어버리세요! Grabber만이 여러분을 새로운 트레이딩의 정점으로 이끌어 줄 수 있습니다. Grabber 전략의 주요 특징: 거래 시간 프레임: M5부터 H4까지 거래 가능한 자산: 어떤 자산이든 사용 가능하지만, 제가 직접 테스트한 종목들을 추천드립니다 (GBPUSD, GBPCAD, GBPCHF, AUDCAD
GOLD Impulse with Alert
Bernhard Schweigert
4.6 (10)
이 지표는 Advanced Currency IMPULSE with ALERT  +   Currency Strength Exotics  의 2가지 제품의 슈퍼 조합입니다. 그것은 모든 시간 프레임에 대해 작동하며 8개의 주요 통화와 하나의 기호에 대한 강약의 충동을 그래픽으로 보여줍니다! 이 표시기는 금, 이국적인 쌍, 상품, 지수 또는 선물과 같은 기호에 대한 통화 강도 가속을 표시하는 데 특화되어 있습니다. 금, 은, 오일, DAX, US30, MXN, TRY, CNH 등의 진정한 통화 강도 가속(충동 또는 속도)을 표시하기 위해 9번째 줄에 모든 기호를 추가할 수 있습니다. 새로운 기본 알고리즘을 기반으로 구축되어 잠재적인 거래를 훨씬 더 쉽게 식별하고 확인할 수 있습니다. 이는 통화의 강세 또는 약세가 가속되는지 여부를 그래픽으로 표시하고 가속 속도를 측정하기 때문입니다. 자동차의 속도계처럼 생각하면 됩니다. 가속화할 때 Forex 시장에서 동일한 일이 분명히 더 빠르
Lux Trend
Mohamed Hassan
5 (3)
After purchase, please contact me to get your trading tips + more information for a great bonus!   Lux Trend is a professional strategy based on using Higher Highs and Lower Highs to identify and draw Trendline Breakouts! Lux Trend  utilizes two Moving Averages to confirm the overall trend direction before scanning the market for high-quality breakout opportunities, ensuring more accurate and reliable trade signals. This is a proven trading system used by real traders worldwide, demonstrating
Max Min Cycle
Vitalyi Belyh
Cyclical indicator for trading and predicting the direction of the market. Shows the cyclical behavior of the price in the form of an oscillator. Gives signals for opening deals when rebounding from the upper and lower boundaries of the oscillator. In the form of a histogram, it shows the smoothed strength of the trend. Will complement any trading strategy, from scalping to intraday. The indicator does not redraw. Suitable for use on all symbols/instruments. Suitable time frames for short-term t
Advanced Supply Demand
Bernhard Schweigert
4.91 (294)
현재 33% 할인! 초보자나 전문 트레이더를 위한 최고의 솔루션! 이 보조지표는 우리가 다수의 독창적 기능과 새로운 공식을 통합한 독특하고 고품질이며 저렴한 거래 도구입니다. 이 업데이트를 통해 이중 시간대를 표시할 수 있습니다. 더 높은 TF를 표시할 수 있을 뿐만 아니라 차트 TF와 더 높은 TF 모두를 표시할 수 있습니다: 중첩 영역 표시. 모든 Supply Demand 트레이더들이 좋아할 것입니다. :) 중요한 정보 공개 Advanced Supply Demand의 잠재력을 극대화하려면 다음을 방문하십시오. https://www.mql5.com/ko/blogs/post/720245   진입 또는 목표의 명확한 트리거 포인트를 정확히 찾아냄으로 해서 거래가 어떻게 개선될지 상상해 보십시오. 새로운 알고리즘을 기반으로 매수자와 매도자 간의 잠재적인 불균형을 훨씬 더 쉽게 분간할 수 있습니다. 왜냐하면 가장 강한 공급영역과 가장 강한 수요 영역과 과거에 어떻게 진행 되었는지를(이전
Volumatic VIDyA MT4
Duc Hoan Nguyen
5 (3)
Special offer : ALL TOOLS , just $35 each! New tools   will be   $30   for the   first week   or the   first 3 purchases !  Trading Tools Channel on MQL5 : Join my MQL5 channel to update the latest news from me Volumatic VIDYA (Variable Index Dynamic Average) 는 트렌드를 추적하고 각 트렌드 단계에서 매수 및 매도 압력을 분석하기 위해 설계된 고급 지표입니다. 가변 지수 동적 평균(Variable Index Dynamic Average)을 핵심 동적 평활화 기술로 활용하여 이 도구는 주요 시장 구조 수준에서 가격 및 거래량 역학에 대한 중요한 통찰력을 제공합니다. MT5 버전 보기:  Volumatic VIDyA MT5 다른 제품 보기:    모든 제품 To use iCustom
Gold Buster M1 System - XAUUSD 쌍의 M1 차트를 위한 전문 거래 시스템입니다. 그러나 시스템이 원래 금 거래 전용으로 개발되었다는 사실에도 불구하고 시스템은 일부 다른 통화 쌍과도 함께 사용할 수 있습니다. 구매 후 XAUUSD 외에 시스템에서 사용할 수 있는 거래 쌍 목록을 제공하여 이 시스템의 사용 가능성을 확장합니다. 시스템의 모든 표시기가 반복되지 않습니다! 이 시스템은 세 가지 지표의 집합입니다. 시장의 강세를 시각적으로 보여주는 추세 표시기, 화살표 표시기 및 거래량 표시기입니다. 구매 후 트렌드 지표를 즉시 다운로드할 수 있습니다. 나머지 두 지표는 전체 시스템의 일부이므로 무료로 제공합니다. 차트에 지표를 로드하는 데 사용할 수 있는 템플릿도 제공합니다. 또한 내 시스템과 거래하고 내 권장 사항을 공유하는 방법을 알려 드리겠습니다. 당신을 기다리고있는 큰 보너스도 있습니다! 구매 후 즉시 저에게 편지를 보내십시오!
Order Blocks ICT Multi TF MT4
Diego Arribas Lopez
5 (2)
[ MT5 Version ]  [ Kill Zones ]  [ SMT Divergences ] How to trade using Order Blocks:  Click here User Interface Performance:  During testing in the strategy tester, the UI may experience lag. Rest assured, this issue is specific to the testing environment and does not affect the indicator's performance in live trading. Elevate your trading strategy with the  Order Blocks ICT Multi TF  indicator, a cutting-edge tool designed to enhance your trading decisions through advanced order block analys
Gold Venamax MT4
Sergei Linskii
2 (1)
Gold Venamax   - 이것은 최고의 주식 기술 지표입니다. 지표 알고리즘은 자산의 가격 변동을 분석하고 변동성과 잠재적 진입 영역을 반영합니다.   표시기 기능: 이것은 편안하고 수익성 있는 거래를 위한 매직과 두 개의 추세 화살표 블록을 갖춘 슈퍼 지표입니다. 블록 전환을 위한 빨간색 버튼이 차트에 표시됩니다. 매직은 표시기 설정에서 설정되므로 서로 다른 블록을 표시하는 두 개의 차트에 표시기를 설치할 수 있습니다. Gold Venamax는 서로 다른 화살표 버퍼(GV 및 SD)를 사용하여 두 개의 차트에 배치할 수 있습니다. 이렇게 하려면 설정에서 다른 Magic을 선택해야 합니다. 예를 들어 하나는 Magic = 999이고 다른 하나는 Magic = 666입니다. 다음으로 차트의 빨간색 버튼으로 화살표 버퍼를 선택할 수 있습니다. 지표 설정의 각 화살표 버퍼(GV 및 SD)에는 편안하고 수익성 있는 거래를 위한 별도의 화살표 필터가 있습니다(UseFiltrGV = t
Volume Break Oscillator는 가격 움직임을 오실레이터 형태로 볼륨 추세와 일치시키는 지표입니다. 저는 볼륨 분석을 제 전략에 통합하고 싶었지만 OBV, Money Flow Index, A/D, Volume Weighted Macd 및 기타 여러 지표와 같은 대부분의 볼륨 지표에 항상 실망했습니다. 그래서 저는 이 지표를 직접 작성했고, 얼마나 유용한지 만족스러워서 시장에 공개하기로 결정했습니다. 주요 기능: 가격이 볼륨 증가(브레이크)로 지원되는 방향으로 움직이는 단계를 강조합니다. 볼륨 증가가 멈추고 시장이 수축되는 단계를 강조합니다. 특히 시간 프레임(<=15분)이 있는 일중 거래에서 가격이나 볼륨이 움직이지 않아 시장이 향후 상승에 대비하는 단계를 강조합니다. 볼륨 증가로 지원되지 않는 다른 전문가 자문가의 거짓 신호를 걸러냅니다. 추세와 범위 단계를 시각화하는 것이 매우 쉽습니다. 입력 매개변수: 계산 설정: 계산 유형: FAST, NORMAL, S
파동 동기화 장치 - 파동 분석의 시각적 표시기. 촛대 움직임 시퀀스를 결합하고 방향성 파동 패턴을 생성하여 시장과 동기화된 움직임을 생성합니다. 각 웨이브의 시작은 신호 화살표로 시작하며, 알림도 있습니다. 이 표시기는 과거 기록에 있는 화살표를 다시 그리거나 이동하지 않습니다. 캔들 마감 시점에 신호 화살표가 나타납니다. 모든 거래 수단 및 시간대에 맞게 조정 가능합니다. 사용 및 구성이 쉽고, 선택한 매개변수와 함께 사용할 시간 프레임 선택 및 MA 라인 계산 방법의 2가지 입력 매개변수만 포함합니다. 권장 매개변수는 1~2주기만큼 변경될 수 있습니다. 거래 자산을 매수하기 위한 빨간색 화살표 방향입니다. 거래 자산을 판매할 때의 파란색 화살표 방향입니다. -----------------------------------------------------------------
PZ Order Block
PZ TRADING SLU
간단하면서도 효과적인 포지션 트레이딩 전략인 Order Blocks의 개인적인 구현. 가격 범위가 브레이크 아웃의 반대 방향으로 위반되지 않은 경우 거래자는 시장에 진입하거나 마지막 주문 블록 방향으로 거래를 찾아야 합니다. 명확성을 위해 열린 블록은 그려지지 않습니다. [ 설치 가이드 | 업데이트 가이드 | 문제 해결 | 자주하는 질문 | 모든 제품 ] 강세 오픈 블록은 신시장 저점 이후의 첫 번째 강세 막대입니다. 약세 오픈 블록은 신시장 고점 이후 첫 번째 약세 막대입니다. 오픈 블록이 깨졌을 때 시그널이 나타나 오더 블록이 됨 오더블록이 반대편으로 깨지면 반전블록이 된다 표시기는 모든 종류의 경고를 구현합니다. 다시 칠하거나 다시 칠하지 않습니다. 입력 매개변수 기간: 새로운 고가 또는 저가를 생성하는 데 필요한 막대의 양입니다. 값이 작을수록 더 많은 신호가 발생합니다. 최소 ATR 필터: ATR의 승수로 표시되는 주문 블록 막대의 최소 본체 크기입니다. 최대 ATR 필
Stratos Pali
Michela Russo
5 (2)
Stratos Pali Indicator   is a revolutionary tool designed to enhance your trading strategy by accurately identifying market trends. This sophisticated indicator uses a unique algorithm to generate a complete histogram, which records when the trend is Long or Short. When a trend reversal occurs, an arrow appears, indicating the new direction of the trend. Important Information Revealed Leave a review and contact me via mql5 message to receive My Top 5 set files for Stratos Pali at no cost! Dow
제작자의 제품 더 보기
MACD Message
Dmitriy Moshnin
MACD Message is an analogue of the MACD Alert for the MetaTrader 4 terminal with more advanced functionality: Parameters 'Averaging Method' and 'Price Type' ( MA method and Apply to ) are displayed in the settings window. It gives an advantage of monitoring convergence/divergence of all types of Moving Average (Simple Averaging, Exponential, Smoothed and Linear Weighted) and by any price (Closing Price, Opening Price, the Maximum Price for the Period, the Minimum Price for the Period, Median Pri
Symbol Profit
Dmitriy Moshnin
This is an indicator for MetaTrader 4. It is small, nice and compactly sized for a chart window, while conveniently displaying all the necessary information: open position volumes and total profit on them. Font size, corner and color can be set according to your preferences. By default, a positive position is displayed in green and a negative one is shown in red. Happy Trading. Indicator Parameters Symbol - name of the current symbol in the window: Show – display, Hide – do not display; Profit
Unlike the standard indicator, Stochastic Oscillator Message ( please see the description and video ) features an alert system that informs you of changes in the market situation using twenty signals: the Main line and Signal line cross in the area above/below the levels of extremum (below 20%; above 80%); the Main line and Signal line cross within the range of 20% to 80%; the Main line crosses the levels of extremum; the Main line crosses the 50-level; divergence on the last bar. Parameters of
RSI TrendLine Divergency Message is an indicator for the MetaTrader 4 trading platform. Unlike the original indicator, this three in one version has a system of alerts that inform on market situation changes. It consists of the following signals: when the Main line crosses the levels of extreme zones and 50% level; when the Main line crosses the Trend line in the indicator window; divergence on the last bar. Parameters of levels of extremum, 50-level and divergence are adjustable. Parameters La
MACD Color
Dmitriy Moshnin
MACD Color ( please see the description and video ) is an indicator for the MetaTrader 4 trading platform that is similar to MACD Message . Unlike the standard indicator, it changes the bar edge color when there is a change in the market situation - a change in the trend strength or a change in the inclination of the main EMA which represents the zero level - it changes the color of the zero level (this parameter can be disabled in the settings). Take a look at how the indicator can be used in a
The Four Moving Averages indicator ( please see the description and video ), a version of Four Moving Averages Message , concurrently displays four Moving Averages with default settings in the main chart window: Green and Red ones represent a short-term trend, Red and Blue ones - mid-term trend, while Blue and Yellow ones - long-term trend. You can change the moving average settings and colors. However, these parameters have been configured so that to allow trading on all time frames. Take a loo
The Four Moving Averages Message indicator ( please see the description and video ), a version of Four Moving Averages , concurrently displays four Moving Averages with default settings in the main chart window: Green and Red ones represent a short-term trend, Red and Blue ones - mid-term trend, while Blue and Yellow ones - long-term trend. You can change the moving average settings and colors. However, these parameters have been configured so that to allow trading on all time frames. The built-
The Display Stochastic System indicator for the MetaTrader 4 trading platform ( see description (in Russian) ) is compactly sized for a chart window, while displaying Stochastic indicator results for all time frames in a single window. Parameters for each time frame are set separately. Font size, corner and color can be set according to your preferences. By default, a buy signal is green and a sell signal is red. The overbought market is dark red (prepare to sell -> wait for the red color). The
The Display ADX System indicator for the MetaTrader 4 trading platform ( see description (in Russian) ) is compactly sized for a chart window, while displaying ADX indicator results for all time frames in a single window. Parameters for each time frame are set separately. Font size, corner and color can be set according to your preferences. By default, colors of time frame names are as follows: no trend - white, bullish trend - green, bearish trend - red. If the ADX is rising on the last three b
The Level Moving Averages indicator ( see the description and video ) does not draw the Moving Average line in the chart window but marks the Moving Average level on all time frames in accordance with the specified parameters. The level move frequency corresponds to the TimeFrame parameter value specified. The advantage of this indicator lies in the fact that it offers the possibility of monitoring the interaction between the price and the MA of a higher time frame on a lower one (e.g., the MA l
The Level S Moving Averages indicator ( see the description and video ) does not draw the Moving Average line in the chart window but marks multiple levels (such as close, highs and lows of any bar on the time frames from M1 to D1, W1, MN - strong levels) of the Moving Average on all time frames in accordance with the specified parameters. The level move frequency corresponds to the TimeFrame parameter value specified. The advantage of this indicator lies in the fact that it offers the possibili
The Level Moving Averages Message indicator ( see the description and video ) does not draw the Moving Average line in the chart window but marks the Moving Average level on all time frames in accordance with the specified parameters. The level move frequency corresponds to the TimeFrame parameter value specified. The advantage of this indicator lies in the fact that it offers the possibility of monitoring the interaction between the price and the MA of a higher time frame on a lower one (e.g.,
Lot Calculation
Dmitriy Moshnin
Lot size calculator ( see the description ) calculates the lot size based on percent of free margin, as well as profit, loss and P/L ratio for a planned position by moving horizontal levels in the chart window. More advanced analog of Lot Calculation is Profit Factor indicator.
The Display Trend Moving Averages System indicator ( see its description ) shows information about direction of trends H1, H4, D1, W1, MN on all timeframes in one window, so that you can track changes in the average price before the oldest bar closes. A trend unit is a Moving Average with period "1" of the close of the oldest bar (H1, H4, D1,  W1, MN). The indicator recalculates values of older bars for internal bars and draws a trend slope in the chart window as colored names of time intervals:
ADX Message
Dmitriy Moshnin
Отличается от стандартного индикатора дополнительным набором настроек и встроенной системой оповещений. Индикатор может подавать сигналы в виде алерта ( Alert ), комментария в левый верхний угол главного окна графика ( Comment ), уведомления на мобильную версию терминала ( Mobile МТ4 ), электронный почтовый ящик ( Gmail ).  Параметры индикатора Period — период расчета индикатора; Method — выбор метода усреднения: простой, экспоненциальный, сглаженный, линейно-взвешенный; Apply to — выбор использ
The Two Moving Averages indicator concurrently displays two Moving Averages with default settings in the main chart window: Green and Red lines that represent a short-term trend. You can change the moving average settings and colors. However, these parameters have been configured so that to allow trading on all timeframes. Take a look at how the Moving Averages lines can be used in a profitable multi-currency Trading Strategy on all time frames, that is also suitable for trading in your mobile t
The Three Moving Averages indicator concurrently displays three Moving Averages with default settings in the main chart window: Green and Red lines represent a short-term trend, Red and Blue lines - long-term trend. You can change the moving average settings and colors. However, these parameters have been configured so that to allow trading on all timeframes. Take a look at how the Moving Averages lines can be used in a profitable multi-currency Trading Strategy on all time frames, that is also
The alerting system for the MetaTrader 4 platform 'Two Moving Average Message' consists of two moving average lines with individual parameters. The indicator can generate alerts ( AlertMessage )б display a comment in the upper left corner of the main chart window ( CommentMessage ), send notifications to the mobile terminal version ( MobileMessage ), send emails ( GmailMessage ) and play two different sounds at the intersection of lines upwards or downwards. Parameters Language – choose language
Three Moving Averages Message is a notification system for the MetaTrader 4 platform. It consists of three moving averages which have their own adjustable parameters. Slow and Long lines determine long-term trend, while Fast and Slow lines - short-term. If the lines Fast and Slow are crossed during a trend, the indicator displays a recommendation for buying (selling). If the lines Slow and Long are crossed, the indicator notifies of the start of a up/down trend. Concerning other types of crossin
Profit Factor
Dmitriy Moshnin
The Profit Factor indicator calculates one of the three parameters: 1 - market entry level (in the 'Calculate the' parameter - Market Open Trade), 2 - the Stop Loss level (Calculate the - Market Price Loss), 3 - the Take Profit level (Calculate the - Market Price Profit) - with a desired profit/loss ratio (Profit Factor), as well as the lot size (trade volume) according to the value of the risk percentage of available funds specified in the settings (a simpler analog is the Lot Calculation indic
MACD Converter
Dmitriy Moshnin
MACD Converter is an analogue of the MACD Message with more advanced functionality: It has two signal lines: Signal Line 1 and Line 2, bar outlines are colored according to Line 1, it also triggers the trend notifications. MACD Converter converts the parameters of Fast MA, Slow MA and Signal Line 1 and Line 2 lines from the interval specified in the settings (Convert Time Frame) to smaller timeframes. This allows receiving a signal for making a decision within the specified (Convert Time Frame)
LTT Range System
Dmitriy Moshnin
Индикатор Форекс LTT Range System показывает на графике средние диапазоны движения рыночной цены за периоды M 15, H 1, H 4, D 1, W 1, MN 1.  Верхняя и нижняя границы диапазонов рассчитываются от цены открытия бара. Пивот – середина между ценой открытия бара и границей диапазона: если рыночная цена находится выше цены открытия бара – метка пивота располагается между ценой открытия бара и верхней меткой диапазона, если рыночная цена находится ниже цены открытия бара – метка пивота располагается ме
Parabolic Converter is and analogue of the Parabolic indicator for МТ4 which can automatically recalculate parameters of Time Frame specified in settings for lower time periods. It has a Notification System which triggers when the price movement direction is changed. For example: if we set Time Frame 1 Hour to H1 and M30, M15, M5 and M1 contained therein, we can see the indicator's readings corresponding to H1 (fig.). At that, if we add one more Parabolic on the same chart (of several charts) wi
RSI Converter
Dmitriy Moshnin
Relative Strength Index with advanced functionality recalculates (converts) the averaging period in accordance with the value of parameter Time Frame for lower chart time intervals (Multi-TimeFrame (MTF)). Unlike the standard indicator, RSI converter includes an alert system that notifies about changes in market situation, it consists of the following signals: Main line crosses levels of extreme zones (30%, 70%) and the level of 50%; The main line crosses one or two trendlines in the indicator w
Commodity Channel Index Message is an indicator for the MetaTrader 4 trading platform. Unlike the original indicator, this three in one version has a system of alerts that inform on market situation changes. It consists of the following signals: when the Main line crosses the levels of extreme zones and 50% level; when the Main line crosses the Trend line in the indicator window; Divergence on the last bar. Values of the middle and extreme levels and divergence zones are customizable. Parameter
MACD TrendMA
Dmitriy Moshnin
The MACD TrendMA indicator is a trading system developed on the basis of the MACD indicator popular among many traders, and which is based on measuring the inclination (trend) angle of the moving averages, while measuring the ratio (convergence/divergence) between them. The signal for entering/exiting the market is the frame of the bars colors and color of the MACD TrendMA histogram according to the trend, which can be customized in the properties window of the indicator - in case the inclinatio
MACD Temp
Dmitriy Moshnin
MACD Temp is a system of two oscillators, which allows to track the price changes of the Fast and Slow periods in case of their convergence/divergence. The bar border is colored in accordance with the MACD trend, while the color of the histogram changes when the values of the Momentum indicators cross the level of 100, for respective periods: Fast Moving Average (Fast Momentum), Slow Moving Average (Slow Momentum), selectively or for both values (the mode is to be chosen in the indicator propert
MACD CloseBars
Dmitriy Moshnin
The MACD CloseBars indicator is a trading system based on the MACD indicator popular among many traders, which is built on the principle of bars closing above the moving averages selected in the indicator settings. The signal for entering/exiting the market is the frame of the bars colors according to the trend: in case the bars in the main window of the chart are closed above/below the Fast Moving Average, Slow Moving Average individually or both together. Indicator Parameters Fast Moving Aver
MACD ColorBars
Dmitriy Moshnin
MACD ColorBars paints bar frames according to a trend, as well as changes the histogram color when MACD bars are rising or falling (if Color Bars is enabled in the inputs window). The growth of bars indicates a divergence between the fast and slow moving averages, while the decrease indicates their convergence. Parameters Fast Moving Average - period of the fast moving average; Slow Moving Average - period of the slow moving average; MA method - moving average smoothing method (simple, exponent
MACD BBands
Dmitriy Moshnin
MACD BBands is a trading system based on MACD and Bollinger Bands placed in a single window. The indicator shows moving average slope angle (trend) change, compares their ratio (convergence/divergence) and allows sorting out signals using Bollinger Bands. The indicators are calibrated in such a way that the middle Bollinger Bands line is the zero level of the MACD indicator. Parameters Period - Bollinger Bands period; Deviations - number of standard deviations; Shift - shift relative to price;
필터:
zacante
631
zacante 2019.06.15 04:54 
 

사용자가 평가에 대한 코멘트를 남기지 않았습니다

John Adams
47
John Adams 2019.03.13 05:03 
 

사용자가 평가에 대한 코멘트를 남기지 않았습니다

sunnychow
9051
sunnychow 2018.12.16 05:17 
 

사용자가 평가에 대한 코멘트를 남기지 않았습니다

RodrigoMariani
86
RodrigoMariani 2018.08.25 02:40 
 

사용자가 평가에 대한 코멘트를 남기지 않았습니다

Tim Eubanks
5763
Tim Eubanks 2018.03.21 03:03 
 

사용자가 평가에 대한 코멘트를 남기지 않았습니다

Ali irwan
5137
Ali irwan 2017.08.04 11:31 
 

사용자가 평가에 대한 코멘트를 남기지 않았습니다

Gennadiy Voltornist
11909
Gennadiy Voltornist 2017.06.02 13:59 
 

사용자가 평가에 대한 코멘트를 남기지 않았습니다

리뷰 답변
버전 1.1 2021.11.17
Продукт скомпилирован в последней версии платформы