YFX Zones
- 지표
- Richard Yancy
- 버전: 6.0
- 업데이트됨: 11 6월 2020
- 활성화: 5
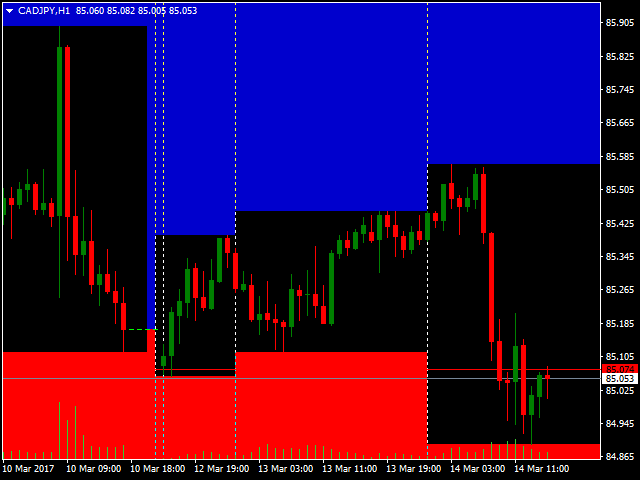
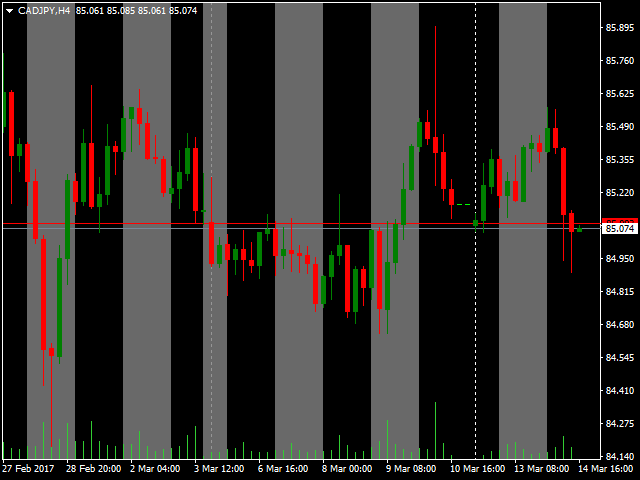
The Zones indicator provides a visual display of the boundaries around a price action. There are two types of zones included in the indicator:
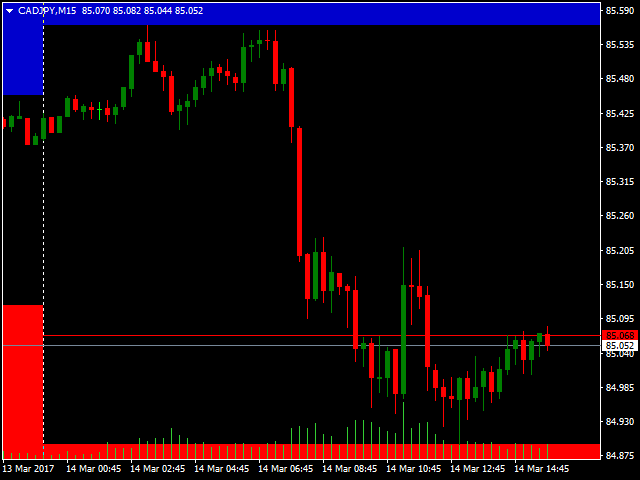
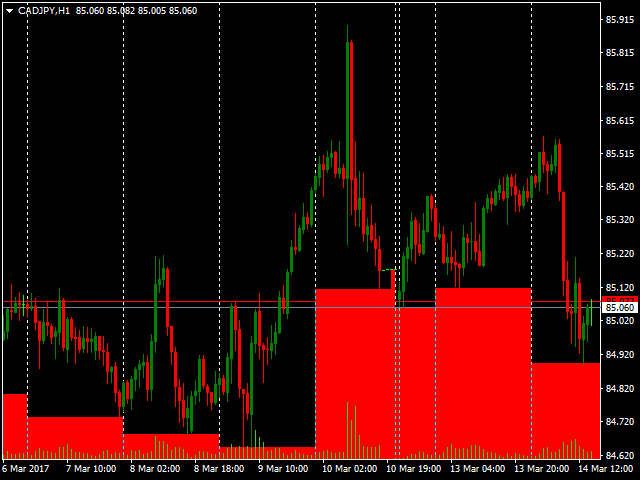
- High-Low price zones
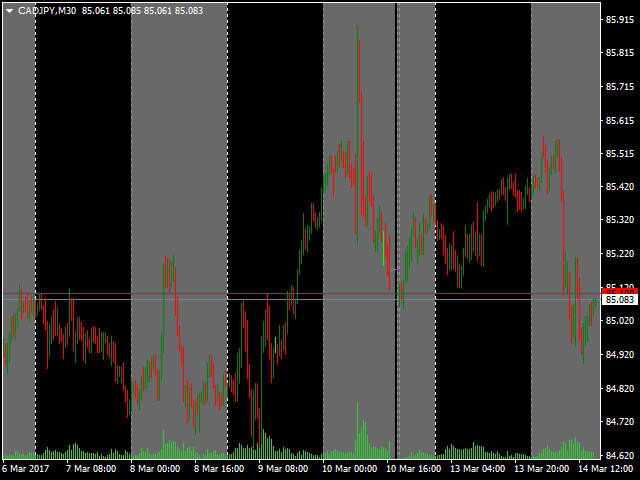
- Time period zones (delineations)
High-Low price zones display the boundaries of the High and Low price points. Typically, these zones are displayed for the High and Low price of the day.
Time period zones display boundaries around time period intervals.
PARAMETERS
Yancy indicator
- IndicatorName – indicator name displayed in the chart data window.
- IndicatorOffset – change the default and forced calculations to be made based on previous bars.
Zones
- UseZones – other YFX indicators can use data in the Zones indicator. By default, the integration is disabled.
- ZonePeriodMinutes – number of minutes to use when defining zones.
- DelineationPeriodMinutes – number of minutes to use when defining delineations.
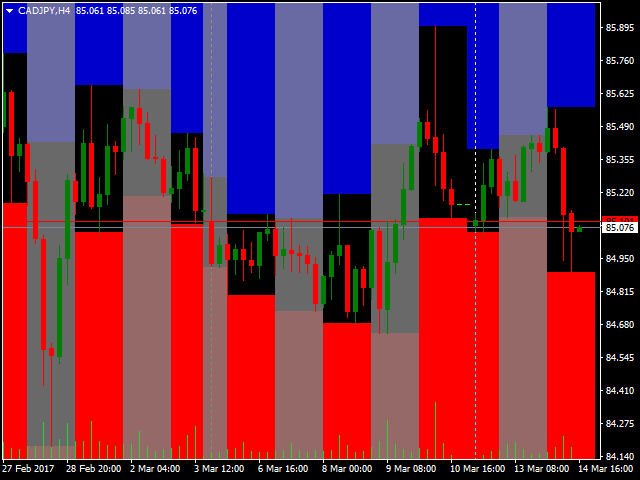
Display
- DisplayUpperZone – configure display of the upper zones.
- DisplayLowerZone – configure display of the lower zones.
- DisplayDelineation – configure display of the delineations.
Colors
- ColorUpperZone – display upper zones in this color.
- ColorLowerZone – display lower zones in this color.
- ColorDelineation – display delineations in this color.
Messages
- DoShowComments – display messages in the comment section on the chart.
- DoShowAlerts – display messages in the alert pop-up window in the terminal.
- DoMailMessages – email messages to users.
- DoPushNotifications – send push messages to a user’s mobile phone application.
- DoPrintJournal – send messages to the terminal’s journal.
- DoPrintFile – send messages to an external file on disk in the Files folder.
- DefaultMessageFileName – if the print to file option is enabled, then message notifications are written to a file with this name in the Files folder.
- DoSoundMessage – play sounds when a notification occurs.
- DefaultSoundFileName – if the sound message option is enabled, then this sound file is played when notifications are generated.
Quiet time
- DoQuietTime – enable/disable quiet time.
- QuietTimeStart – start time of the period.
- QuietTimeEnd – end time of the period.
Message Info
- EnableInfo – allow statistics to be maintained internally. If enabled, information would be conveyed to a user at indicator start/stop.
Debugging
- EnableDebug – enable debugging.
- DebugLevel – amount of debugging information.
- UseDatedLogs – code the debugging file name with the date.