• 미리보기
  • 리뷰 (13)
  • 코멘트 (49)
  • 새 소식

Indicator Combine Merge by RunwiseFX

4.92

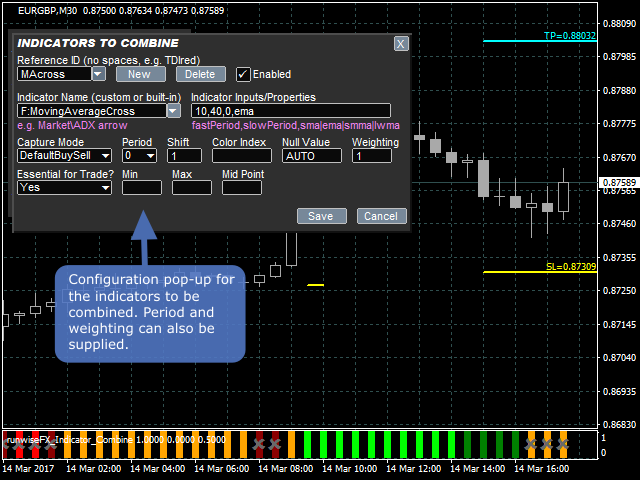
Allows multiple indicators to be combined into a single indicator, both visually and in terms of an alert. Indicators can include standard indicators, e.g. RSI, CCI, etc., and also Custom Indicators, even those purchased through Market, or where just have the ex4 file. An early alert is provided, say when 4 out 5 indicators have lined up, and a confirmed alert when all are in agreement.

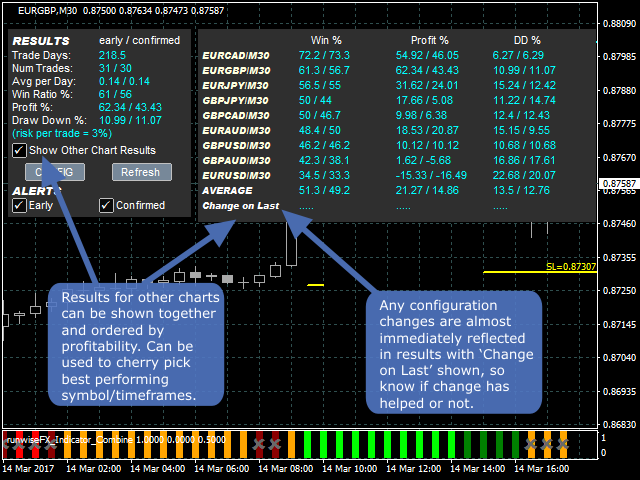
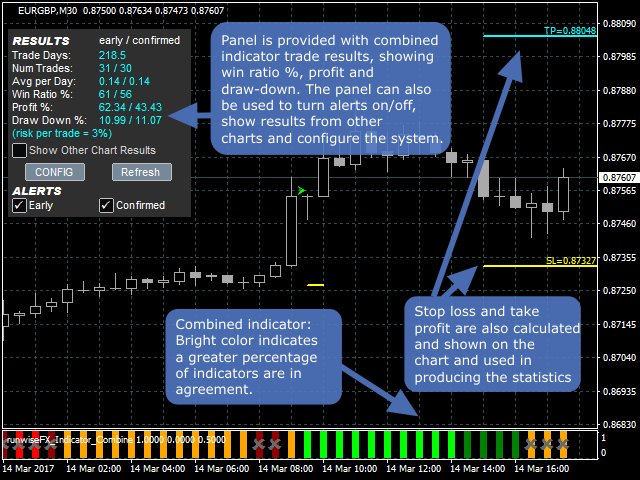
A‌lso features a statistics panel reporting the success of the combined indicator by examining the current chart. The win rate, profit and draw down are calculated, based on a selected stop loss and take profit/exit regime. Results from other charts can also be shown together and ordered with the best performing symbols shown first - allowing cherry picking of best symbols/timeframes.

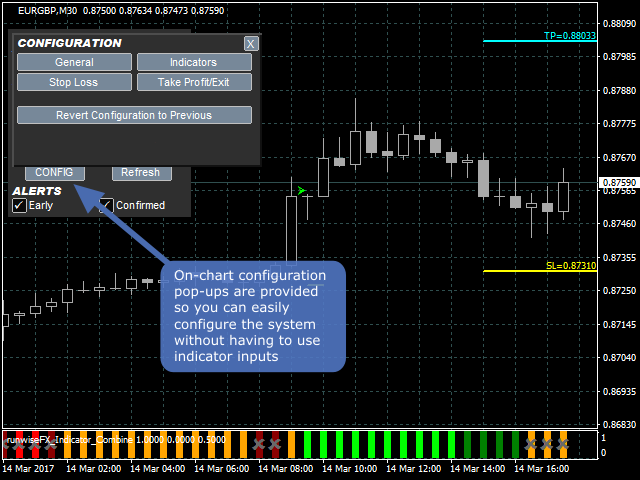
The product is easily configured using pop-up forms – see video. The product comes configured with example standard indicators.

Fully compatible with our range of EA panels, allowing easy conversion into an EA that can trade automatically.

‌‌Please see Comments tab (first entry) for link to the manual.


Features

  • Combines multiple indicators both visually and in terms of an alert
  • Works with standard indicators and Custom Indicators, even if just have ex4 file or those purchased from market
  • Indicators are examined on candle close, by default, so no repainting
  • Choice of two configurable alert levels - early (say when 75% of indicators lined-up) and confirmed (all lined-up)
  • Shows trade result statistics of combined indicators with win ratio, profit and draw down - calculated in real-time by examining the current chart
  • Option to show table of statistics from other charts/symbols that the indicator is loaded on to - ordered by profit
  • Results show outcome of both early and confirmed alert, so can see which is performing best
  • Option to automatically select early or confirmed alert, depending on which has the higher profit, or win ratio
  • Realistic calculation of statistics by taking into consideration a selected stop loss, take profit/exit regime and spread
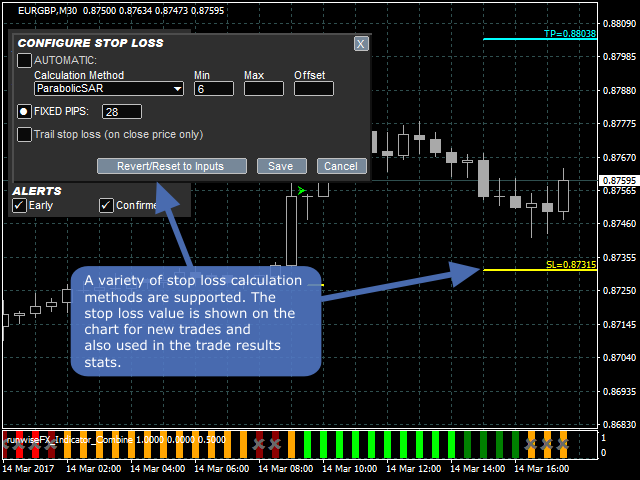
  • Stop loss can be specified either as fixed pips or using a variety of automatic calculation methods, including from a custom indicator
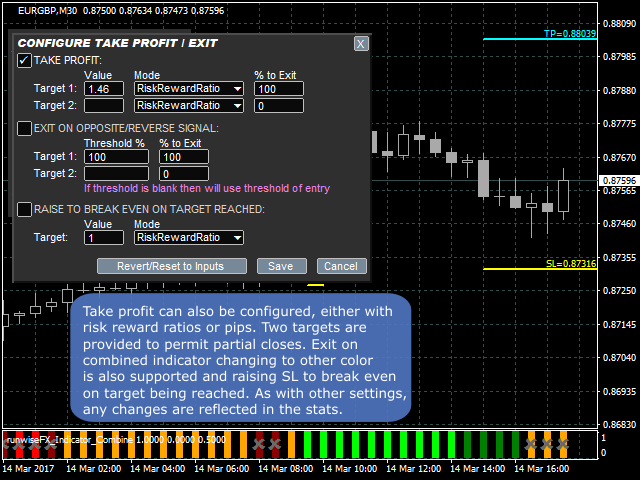
  • Statistics can also include effect of trading hours, partial take profit/exit, trailing stop loss and auto break even when target reached
  • Optional Binary Options mode where statistics are worked out with expiry rather than SL/TP
  • Take profit and break even targets can be specified as either risk reward ratios or in pips
  • Pips can be optionally specified as a percentage of the Average Daily True Range, allowing it to automatically scale depending on the symbol
  • Shows simulated trades on the chart with open price, stop loss used, close price and profit
  • Automatic recalculation of statistics upon configuration changes, showing the effect on win ratio, profit and draw-down
  • One-click restore of previous configuration if change was not beneficial
  • Configured stop loss, break even and take profit prices are shown on chart for use with new trades
  • Easy to use configuration pop-ups
  • Choice of display formats, i.e. bar or histogram
  • Choice of alert methods, e.g. pop-up, email or mobile notification
  • Easy integration with our EAs for automated trading


‌Indicator Inputs

Use the CONFIG button to configure the system. Inputs are provided as an alternative and are fully described in the manual - see Comments tab for link to manual. Key inputs are explained below:

  • Main_alertConfirmedPercentage - Percentage of indicators that need to have lined-up for confirmed alert to happen
  • Main_alertEarlyPercentage - Percentage of indicators that need to have lined-up for early alert to happen
  • Main_alertResetLevel - How much indicator needs to go to other direction of alert reset to happen
  • Main_binaryOptionModeBars - If > 0 then number of bars before trade closes to simulate Binary Options


Using the Strategy Tester / Demo Version

Make sure the test is running at least at market speed for the buttons on the panel to work. Alerts appear in the Journal tab.


Converting Into an EA

Can easily be converted into an EA that can trade automatically with our Ultimate Trade Manager product.

리뷰 13
joseanrod
95
joseanrod 2023.04.20 15:22 
 

To keep it short, a SENSATIONAL tool for backtesting, indicating when to buy/sell and exit based on your system. If you have a profitable and fully mechanical system based on indicators then this is a must have tool. It facilitates your backtesting so much and provides you statistics based on the chosen days, which boosts your confidence and saves you precious time. Very user friendly, the videos on Youtube are very useful, comprehensive manual to reference. Not to say about the support and customer service is OUTSTANDING. Any legitimate doubt that I’ve had, I received a prompt and comprehensive answer to my Qs. LASTLY, before you buy, make sure that this is the tool you are looking for. This is an indicator and even though you can build your mechanical strategy using this tool, you cannot automate it (run it as an EA) since it’s an indicator. Make sure you take a look to his products and ask support if they have them on their website since through them, you don’t have the hardware activation limit. If you are confused, just contact the support email, describe what you’re looking for and I hope you’ll end up satisfied as myself.

Nicola Pileri
313
Nicola Pileri 2020.04.01 19:21 
 

Mi stupisce che ci siano così poche valutazioni, tutti i commercianti dovrebbero avere questo sistema che fa risparmiare enorme tempo.

Fantastico sistema.

Trader mql5
1265
Trader mql5 2019.04.25 04:01 
 

Where do I start...

Most importantly, support is superb and this is a unique, one-of-a-kind "app". I call it an app as it assists you in guiding which indicators have some hope and which are just rubbish by quickly analyzing the buffers of the indicators.

I certainly have a love-hate relationship with it, as it exposes the indicators which I thought are profitable in the long run, but fail miserably. I could have bet my life on some indicators, but this app clearly trashed most of them. I am starting to realize that indicators are not my way forward in trading...

I literally tested 3000+ indicators over the last couple months. Most can be trashed immediately within a few seconds by inserting the buffers. Others seem extremely profitable, but then test them through Strategy Tester, just to realize they either repaint or back-paint, even subtly by changing color, arrow or angle within one candle. When this info is then fed to the app by shifting the confirmation to 2 bars i.l.o 1 bar - crash, boom, bang, kaputt. It will need some reading and studying the manual in DETAIL to be able to identify which capture modes to use, but you will get there, believe me I am not overly bright and my mind melts when I have to program anything even remotely simple, but the logic of this piece of software is fantastic, once you get the hang of it - no programming required, you just pick the appropriate capture options and set your TP, SL levels. Also appropriate time frame consideration is very important with different TP/SL for each TF.

Remember there are many options for Stop Loss and Take Profit. Some indys like quick TP without waiting for opposite signals, others need opposite signals to be profitable. Scaling in on some are also good instead of a blind TP level. Combinations of both scaling in and exit/reverse on opposite signals are also possible. Stop Loss levels for each pair is also sensitive due to the pair's volatility, play around.

If you are an indicator addict like me, it will save you thousands. I spend more on indicators than on my trading balance in the hope to find that one gem - AND THIS IS THAT VERY GEM. If you insert this indicator in strategy tester, then demo a market indicator within it without buying it, you can very quickly make up your mind. Test the top 20 indicators in demo here on MQL5, you will be shocked. Bear in mind, multi time frame indicators will not work properly in Strategy Tester, with or without Indicator Merge. Refer to the sellers of these indys and they may have a free "lite" version or limited demo version for you to test.

Just a final tip: Even if you found a indy or a combination of Indicators that look good, even after testing them in Strategy Tester and you found them not re- or backpaint - Try them yet again in Strategy Tester together with Indicator Merge to give you current stats. Many, many indicators appear not to repaint, but small changes are sometimes not noticed unless they run bar by bar.

I am a rehabilitated compulsive gambler, this software is helping me turn into a rehabilitated compulsive indicator user at a price that is low for its effectiveness. I have currently only a handful of indys (most of them are free!) which may be useful as confirmation, still optimizing them to make a final decision.

The grey matter with vast voids between our ears seems to be the greatest expert advisor of all.

Additional edit: Where this app shines with Indicators is what Strategy Tester does for Expert Advisors. With Strategy Tester you can optimise the parameters of your EA to review which settings are the most profitable. This is not possible with Indicators as they do not have actual trade signals for Strategy Tester to invoke trade stats. With Indicator Combine you can enter the parameter settings of your indicator and see what impact it has on the profit/loss e.g. calc lookback parameter default of an indicator is 13, but what happens if you set it at 9 or 5 or 15? These stats are updated instantly without running it through Strategy Tester. Just remember if it does re-/backpaint it would be wise to run (no pun intended) again through Strategy Tester with Indicator Merge running concurrently.

I actually now test EVERY indicator through Strategy Tester with IC, it is mind blowing how many programmers manipulate the signals to show great signals in the past, just to realise when running them live, the signals are not even close to what they indicated in history. There are very few exceptions..

추천 제품
Alpha Trend sign has been a very popular trading tool in our company for a long time. It can verify our trading system and clearly indicate trading signals, and the signals will not drift. Main functions: Based on the market display of active areas, indicators can be used to intuitively determine whether the current market trend belongs to a trend market or a volatile market. And enter the market according to the indicator arrows, with green arrows indicating buy and red arrows indicating
Infinity Trend Pro
Yaroslav Varankin
1 (1)
This is a trend indicator without redrawing Developed instead of the binary options strategy (by the color of the Martingale candlestick) Also works well in forex trading When to open trades (binary options) A signal will appear in the place with a candle signaling the current candle It is recommended to open a deal for one candle of the current timeframe M1 and M5 When a blue dot appears, open a deal up When a red dot appears, open a trade down. How to open trades on Forex. When a signal is rec
Chart Patterns Detect 15 patterns (Ascending Triangle, Descending Triangle, Rising Wedge, Falling Wedge, Bullish Flag, Bearish Flag, Bullish Rectangle, Bearish Rectangle Symmetrical triangle, Head and Shoulders, Inverted Head and Shoulders, Triple top, Triple Bottom, Double Top, Double Bottom) Use historical data to calculate the probability of each pattern to succeed (possibility to filter notification according to the chance of success) gives graphic indication about the invalidation level and
Owl smart levels
Sergey Ermolov
4.34 (35)
MT5 버전  |   FAQ Owl Smart Levels Indicator 는   Bill Williams 의 고급 프랙탈, 시장의 올바른 파동 구조를 구축하는 Valable ZigZag, 정확한 진입 수준을 표시하는 피보나치 수준과 같은 인기 있는 시장 분석 도구를 포함하는 하나의 지표 내에서 완전한 거래 시스템입니다. 시장과 이익을 취하는 장소로. 전략에 대한 자세한 설명 표시기 작업에 대한 지침 고문-거래 올빼미 도우미의 조수 개인 사용자 채팅 ->구입 후 나에게 쓰기,나는 개인 채팅에 당신을 추가하고 거기에 모든 보너스를 다운로드 할 수 있습니다 힘은 단순함에 있습니다! Owl Smart Levels   거래 시스템은 사용하기 매우 쉽기 때문에 전문가와 이제 막 시장을 연구하고 스스로 거래 전략을 선택하기 시작한 사람들 모두에게 적합합니다. 전략 및 지표에는 눈에 보이지 않는 비밀 공식 및 계산 방법이 없으며 모든 전략 지표는 공개되어 있습니다. Owl Smart Lev
Insider Scalper Binary This tool is designed to trade binary options. for short temporary spends. to make a deal is worth the moment of receiving the signal and only 1 candle if it is m1 then only for a minute and so in accordance with the timeframe. for better results, you need to select well-volatile charts.... recommended currency pairs eur | usd, usd | jpy .... the indicator is already configured, you just have to add it to the chart and trade .... The indicator signals the next can
Trendiness Index
Libertas LLC
5 (3)
"The trend is your friend" is one of the best known sayings in investing, because capturing large trendy price movements can be extremely profitable. However, trading with the trend is often easier said than done, because many indicators are based on price reversals not trends. These aren't very effective at identifying trendy periods, or predicting whether trends will continue. We developed the Trendiness Index to help address this problem by indicating the strength and direction of price trend
Line Magnit
Aleksey Trenin
The LineMagnit Indicator for MT4 is a highly precise tool that builds support and resistance levels which magnetically attract prices. This feature allows traders to easily determine the most probable entry and exit points in the market, as well as identify the market's directional forces, as levels are based on capital inflows into the instrument. Equipped with an intuitively understandable graphical interface, the LineMagnit Indicator enables users to quickly locate and analyze support and res
Indicador Taurus All4
Fabio Oliveira Magalhaes
Taurus All4 Taurus All4 is a high-performance indicator, it will tell you the strength of the trend, and you will be able to observe the strength of the candle. Our indicator has more than 4 trend confirmations. It is very simple and easy to use. Confirmation Modes Candle Trend Confirmations: When the candle switches to light green the trend is high. When the candle switches to light red the trend is reverting down. When the candle changes to dark red the trend is low. Trendline Trend Conf
PipFinite Trend PRO
Karlo Wilson Vendiola
4.89 (2360)
Breakthrough Solution For Trend Trading And Filtering With All Important Features Built Inside One Tool! Trend PRO's smart algorithm detects the trend, filters out market noise and gives entry signals with exit levels. The new features with enhanced rules for statistical calculation improved the overall performance of this indicator. Important Information Revealed Maximize the potential of Trend Pro, please visit www.mql5.com/en/blogs/post/713938 The Powerful Expert Advisor Version Automa
Alpha Trend
Evgeny Belyaev
3.33 (3)
Alpha Trend is a trend indicator for the MetaTrader 4 platform; it has been developed by a group of professional traders. The Alpha Trend indicator finds the most probable tendency reversal points, which allows making trades at the very beginning of a trend. This indicator features notifications, which are generated whenever a new signal appears (alert, email, push-notification). This allows you to open a position in a timely manner. Alpha Trend does not redraw, which makes it possible to evalua
Fourteen plus nine TD Sequential
MOHAMMED IMAD HUSSEIN BASSEE
Fourteen plus nine What is it for? Applying Tom DeMark’s TD Sequential serves the purpose of identifying a price point where an uptrend or a downtrend exhausts itself and reverses. . What are the main components of TD Sequential? TD Sequential has two parts – TD Setup and TD Countdown. The first phase of TD Sequential starts with a TD Setup and is completed with a 9 count. When the 9 count is completed, it is at that point, a price pause, price pullback, or reversal is likely. It is also at tha
Mega Indicator MT4
Szymon Palczynski
Price reach indicator. It also serves as the perfect term for supports and resistance. I use it in two experts. The basic tool for professional trading. The indicator analyzes the last 500 bar and uses this to determine the levels ( but it doesn't predict the future ) . Personally, I use it on TF H1.  It is very simple. Four lines on chart and that's all. Only two input parameters.  Thousands of indicators. Why this? Is good ? No! Is very good. Please test the indicator prior to purchasing.
Smart Reversal Signal
Evgeny Belyaev
3 (2)
Smart Reversal Signal  is a professional indicator for the MetaTrader 4 platform; it has been developed by a group of professional traders. This indicator is designed for Forex and binary options trading. By purchasing this indicator, you will receive: Excellent indicator signals. Free product support. Regular updates. Various notification options: alert, push, emails. You can use it on any financial instrument (Forex, CFD, options) and timeframe. Indicator Parameters Perod - indicator calcula
Black series MT4
Dmitriy Kashevich
1 (1)
Black series MT4 - The indicator is designed for trading on binary options with Timeframe M1-M5-M15 Multicurrency (Works on cryptocurrency and currency pairs) The signal appears when the candle opens Up to 90% correct signals There is no signal redrawing at all Can be used with other indicators. Good for scalping! In Settings there is: -Indicator working methods -I Allert Arrow color Red signal down Blue signal up Also watch the video how the indicator works and signals
WanaScalper MT4
Isaac Wanasolo
1 (1)
A scalping indicator based on mathematical patterns, which on average gives signals with relatively small SL, and also occasionally helps to catch big moves in the markets (more information in the video) This indicator has three main types of notifications: The first type warns of a possible/upcoming signal on the next bar The second type indicates the presence of a ready signal to enter the market/open a position The third type is for SL and TP levels - you will be notified every time price r
Next level of trend trading here. Possibility 75%, the indicator analyzes the current market to determine short (small dot), middle (circle with a dot inside) and long (cross with a circle and a dot inside) trends.  Wingdings characters of  Aqua color represents the beginning of the UP trend. Wingdings characters of  Orange color represents the beginning of the DOWN trend. Possibility 75% Indicator will improve your trading in the world of forex, commodities, cryptocurrencies and indices.
Atomic Analyst
Issam Kassas
5 (2)
우선적으로 언급할 점은이 거래 지표가 다시 그리지 않고 지연되지 않으며 이를 통해 수동 및 로봇 거래 모두에 이상적이라는 점입니다. 사용자 매뉴얼: 설정, 입력 및 전략. Atomic Analyst는 가격의 강도와 모멘텀을 활용하여 시장에서 더 나은 이점을 찾는 PA Price Action Indicator입니다. 고급 필터를 장착하여 잡음과 거짓 신호를 제거하고 거래 잠재력을 높이는 데 도움이 됩니다. 복잡한 지표의 다중 레이어를 사용하여 Atomic Analyst는 차트를 스캔하고 복잡한 수학적 계산을 간단한 신호와 색상으로 변환하여 초보 트레이더가 이해하고 일관된 거래 결정을 내릴 수 있도록합니다. "Atomic Analyst"는 새로운 및 경험이 풍부한 트레이더를위한 종합적인 거래 솔루션입니다. 프리미엄 지표와 최고 수준의 기능을 하나의 거래 전략에 결합하여 모든 종류의 트레이더에 대한 다재다능한 선택지가되었습니다. 인트라데이 거래 및 스캘핑 전략 : 빠르고 정확한
VR Cub
Vladimir Pastushak
VR Cub 은 고품질 진입점을 얻는 지표입니다. 이 지표는 수학적 계산을 용이하게 하고 포지션 진입점 검색을 단순화하기 위해 개발되었습니다. 지표가 작성된 거래 전략은 수년 동안 그 효율성을 입증해 왔습니다. 거래 전략의 단순성은 초보 거래자라도 성공적으로 거래할 수 있다는 큰 장점입니다. VR Cub은 포지션 개시 지점과 이익 실현 및 손절매 목표 수준을 계산하여 효율성과 사용 편의성을 크게 높입니다. 간단한 거래 규칙을 이해하려면 아래 전략을 사용한 거래 스크린샷을 살펴보세요. 설정, 세트 파일, 데모 버전, 지침, 문제 해결 등은 다음에서 얻을 수 있습니다. [블로그] 다음에서 리뷰를 읽거나 작성할 수 있습니다. [링크] 버전 [MetaTrader 5] 진입점 계산 규칙 포지션 개설 진입점을 계산하려면 VR Cub 도구를 마지막 최고점에서 마지막 최저점까지 늘려야 합니다. 첫 번째 지점이 두 번째 지점보다 빠른 경우, 거래자는 막대가 중간선 위에서 마감될 때까지 기다립
Stepping Trend
Mpendulo Chiliza
The Stepping Trend Indicator     The Steppi ng Trend indicator uses the  average true range  (ATR indicator) in its calculation. This gives you control to set your own average true range period, I set the Default as 10.   Indicator Details. Green Arrow Up: This means you are at the starting point of a new bullish trend, it’s time to buy.   Red  Arrow  Down : This means you are at the starting point of a new  bearish  trend, it’ s time to sell .   What if you miss the Arrow Signal?   No
ZhiBiCCI MT4
Qiuyang Zheng
[ZhiBiCCI] indicators are suitable for all cycle use, and are also suitable for all market varieties. [ZhiBiCCI] Green solid line is a reversal of bullish divergence. The green dotted line is a classic bullish divergence. [ZhiBiCCI] The solid line to the red is a reverse bearish divergence. The red dotted line is a classical bearish divergence. [ZhiBiCCI] can be set in the parameters (Alert, Send mail, Send notification), set to (true) to send instant signals to the alarm window, email, in
SystemBinaryM1
Andrey Spiridonov
SystemBinaryM1 - a professional indicator for trading short-term binary options, is a complete, self-contained author's strategy for working in the binary options market. The unique algorithm for analyzing the foreign exchange market is based on the calculation of reference points on three different time periods M15, M5. M1. Thus, the indicator simultaneously analyzes the long-term, medium-term and short-term price behavior before issuing a signal. The indicator is set in the usual way and work
Super Reversal Pattern
Parfait Mujinga Ndalika
Super Reversal Pattern Indicator Unlock the power of advanced pattern recognition with our Super Reversal Pattern Indicator. Designed for traders seeking precision and reliability, this indicator identifies one of the most effective reversal patterns in technical analysis, offering a significant edge in your trading strategy. Key Features: Non-Repainting Accuracy: Enjoy the confidence of non-repainting technology. Once a Super Reversal Pattern is detected, it remains static, providing consis
The Th3Eng PipFinite indicator is based on a very excellent analysis of the right trend direction with perfect custom algorithms. It show the true direction and the best point to start trading. With StopLoss point and Three Take Profit points. Also it show the right pivot of the price and small points to order to replace the dynamic support and resistance channel, Which surrounds the price. And Finally it draws a very helpful Box on the left side on the chart includes (take profits and Stop loss
PABT Pattern Indicator - it's classical system one of the signal patterns. Indicator logic - the Hi & Lo of the bar is fully within the range of the preceding bar, look to trade them as pullback in trend. In the way if indicator found PABT pattern it's drawing two lines and arrow what showing trend way.  - First line - it's entry point and drawing at: 1. On the high of signal bar or on middle of the signal bar (depending from indicator mode) for buy; 2. On the low of signal bar or on middle of t
Advanced Trend Regime
Shellard Securities (Pty) Ltd
The indicator has been designed to function on any time-frame and any pair.   This regime filter will help the trader better evaluate whether the current market is trending, and in which direction. It quickly reacts to changes in market dynamics using a series of advanced calculations. The user is able to select whether the calculation remains standard, or if a further filter constraint is added to the calculation.   A Yellow moving average of the signal has been included for the trader to smoot
Laser Trend
Nicolas Zouein
The trend is your friend! This is what this indicator is all about. Follow this famous saying and be safe. Characteristics: Buy/Sell signals fixed on the close of a bar. Works on all symbols and all timeframes. Clear visual market trend laser line, Buy/Sell signal arrows, market strength meter, TP1 & TP2 boxes. Visual signals when to enter, when to exit the market. No repainting. Compatible with Flexible EA for trading automation. (Ask for a free set file optimized to perform 2010-2018) Para
Trend Monitor
Pavel Zamoshnikov
4 (4)
The indicator generates early signals basing on ADX reading data combined with elements of price patterns. Works on all symbols and timeframes. The indicator does not redraw its signals. You see the same things on history and in real time. For better visual perception signals are displayed as arrows (in order not to overload the chart). Features Easy to use. Filter configuration only requires selection of sensitivity in the " Sensitivity of the indicator " input. Signals can be filtered usin
Trend Divergence Finder – индикатор, позволяющий выявлять дивергенции цены и графика выбранного индикатора. С помощью Trend Divergence Finder вы сможете подобрать тот индикатор, который наиболее эффективен для Вас, и использовать его с наглядным отображением на графике. В индикатор включены 9 базовых индикаторов : 1.        RSI 2.        MACD 3.        MOMENTUM 4.        RVI 5.        STOCHASTIC 6.        CCI 7.        Standard Deviation 8.        Derivative 9.        William Blau Присутст
CyberZingFx Trend Reversal
Afsal Meerankutty
4.18 (17)
Indicator captures the trend reversals with no-repaint Buy and Sell Arrow signals. CyberZingFx Trend Reversal Indicator - your go-to solution for accurate and reliable trend reversal signals. With its  advanced trading strategy , the indicator offers you Buy and Sell Arrow signals that do not repaint, making it a reliable tool for catching Swing Highs and Swing Lows in any market and any time frame. Indicator works on  any market  and  any time frames . __________________________________________
[V 1.00] 기동특무부대 NRPA 5 RSI RTD 출시! 다시 칠하지 않는 화살표 실시간 대시보드. 다양한 RSI 지표를 사용하는 데 지쳤지만 정확하지 않은 경우 이 도구를 사용해 보십시오. 일반적으로 사람들은 일정 기간 동안 OBOS 수준을 결정하기 위해 1 RSI만 설치합니다. 나쁜 소식은 다양한 시간대의 OBOS 수준과 추세를 한 번에 볼 수 없다는 것입니다. 이것이 제가 이 거래 도구를 개발한 이유입니다. 설명 방법은 다음과 같습니다. 이 거래 도구에서는 5개의 RSI를 사용합니다. 예, 다섯! 기본적으로 M30이라는 큰 시간 프레임에 RSI 1과 RSI 2를 설정합니다. RSI 1과 RSI 2의 교차점은 M30 시간대에 추세 변화가 있음을 의미합니다. 그런 다음 현재(작은) 시간대에 RSI 3과 RSI 4를 설정합니다. 예를 들어 M5에서 차트를 엽니다. RSI 3과 RSI 4의 교차점은 현재 시간대(M5)에 추세 변화가 있음을 의미합니다. 그런 다음
이 제품의 구매자들이 또한 구매함
TPSpro RFI Levels
Roman Podpora
4.82 (22)
지침         러시아   -        영어       표시기와 함께 사용하는 것이 좋습니다   .       -       TPSpro   트렌드 프로 -   MT4 버전         거래에서 핵심 요소는 거래 상품을 매수 또는 매도하기로 결정하는 구역 또는 수준입니다. 주요 업체가 시장에서 자신의 존재를 숨기려는 시도에도 불구하고, 그들은 필연적으로 흔적을 남깁니다. 우리의 과제는 이러한 흔적을 식별하고 올바르게 해석하는 방법을 배우는 것이었습니다. 주요 기능:: 판매자와 구매자를 위한 활성 영역을 표시합니다! 이 지표는 매수 및 매도를 위한 모든 올바른 초기 임펄스 레벨/존을 보여줍니다. 진입점 검색이 시작되는 이러한 레벨/존이 활성화되면 레벨의 색상이 바뀌고 특정 음영으로 채워집니다. 또한 상황을 보다 직관적으로 이해하기 위해 화살표가 나타납니다. 더 높은 시간대의 레벨/존 표시(MTF 모드) 더 높은 시간 간격을 사용하여 레벨/존을 표시하는 기능을 추가했습니다.
Apollo Pips PLUS SP
Oleg Rodin
5 (4)
제품을 구매하기 전에 아래 정보를 읽어보세요! Apollo Pips PLUS SP는 독특한 제품입니다! 모든 거래 지표에 액세스할 수 있는 새로운 "APOLLO PIPS" 지표와 "슈퍼 팩" 보너스를 받고 싶은 분들을 위한 것입니다! Apollo Pips PLUS SP 제품을 구매하면 실제로 Apollo Pips 표시기의 완전히 새로운 버전을 구매하게 됩니다. 이 버전의 지표에는 개선된 알고리즘과 사용하기 쉬운 매개변수가 있어 모든 시장 및 거래 스타일에서 지표를 사용할 수 있는 기회를 제공합니다. 이 제품의 구매자는 슈퍼 보너스로 다른 모든 표시기에 무료로 액세스할 수 있습니다! 내 모든 거래 도구에 액세스하고 싶었다면 이 제품이 당신에게 딱 맞습니다! :) 하지만 이것이 전부는 아닙니다! :) 이 제품의 모든 구매자는 또한 내 새로운 지표를 무료로 받을 자격이 있습니다! :) 새로운 거래 지표를 사용할 수 있게 되었는데, 귀하는 저의 특별한 "SUPER PACK" 평생 보너스
TPSproTREND PrO
Roman Podpora
4.79 (19)
TPSpro TREND PRO는   시장을 자동으로 분석하여 추세와 각 변화에 대한 정보를 제공할 뿐만 아니라 다시 그리지 않고도 거래에 진입할 수 있는 신호를 제공하는 추세 지표입니다! 지표는 각 양초를 사용하여 개별적으로 분석합니다. 다른 임펄스를 언급합니다 - 업 또는 다운 임펄스. 통화, 암호화폐, 금속, 주식, 지수 거래의 정확한 진입점! 버전 MT5                   표시기에 대한 전체 설명       표시기   와 함께 사용하는 것이 좋습니다   -   RFI LEVELS 주요 기능: 렌더링 없이 정확한 입력 신호! 신호가 나타나면 관련성은 유지됩니다! 이는 신호를 제공한 후 변경하여 예금 자금 손실을 초래할 수 있는 다시 그리기 지표와의 중요한 차이점입니다. 이제 더 큰 확률과 정확도로 시장에 진입할 수 있습니다. 화살표가 나타난 후 목표에 도달(이익실현)하거나 반전 신호가 나타날 때까지 캔들을 색칠하는 기능도 있습니다. STOP LOSS / TAK
(Currently 30% OFF) Before reading the description of this indicator, I just want to introduce to you following concept Moving Average Line - Typical moving average which is based on one chart alone.  Currency Strength Line - The moving average of a certain pair in which the strength is based on 28 pairs. Can be said as the real moving average line. Moving Average indeed is one of the most popular indicator which almost every trader use. Currency Strength Meter is also a trend indicator whic
Pair Trading Station MT4
Young Ho Seo
3.67 (3)
How to use Pair Trading Station Pair Trading Station is recommended for H1 time frame and you can use it for any currency pairs. To generate buy and sell signal, follow few steps below to apply Pair Trading Station to your MetaTrader terminal. When you load Pair Trading Station on your chart, Pair Trading station will assess available historical data in your MetaTrader platforms for each currency pair. On your chart, the amount of historical data available will be displayed for each currency pai
이 지표는 실제 거래에 완벽한 자동 파동 분석 지표입니다! 사례... 참고:   웨이브 그레이딩에 서양식 이름을 사용하는 데 익숙하지 않습니다. Tang Lun(Tang Zhong Shuo Zen)의 명명 규칙의 영향으로 기본 웨이브를   펜   으로 명명하고 2차 웨이브 밴드를   세그먼트   로 명명했습니다. 동시에, 세그먼트에는 추세 방향이 있습니다.   주요 추세 세그먼트에는   이름이 지정되지만(이 이름 지정 방법은 향후 노트에서 사용됩니다. 먼저 말씀드리겠습니다.) 알고리즘은 굴곡 이론과 거의 관련이 없으므로 그렇게 해서는 안 됩니다. 이는 나의 시장 분석을   통해 요약된 끊임없이 변화하고 복잡한 운영 규칙을   반영합니다. 밴드는 더 이상 사람마다 다르지 않도록 표준화되고 정의되었습니다. 인위적인 간섭의 드로잉 방법은 시장 진입을 엄격하게 분석하는 데 핵심적인 역할을 합니다. 이 지표를 사용하는 것은 거래 인터페이스의 미학을 개선하고 원래의 K-line 거
Dynamic Forex28 Navigator
Bernhard Schweigert
5 (2)
Dynamic Forex28 Navigator - 차세대 외환 거래 도구. 현재 49% 할인. Dynamic Forex28 Navigator는 오랫동안 인기 있는 지표의 진화형으로, 세 가지의 힘을 하나로 결합했습니다. 고급 통화 Strength28 지표(695개 리뷰) + 고급 통화 IMPULSE with ALERT(520개 리뷰) + CS28 콤보 신호(보너스). 지표에 대한 자세한 정보 https://www.mql5.com/en/blogs/post/758844 차세대 Strength 지표는 무엇을 제공합니까?  원래 지표에서 좋아했던 모든 것이 새로운 기능과 더 높은 정확도로 강화되었습니다. 주요 기능: 독점적인 통화 Strength 공식.  모든 시간대에 걸쳐 부드럽고 정확한 강도선. 추세와 정확한 진입을 식별하는 데 이상적입니다. 역동적인 시장 피보나치 수준(시장 피보나치).  이 지표에만 있는 고유한 기능. 가격 차트가 아닌 통화 강도에 피보나치가 적용
Enigmera
Ivan Stefanov
5 (3)
에니메라: 시장의 핵심 https://www.enigmera.com 소개 이 지표 및 트레이딩 시스템은 금융 시장에 대한 놀라운 접근 방식입니다. 에니메라는 프랙탈 주기를 사용하여 지지선과 저항선을 정확하게 계산합니다. 진정한 축적 단계를 보여주고 방향과 목표를 제시합니다.  추세에 있든 조정에 있든 작동하는 시스템입니다.  어떻게 작동하나요? 에니메라는 지지선/저항선, 목표선, 편차선의 세 가지 라인으로 구성됩니다. 이 시스템은 과거 데이터를 현재와 미래로 추정하는 일반적인 시장 지표와 달리 현재에 대한 완전한 그림을 제공합니다. 지지선 위에 있으면 실제 지지를 의미하고 저항선 위에 있으면 실제 저항을 의미합니다. 레벨이 깨지면 추세의 변화를 나타냅니다. 다시 그리지 않습니다. 시장이 지속적으로 진화함에 따라 에니메라는 평가 도구를 조정하여 전략을 정기적으로 수정합니다.   이를 통해 모든 시나리오를 철저히 평가할 수 있습니다. 이 시장 지표의 고유성은 분명하며 그 기
현재 20% 할인 ! 초보자 또는 전문가 트레이더를 위한 최고의 솔루션! 이 대시보드 소프트웨어는 28개의 통화 쌍에서 작동합니다. 2가지 주요 지표(Advanced Currency Strength 28 및 Advanced Currency Impulse)를 기반으로 합니다. 전체 Forex 시장에 대한 훌륭한 개요를 제공합니다. 고급 통화 강도 값, 통화 이동 속도 및 모든(9) 시간대의 28 Forex 쌍에 대한 신호를 보여줍니다. 추세 및/또는 스캘핑 기회를 정확히 파악하기 위해 차트의 단일 지표를 사용하여 전체 시장을 볼 수 있을 때 거래가 어떻게 개선될지 상상해 보십시오! 잠재적인 거래를 식별하고 확인하면서 강력한 통화와 약한 통화를 더욱 쉽게 식별할 수 있도록 이 지표에 기능을 내장했습니다. 이 표시기는 통화의 강세 또는 약세가 증가 또는 감소하는지 여부와 모든 시간대에서 수행되는 방식을 그래픽으로 보여줍니다. 추가된 새로운 기능은 현재 시장 조건 변화에 적
Currently Price 20% OFF ( for unlimited use )   BONUS  AUX VIP Club 2024 : Include  EA Airbag  and  Load Data History  to enhance the performance of this tool to its maximum potential  Click Here to Download Files   ( for users only )   Hello World! Introducing.. SMCpro VIP tool and Indicator for MetaTrader 4, designed to revolutionize your trading experience with the ICT Smart Money Concept. This system is meticulously crafted to empower traders with advanced insights and precision in
System Trend Pro
Aleksandr Makarov
5 (2)
System Trend Pro - This is the best trend trading indicator!!! The indicator no repaint!!!   The indicator has   MTF   mode, which adds confidence to trading on the trend (   no repaint   ). How to trade? Everything is very simple, we wait for the first signal (big arrow), then wait for the second signal (small arrow) and enter the market in the direction of the arrow. (See screens 1 and 2.) Exit on the opposite signal or take 20-30 pips, close half of it, and keep the rest until the oppo
ON Trade Waves Patterns Harmonic Elliot Wolfe를 소개합니다. 이는 수동 및 자동 방법을 사용하여 다양한 시장 패턴을 감지하기 위해 개발된 고급 지표입니다. 다음은 그 작동 방식입니다: 조화적 패턴: 이 지표는 차트에 나타나는 조화적 패턴을 식별할 수 있습니다. 이러한 패턴은 Scott Carney의 "Harmonic Trading vol 1 및 2"에서 설명한 것처럼 조화적 거래 이론을 연습하는 트레이더에게 중요합니다. 수동으로 그리든 자동 감지를 사용하든 ON Trade Waves Patterns가 도움을 줄 것입니다. 컨트롤 패널: 이 지표에는 사용자 친화적인 컨트롤 패널이 있습니다. 차트 및 시간 프레임 설정을 저장하여 다양한 구성 간에 쉽게 전환할 수 있습니다. 차트 공간을 최대화하려면 최소화할 수도 있습니다. 다른 분석 도구를 사용하는 것을 선호하는 경우 닫기 버튼을 클릭하여 모든 지표 데이터를 숨길 수 있습니다. 템플릿 저장: 설정을 사
Alright. This indicator works on MT4 and is very easy to use. When you receive a signal from it, you wait for that candle with the signal to close and you enter your trade at the beginning of the next new candle. A red arrow means sell and a green arrow means buy. All arrows comes with Popup Alert like for easy identification of trade signal. Are you okay with that?   100% non repaint Work All Major currency  Pair,  1 minute time frame 1 minute expire
Gold Channel XAUUSD
Paulo Rocha
5 (4)
Gold Channel is a volatility-based indicator, developed with a specific timing algorithm for the XAUUSD pair, which consists of finding possible corrections in the market. This indicator shows two outer lines, an inner line (retracement line) and an arrow sign, where the theory of the channel is to help identify overbought and oversold conditions in the market. The market price will generally fall between the boundaries of the channel. If prices touch or move outside the channel it is a tra
Gann Swing Structure
Kirill Borovskii
5 (1)
This indicator is based on the mathematics of the great trader W.D. Ganna. With its help, you can easily find strong levels by analyzing swings to find the optimal entry point. The indicator works on all instruments and all timeframes. The indicator is fully manual and has control buttons. All you need to do is press the NEW button, a segment will appear, which you can place on any movement, swing or even 1 candle that you want to analyze. By placing the segment, press the OK button. A grid (th
TPA True Price Action indicator reveals the true price action of the market makers through 100% non-repainting signals (except early signals mode) strictly at the close of a candle! TPA shows entries and re-entries, every time the bulls are definitely stronger than the bears and vice versa. Not to confuse with red/green candles. The shift of power gets confirmed at the earliest stage and is ONE exit strategy of several. There are available now two free parts of the TPA User Guide for our custo
MR Reversal Patterns 4
Sergey Khramchenkov
5 (2)
In the "Masters of Risk" trading system, one of the main concepts is related to places where markets change direction. In fact, this is a change in priority and a violation of the trend structure at the extremes of the market, where supposedly there are or would be stop-losses of "smart" participants who are outside the boundaries of the accumulation of volume. For this reason, we call them "Reversal Patterns" - places with a lot of weight for the start of a new and strong trend. Some of the imp
The Stochastic Basket Currency Strenght  brings the Stochastic indicator to a new level.  Expanding the boundaries of TimeFrames and mono-currency analysis, the SBCS take the movements of each currency that composes the cross and confront them in the whole basket of 7 crosses.  The indicator works with any combination of AUD, CAD, CHF, EUR, GBP, JPY, NZD, USD pairs and with full automation takes in account every stochastic value (main line) for the selected Time Frame.  After that, the indicator
Trading System Double Trend - an independent trading system consisting of several indicators. Determines the direction of the general trend and gives signals in the direction of price movement. Can be used for scalping, intraday or weekly trading. Features Works on any time frames and trading instruments (forex, cryptocurrencies, metals, stocks, indices.) Simple visual reading of information that does not load the chart The indicator does not repaint and does not complete signals Works onl
ECM Elite Channel is a volatility-based indicator, developed with a specific time algorithm, which consists of finding possible corrections in the market. This indicator shows two outer lines, an inner line (retracement line) and an arrow sign, where the channel theory is to help identify overbought and oversold conditions in the market. The market price will generally fall between the boundaries of the channel. If prices touch or move outside the channel, it's a trading opportunity. The
Bomb Bank Signal
Igor Pereira Calil
5 (1)
폭탄 은행 신호: MetaTrader 4의 신뢰도 지표 Bomb Bank Signal은 금융 시장에서 가장 관련성이 높은 추세를 식별하도록 설계된 MetaTrader 4의 강력한 지표입니다. 움직임을 정확하게 예측하는 도구를 찾고 있다면 Bomb Bank가 바로 여러분에게 필요한 동맹입니다. 작동 방식: 이 지표는 거래량 분석, 양초 종가, 대칭 추세 등 세 가지 방법을 결합하여 매수 및 매도 기회를 감지하고 신호를 보냅니다. Bomb Bank는 매수 기회를 포착할 때는 '폭탄'과 같고, 매도 신호를 감지할 때에는 '해골'과 같습니다. 폭탄 은행은 왜 다른가요? 완전한 신뢰성: 폭탄 은행 신호는 신호를 제거하지 않습니다. 일단 신호가 발행되면 그 신호는 계속 유지되므로 기회를 절대 놓치지 않습니다. 극도의 정확성: Bomb Bank는 잘못된 신호를 보내지 않습니다. 시장이 발전함에 따라 조정하면서 실시간으로 업데이트하지만 이전 신호의 투명성은 유지합니다. 실시간
XQ Indicator MetaTrader 4
Marzena Maria Szmit
4 (4)
Step into the realm of Forex trading with confidence and precision using XQ, a cutting-edge Forex indicator designed to elevate your trading game to unprecedented heights. Whether you're a seasoned trader or just stepping into the world of currency exchange,   XQ Forex Indicator   empowers you with the insights and signals needed to make informed trading decisions. The signal conditions are a combination of three indicators, and XQ Forex Indicator only display  medium and long-term trends . The
Supply and Demand Dashboard PRO
Bernhard Schweigert
4.8 (20)
현재 20% 할인! 이 대시보드는 여러 기호와 최대 9개의 타임프레임에서 작동하는 매우 강력한 소프트웨어입니다. 주요 지표(최상의 리뷰: 고급 공급 수요)를 기반으로 합니다.   Advanced Supply Demand 대시보드는 훌륭한 개요를 제공합니다. 다음과 같이 표시됩니다.  영역 강도 등급을 포함하여 필터링된 공급 및 수요 값, 영역에 대한/및 영역 내 Pips 거리, 중첩된 영역을 강조 표시하고 모든 (9) 시간 프레임에서 선택한 기호에 대해 4가지 종류의 경고를 제공합니다. 그것은 당신의 개인적인 필요에 맞게 고도로 구성 가능합니다! 당신의 혜택! 모든 트레이더에게 가장 중요한 질문: 시장에 진입하기에 가장 좋은 수준은 무엇입니까? 최고의 성공 기회와 위험/보상을 얻으려면 강력한 공급/수요 영역 내 또는 그 근처에서 거래를 시작하십시오. 손절매를 위한 최적의 장소는 어디입니까? 가장 안전하려면 강력한 수요/공급 구역 아래/위에 정
TrendMaestro
Stefano Frisetti
5 (3)
note: this indicator is for METATRADER4, if you want the version for METATRADER5 this is the link:  https://www.mql5.com/it/market/product/108106 TRENDMAESTRO ver 2.4 TRENDMAESTRO recognizes a new TREND in the bud, he never makes mistakes. The certainty of identifying a new TREND is priceless. DESCRIPTION TRENDMAESTRO identifies a new TREND in the bud, this indicator examines the volatility, volumes and momentum to identify the moment in which there is an explosion of one or more of these data a
Reversal Sniper is designed to find the extreme reversals of the price. Indicator collects data of Cycle Sniper Indicator. NOTE: REVERSAL SNIPER Indicator is made for Cycle Sniper Users as an additional tool.  However, it can be used by the traders who look for finding out strong reversal levels. Indicator works on all timeframes and all instruments. Reversal  Sniper  Checks: Harmonic Patterns RSI Zig Zag and Harmonic Swings Cycle Sniper Indicator's Buy / Sell Signals The complex algo i
Smart Market Analyser
Elias Mtwenge
5 (1)
REMINDER: Early buyers hot price discount: Price subject to rise after first 20 copies. Starting price $65 and final price will be $1275. Secure your discounted copy Now! Smart Money Analyser Indicator User Manual 1. Introduction Welcome to the   Smart Money Analyser Indicator This powerful tool provides traders with comprehensive market analysis by combining various technical indicators to generate actionable trading signals. Designed to be user-friendly, this indicator helps traders of a
Introducing the South African Sniper indicator created by a small group of traders with a few years trading trading the financial market profitably . This is a plug and play indicator that provides you with  BUY and SELL (SNIPER ENTRY) signals with TARGET and trail stops. The indicator Works with all MT4 trading instruments. The indicator uses previous  chart data as receipt to speculate on future market moves.
RelicusRoad Pro
Relicus LLC
4.64 (103)
이제 $ 147 (몇 가지 업데이트 후 $ 499 증가) - 무제한 계정 (PCS 또는 MACS) RelicusRoad 사용 설명서 + 교육 비디오 + 비공개 Discord 그룹 액세스 + VIP 상태 시장을 보는 새로운 방법 RelicusRoad는 외환, 선물, 암호화폐, 주식 및 지수에 대한 세계에서 가장 강력한 거래 지표로서 거래자에게 수익성을 유지하는 데 필요한 모든 정보와 도구를 제공합니다. 우리는 초보자부터 고급까지 모든 거래자가 성공할 수 있도록 기술적 분석 및 거래 계획을 제공합니다. 미래 시장을 예측할 수 있는 충분한 정보를 제공하는 핵심 거래 지표입니다. 우리는 차트에서 말이 안 되는 여러 지표 대신 완전한 솔루션을 믿습니다. 타의 추종을 불허하는 매우 정확한 신호, 화살표 + 가격 조치 정보를 표시하는 올인원 표시기입니다. 강력한 AI를 기반으로 하는 RelicusRoad는 누락된 정보와 도구를 제공하여 교육하고 성공적인 트레이더인 트레이딩 전문
NAM Order Blocks
NAM TECH GROUP, CORP.
5 (1)
MT4 Multi-timeframe Order Blocks detection indicator. Features - Fully customizable on chart control panel, provides complete interaction. - Hide and show control panel wherever you want. - Detect OBs on multiple timeframes. - Select OBs quantity to display. - Different OBs user interface. - Different filters on OBs. - OB proximity alert. - ADR High and Low lines. - Notification service (Screen alerts | Push notifications). Summary Order block is a market behavior that indicates order collection
Volume by Price MT4
Brian Collard
4.64 (11)
The Volume by Price Indicator for MetaTrader 4 features Volume Profile and Market Profile TPO (Time Price Opportunity). Volume and TPO histogram bar and line charts. Volume Footprint charts. TPO letter and block marker collapsed and split structure charts. Static, dynamic and flexible range segmentation and compositing methods with relative and absolute visualizations. Session hours filtering and segment concatenation with Market Watch and custom user specifications. Graphical layering, positio
제작자의 제품 더 보기
Comprehensive on chart trade panel with the unique ability to be controllable from mobile as well. Plus has a library of downloadable configuration, e.g. exit rules, extra panel buttons, pending order setup and more. Please see our product video. Works with all symbols not just currency pairs. Features On chart panel plus controllable from free app for Windows, iPhone and Android Built-in script engine with library of downloadable configuration, e.g. add 'Close All Trades in Profit' button, exit
Fully functional manual trade panel with lot size calculation, one-click trading, hidden (virtual) stop loss/take profit and pending orders, scale in and out of trades (partial close), auto SL/TP and more. Works with all symbols not just currency pairs. Brings an incredible amount of functionality to MetaTrader for free and for both demo and live accounts. Features Lot size calculation - based on % of account to risk, fixed amount or dynamic lots Automatic take profit based on risk reward ratio
FREE
Strategy Builder offers an incredible amount of functionality. It combines a trade panel with configurable automation (covert indicators into an EA), real-time statistics (profit & draw down) plus automatic optimization of SL, TP/exit, trading hours, indicator inputs. Multiple indicators can be combined into an single alert/trade signal and can include custom indicators, even if just have ex4 file or purchased from Market. The system is easily configured via a CONFIG button and associated pop-up
Comprehensive on chart trade panel with the unique ability to be controllable from mobile as well. Plus has a library of downloadable configuration, e.g. exit rules, extra panel buttons, pending order setup and more. Please see our product video. Works with all symbols not just currency pairs. Features On chart panel plus controllable from free app for Windows, iPhone and Android Built-in script engine with library of downloadable configuration, e.g. add 'Close All Trades in Profit' button, exit
Fully functional manual trade panel with risk/reward, auto SL, lot size calculation, one-click trading, hidden (virtual) stop loss/take profit and pending orders, scale in and out of trades (partial close), news events and more. Works with all symbols not just currency pairs. Brings an incredible amount of functionality to MetaTrader for free and for both demo and live accounts. Features Lot size calculation - based on % of account to risk, fixed amount or dynamic lots Automatic take profit base
FREE
Allows multiple indicators to be combined into a single indicator, both visually and in terms of an alert. Indicators can include standard indicators, e.g. RSI, CCI, etc., and also Custom Indicators, even those purchased through Market, or where just have the ex4 file. An early alert is provided, say when 4 out 5 indicators have lined up, and a confirmed alert when all are in agreement. A‌lso features a statistics panel reporting the success of the combined indicator by examining the current cha
The first currency based indicator to draw a distinction between map and strength. The map shows the currencies in terms of oversold/overbought levels and gives the direction of travel. The currency strength calculates and shows the strength of that move. Alerts are included for changes in currency direction on the map (confirmed over two bars) and also when the strength reached the appropriate level.  The currency map is useful for finding currency pairs to trade and in which direction. Look fo
The indicator displays a matrix of indicators across multiple timeframes with a sum total and optional alert. Custom indicators can also be added to the matrix, in a highly configurable way. The alert threshold can be set to say what percentage of indicators need to be in agreement for an alert to happen. The alerts can turned on/off via on chart tick boxes and can be set to notify to mobile or sent to email, in addition to pop-up. The product offers a great way to create an alert when multiple
Description Shows Heikin-Ashi candles (often misspelled Heiken-Ashi) on the chart and can alert when candles change color. The alert is useful for both entry and exit. The number of candles of the new color before an alert is raised can be set. The alert can be controlled interactively, directly from the chart. Also includes bonus indicators of current spread and ask/bid prices in large text, color coded as price changes. Usage Heikin-Ashi candles give a much better insight to the underlying tre
Description The product draws lines on the chart to show daily support, resistance and pivot plus weekly and monthly pivot. An alert can be set when the price reaches one of the lines or the price closes above/below it. This can be useful for both entry and exit. The alerts can be controlled interactively directly from the chart. The product also includes bonus indicators of Average Daily Range (or Average True Range - configurable), current spread and ask/bid prices in large text, color coded
Description Shows whether market is trending or not, to what extent, which direction, and if the trend is increasing. The indicator is very useful for trend following strategies. The indicator can also alert when the market transitions from being flat to trending, which can serve as a great entry point. The alert is controllable directly from the chart, with an on-chart tick box to enable the alert. Also includes bonus indicators of current spread and ask/bid prices in large text, color coded as
Provides the simplicity of binary options but addresses the shortcomings of regular binary options, namely: Poor risk reward ratio, fixed duration trades, poor broker choice, poor indicators/alerts, no hidden (stealth) stop loss/take profit, etc. Features 1 to 1 risk reward ratio, calculated automatically (configurable) Manual (with alert) or automatic trade entry (on alert conditions) Lot size calculation (money management) - based on % of account to risk or fixed amount Compact interactive o
The product combines a manual trade panel with the ability to perform actions automatically in a highly configurable way. Actions include capturing indicator values and then based on those values raising alerts, open/close or partially close trades, scale-in, setting up pending orders, adjusting stop loss, take profit and more. On-chart controls can be configured, such as tick boxes and buttons, so can be fully interactive. The EA also handles money management, news events, hidden stop loss, tak
Allows symbols/currency pairs to be ordered based on a configured indicator, with the best performing symbols shown at the top. This helps you to select the symbol with better prospects from a given list of symbols. Can optionally alert when a symbol moves into the top two (configurable). Also shown is the number of pips that the symbol has moved in its current direction, allowing you to tell if you've 'missed the boat'. Further, a graph is shown, per symbol, of the indicator value over time all
The indicator displays trend strength, including showing the transition from buy to sell and visa versa. It is ideal for trend following strategies and also highlights possible reversals/flattening trend with a yellow X on the indicator window. By default, the indicator does not repaint/flicker, however, there is an option to calculate on the live candle but even then the indicator will not repaint unduly. The indicator can also be used for exit. Usage Enter long/buy trade when the indicator t
Displays multiple indicators, across multiple timeframes and symbols to give a comprehensive overview of the market. Uniquely, the indicators are configurable and can include custom indicators, even those where you just have the ex4 file or those purchased from Market. Standard indicators can also be selected, the default being ADX, CCI, market price above/below Moving Average (MA), Moving Average Cross (MAX), MACD, Momentum (MOM), OsMA, RSI, Parabolic SAR, William's Percentage Range (WPR). Use
The product combines a manual trade panel with the ability to perform actions automatically in a highly configurable way. Actions include capturing indicator values and then based on those values raising alerts, open/close or partially close trades, scale-in, setting up pending orders, adjusting stop loss, take profit and more. On-chart controls can be configured, such as tick boxes and buttons, so can be fully interactive. The EA also handles money management, news events, hidden stop loss, tak
Shows whether market is trending or not, to what extent, which direction, and if the trend is increasing. The indicator is very useful for trend following strategies, where it can filter out flat/choppy markets. The indicator can also alert when the market transitions from being flat to trending, which can serve as a great trade entry point. The alert is controllable directly from the chart, via a tick box. Also, the product includes bonus indicators of the current spread and ask/bid prices in l
Displays multiple indicators, across multiple timeframes and symbols to give a comprehensive overview of the market. Uniquely, the indicators are configurable and can include custom indicators, even those where you just have the ex4 file or those purchased from Market. Standard indicators can also be selected, the default being ADX, CCI, market price above/below Moving Average (MA), Moving Average Cross (MAX), MACD, Momentum (MOM), OsMA, RSI, Parabolic SAR, William's Percentage Range (WPR). Use
Strategy Builder offers an incredible amount of functionality. It combines a trade panel with configurable automation (covert indicators into an EA), real-time statistics (profit & draw down) plus automatic optimization of SL, TP/exit, trading hours, indicator inputs. Multiple indicators can be combined into an single alert/trade signal and can include custom indicators, even if just have ex4 file or purchased from Market. The system is easily configured via a CONFIG button and associated pop-u
필터:
Dorianmode
322
Dorianmode 2023.07.09 21:45 
 

사용자가 평가에 대한 코멘트를 남기지 않았습니다

joseanrod
95
joseanrod 2023.04.20 15:22 
 

To keep it short, a SENSATIONAL tool for backtesting, indicating when to buy/sell and exit based on your system. If you have a profitable and fully mechanical system based on indicators then this is a must have tool. It facilitates your backtesting so much and provides you statistics based on the chosen days, which boosts your confidence and saves you precious time. Very user friendly, the videos on Youtube are very useful, comprehensive manual to reference. Not to say about the support and customer service is OUTSTANDING. Any legitimate doubt that I’ve had, I received a prompt and comprehensive answer to my Qs. LASTLY, before you buy, make sure that this is the tool you are looking for. This is an indicator and even though you can build your mechanical strategy using this tool, you cannot automate it (run it as an EA) since it’s an indicator. Make sure you take a look to his products and ask support if they have them on their website since through them, you don’t have the hardware activation limit. If you are confused, just contact the support email, describe what you’re looking for and I hope you’ll end up satisfied as myself.

Nicola Pileri
313
Nicola Pileri 2020.04.01 19:21 
 

Mi stupisce che ci siano così poche valutazioni, tutti i commercianti dovrebbero avere questo sistema che fa risparmiare enorme tempo.

Fantastico sistema.

Trader mql5
1265
Trader mql5 2019.04.25 04:01 
 

Where do I start...

Most importantly, support is superb and this is a unique, one-of-a-kind "app". I call it an app as it assists you in guiding which indicators have some hope and which are just rubbish by quickly analyzing the buffers of the indicators.

I certainly have a love-hate relationship with it, as it exposes the indicators which I thought are profitable in the long run, but fail miserably. I could have bet my life on some indicators, but this app clearly trashed most of them. I am starting to realize that indicators are not my way forward in trading...

I literally tested 3000+ indicators over the last couple months. Most can be trashed immediately within a few seconds by inserting the buffers. Others seem extremely profitable, but then test them through Strategy Tester, just to realize they either repaint or back-paint, even subtly by changing color, arrow or angle within one candle. When this info is then fed to the app by shifting the confirmation to 2 bars i.l.o 1 bar - crash, boom, bang, kaputt. It will need some reading and studying the manual in DETAIL to be able to identify which capture modes to use, but you will get there, believe me I am not overly bright and my mind melts when I have to program anything even remotely simple, but the logic of this piece of software is fantastic, once you get the hang of it - no programming required, you just pick the appropriate capture options and set your TP, SL levels. Also appropriate time frame consideration is very important with different TP/SL for each TF.

Remember there are many options for Stop Loss and Take Profit. Some indys like quick TP without waiting for opposite signals, others need opposite signals to be profitable. Scaling in on some are also good instead of a blind TP level. Combinations of both scaling in and exit/reverse on opposite signals are also possible. Stop Loss levels for each pair is also sensitive due to the pair's volatility, play around.

If you are an indicator addict like me, it will save you thousands. I spend more on indicators than on my trading balance in the hope to find that one gem - AND THIS IS THAT VERY GEM. If you insert this indicator in strategy tester, then demo a market indicator within it without buying it, you can very quickly make up your mind. Test the top 20 indicators in demo here on MQL5, you will be shocked. Bear in mind, multi time frame indicators will not work properly in Strategy Tester, with or without Indicator Merge. Refer to the sellers of these indys and they may have a free "lite" version or limited demo version for you to test.

Just a final tip: Even if you found a indy or a combination of Indicators that look good, even after testing them in Strategy Tester and you found them not re- or backpaint - Try them yet again in Strategy Tester together with Indicator Merge to give you current stats. Many, many indicators appear not to repaint, but small changes are sometimes not noticed unless they run bar by bar.

I am a rehabilitated compulsive gambler, this software is helping me turn into a rehabilitated compulsive indicator user at a price that is low for its effectiveness. I have currently only a handful of indys (most of them are free!) which may be useful as confirmation, still optimizing them to make a final decision.

The grey matter with vast voids between our ears seems to be the greatest expert advisor of all.

Additional edit: Where this app shines with Indicators is what Strategy Tester does for Expert Advisors. With Strategy Tester you can optimise the parameters of your EA to review which settings are the most profitable. This is not possible with Indicators as they do not have actual trade signals for Strategy Tester to invoke trade stats. With Indicator Combine you can enter the parameter settings of your indicator and see what impact it has on the profit/loss e.g. calc lookback parameter default of an indicator is 13, but what happens if you set it at 9 or 5 or 15? These stats are updated instantly without running it through Strategy Tester. Just remember if it does re-/backpaint it would be wise to run (no pun intended) again through Strategy Tester with Indicator Merge running concurrently.

I actually now test EVERY indicator through Strategy Tester with IC, it is mind blowing how many programmers manipulate the signals to show great signals in the past, just to realise when running them live, the signals are not even close to what they indicated in history. There are very few exceptions..

nicetees
153
nicetees 2018.08.23 14:26 
 

This indicator is the best investment I have made so far! I accidentally stumbled on it while searching for a MT4 programmer to combine some indicators into one, and this is far better. Excellent value and customer service! I am very pleased with my purchase.

sunnychow
8931
sunnychow 2018.08.08 17:40 
 

I am still study to understand the signal , edit the indicator, I will update my review later

Wang Chern Hoe
1022
Wang Chern Hoe 2018.03.22 02:33 
 

This indicator is the single best investment I made. It is a game changer for me. The support is fantastic as well!

Mujeeb Abdul
2228
Mujeeb Abdul 2017.11.14 08:22 
 

Excellent indicator good support

Marcel Wagner
535
Marcel Wagner 2017.09.12 14:49 
 

This is the most useful Tool i`ve ever purchased/tested on the MQL5 Market for sure, i created a reliable Signal with it and use it with the Strategy Automator also from RunwiseFX, it already payed off. Nothing more to say.

appropiate
1737
appropiate 2017.08.29 00:04 
 

Another magnificent tool from RunwiseFX! Able to analyze at a glance profitability, win/loss ratio and drawdown of strategies based on indicators/indicator combinations, SL, TP levels, trading hours and many other configurations, for all opened charts with different pairs/timeframes. All the statistics are summarized in one table for easy comparison. Huge time saver for backtesting and choosing best pair to trade. The Indicator Combine + Strategy Automator (their other excellent EA) will allow to analyze indicator-based strategies, choose the best strategy/configuration and convert it into an EA that can trade for you automatically. Functionality and configurability at its best. And customer support is beyond outstanding. I usually receive several emails per day, even on weekends. They are also open to modifying their tools upon reasonable/constructive feedback. Thanks a million Mark/RunwiseFX team!

Peter
1093
Peter 2017.07.25 12:27 
 

Fantastic indicator and works as promised. I'm never disappointed with products from RunwiseFX and the support is great.

Thanks Mark!

Alexander Dubenskiy
1749
Alexander Dubenskiy 2017.07.22 02:46 
 

I've been using this indicator for about I'd say 1 month if memory not deceiving me if not longer.

runwisefx products in general are products I use the most on mt4 platform. Overwhelming majority of indicators in my library being used with Indicator Combine or multiple indicator matrix. Various capture modes available and ability for the product to work with custom/third party proprietary stuff puts indicator combine in a whoooole new league in comparison to other utility products in a market.

As mentioned in automator review, indicator combine and automator especially reminds me of a product on ninjatrader side known as shark indicators bloodhound.

I'd say runwisefx producs similarly to tick data suite elevating capabilities of mt4 platform to a whole new level and substantially increasing mt4 potency . Taking different indicators "vanilla" and proprietary and morphing/combining them in variety of ways is absolutely supreme!!!

Let say you have 5 of your favorite indicators. cci, rsi, proprietary1, proprietary2, proprietary3 and let say you have a chart where you check for harmonic patterns or gann or astro, or eliott cycles or some similar way of generating a setup for a trade and using these 5 indicators as a trigger (an example).

Instead of having 5 indicators taking precious space on a chart you can merge them into 1 indicator which takes tiny space on a chart however provides highly compressed, *logistically dense*, valuable information on a chart which is combination of these 5 indicators.

After realizing the idea behind a product and what runwisefix did, pulled the plug on a purchase with "my eyes closed".

Also overall i believe prices on runwisefx products are complete bargain which just reinforces my belief people have to do the homework on mt4 market products very very carefully as indicators/eas most certainly not created equally and you may have 150$ product packing waaay more capabilities than let say 5000$ product etc.

Not saying runwisefix should increase the price haha however I.. I could see purchasing combine/matrix/automator product even if they costed 500$. The amount of brain power behind them is simply astounding.

3 flagship runwisefx products in my book unequivocally #1 utility products for mt4. If you use mt4, have tons of indicators and tons of eas it is my sincere belief you must have indicator combine, indicator matrix and if you would like to take trades off these automator.

Also would like to compliment runwisefx support. At the moment runwise pretty much focused on 3 main heavy hitter products. Matrix/combine and automator. Majority of support and improvement efforts focused on these 3 offers. Benefits are runwise business model is instead of spreading intellectual efforts on let say creating 20 different products with a twist they pretty much have only 3 flagship products hence more time for enhancements and supporting customers.

Support is top notch!

Do not think I or anyone else part of runwisefx cusomter base should expect a reply on weekends however few times Mark and runwisefx team replied to me on a weekends which pretty much blew my mind as I did not expected it at all.

Runwisefx is most certainly on the ball when it comes to supporting their flagship products and i have nothing but great things to mention and have nothing to complain about.

Fairly certain after 1 month (or may be longer) I'll be actively using combine/matrix and automator products for as long as mt4 is alive and supported.

Thank you runwisefx!! ^^

With best regards. Alex.

Yvonne
1049
Yvonne 2017.05.12 18:47 
 

This is a great tool to have if you want to get instant statistics on changes to your strategy. The stats update in real time so you can see, for example, what effect changing from a fixed stop loss to an ATR based stop loss would have on your profit. It can be as simple or as complex as you want to make it. You can use it with custom indicators and the support is excellent. Good for both newbies and pros alike.

리뷰 답변
버전 6.90 2024.05.23
- Added new option in CONFIG | Options to only show arrows in the indicator window
버전 6.9 2023.07.29
- Added Max Bars box to CONFIG | Indicators, so can set how many bars/candles an indicator can provide a buy/sell signal. Can be used to ensure signal is close to when indicator changes direction.
버전 6.8 2022.05.12
- Fixed issue where not allowing functionality to be incorporated into Ultimate Trade Manager EA
버전 6.7 2021.07.08
- Fixed issue with previous simulated trades being left on chart

- Corrected default supplied configuration which had Capture Mode incorrectly set for ADX capture

- Fixed issue with 'Revert' text not being show on Refresh/Revert button
버전 6.6 2021.06.23
- Added support for our Ultimate Trade Manager EA, which allows trades to auto open/closed, rather than just alerts, plus adds auto optimization
버전 6.5 2021.03.07
- Fixed issue with previous version when indicators were captured with out Period box set to 0

- Fixed minor issue of panel not being deleted when Indictor Combine is removed from the chart
버전 6.4 2021.02.21
- Fixed issue with previous version where new arrows sometimes didn't appear and also could have got a critical error

- Added new built-in indicator for 3 moving averages crossing each other - F:MovingAverage3Cross (available to select in CONFIG | Indicators | Indicator Name selection list)
버전 6.1 2021.02.09
- Added two output buffers (7 buy and 8 sell) to display arrows when confirmed entry signal happens. This can be used by products that need to see arrows to take action. Set input Main_showArrowOnConfirmedEntry to false to turn new feature off.
버전 6.0 2020.12.26
- Add Color Index Tool that helps to configure indicators
버전 5.2 2019.12.27
- Fixed issue where BO bars couldn't be saved on per symbol/period basis
버전 5.1 2019.08.18
- Added support for looking at value achieved on CrossBuySell capture. Set Mid Point to value needs to be over.
버전 5.0 2019.08.10
- Added new capture mode OnCross for when indicator crosses certain value
버전 4.9 2019.01.12
- Added support for setting properties of the Heiken Ashi Smoothed Alert indicator
버전 4.8 2019.01.03
- Fixed issue with 'YesAndAtStart' mode where wouldn't work properly under certain circumstances
버전 4.7 2019.01.02
- Added work-around for when timer cannot be allocated due to MetaTrader being low on resources
버전 4.5 2018.12.10
- Fixed divide by zero error that could happen under certain circumstances

- Improved support for Price Action Real Power indicator, so that visualization could be turned off via inputs
버전 4.4 2018.10.21
- Added support for moving average crossing high and low moving average
버전 4.3 2018.09.29
- Added input Indi_checkErrorReturnFromICustom which can be set to true if you get an alert "can't find/initialise custom indicator...", but is actually fine. This can happen with certain indicators that are slow to initialise.
버전 4.2 2018.06.26
- Added compatibility with Awesome Oscillator indicator
버전 4.1 2018.06.18
- Fixed issue where excessive message logging in the Experts log could happen if using stop loss calculation method Custom Indicator
버전 4.0 2018.06.05
- Fixed issue where configuration could not be set on a per symbol/period basis

- Improved compatibility with indicators that draw colored objects on the chart, where the color represents the buy/sell indication
버전 3.4 2018.04.18
- Added support for indicators that use object colors to signify buy/sell.
버전 3.3 2018.03.27
- Improved compatibility with Tipu MACD indicator and MACD cross
버전 3.2 2018.02.27
- Improved support for indicator TFX_Directriz
버전 3.1 2017.12.25
- Fixed issue with Bollinger Band reversal not working
버전 3.0 2017.11.20
- Added support for indicators that display trend lines

- Added support for indicators that work on currencies rather than currency pairs

- Added support for indicators crossing other indicators
버전 2.9 2017.10.05
- Fixed bug when calculating combined indicator value when 'Essential for Trade' option set to 'Yes And At Start' for the sell direction
버전 2.8 2017.09.28
- Fixed issue with double alert/notification occurring under certain circumstances
버전 2.7 2017.09.19
- Fixed accuracy of statistics calculation with regard to spread when using Strategy Tester
버전 2.6 2017.09.13
- Fixed take profit calculation when using Median Renko charts
버전 2.5 2017.08.30
- Improved accuracy of shown statistics when using Median Renko charts
버전 2.4 2017.08.23
- Added support for indicators that display arrow objects on the chart
버전 2.3 2017.08.01
- Improved support for Price Action Strength Indicator custom indicator
버전 2.2 2017.06.21
- Added ability to handle price crossing indicator value

- Added ability to specify increment/decrement amount
버전 2.1 2017.05.15
- Fixed possible divide by zero error when Default Alert in General Settings is set to 'auto on win ratio' and there have been no trades found
버전 2.0 2017.05.05
- Added DeMarker and MFI as built-in indicators that can be added to the combination

- Added ability to include indicator where value is below set value
버전 1.8 2017.04.19
- Fixed issue setting Default Alert to confirmed in General Settings pop-up

- Fixed issue capturing different periods when interested in live candle value
버전 1.6 2017.04.04
- Fixed processing of indicators showing a point/arrow at the beginning of a move/trend

- Added "Delete All" button in the indicator setup window (confirmation will be required)

- Better convenience in the demo mode when run in the strategy tester

- Better profit value formatting - now profit is displayed with M or K where needed

- The default value of Main_statsBarsToCalcBack was changed to avoid hanging of charts with a large number of bars

- Added Stochastic

- Added support for over bought and over sold indicators