Target Geometry
- 지표
- Chantal Sala
- 버전: 2.5
- 업데이트됨: 11 5월 2022
- 활성화: 10
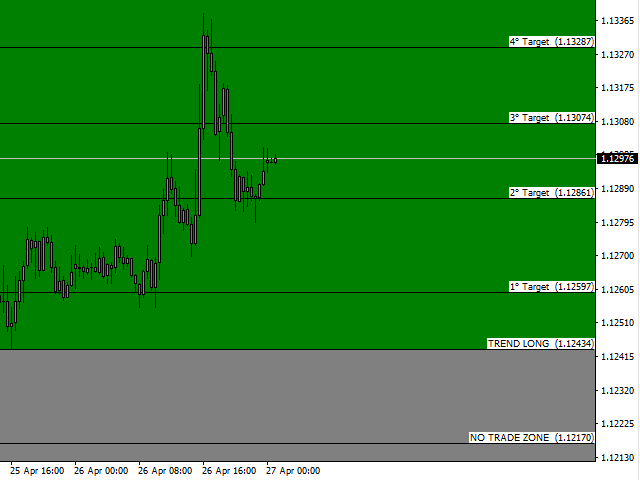
Target Geometry is a next-generation indicator that uses the geometric nature of the markets to give high statistical probability levels (Fibonacci).
This indicator creates a very important map that optimizes the entry points and it optimally defines your own money management.
The indicator can be used both in static mode or in dynamic mode, you can use it on any financial instrument.
The use in multi timeframe mode is a very good ally to have.
The target levels are high statistical probability, therefore we recommend to use extreme caution.
This indicator will give you a new perspective and it suggests you a decision on the market.
We are very happy to have created this indicator and we hope it will be useful to all.
Input Values:
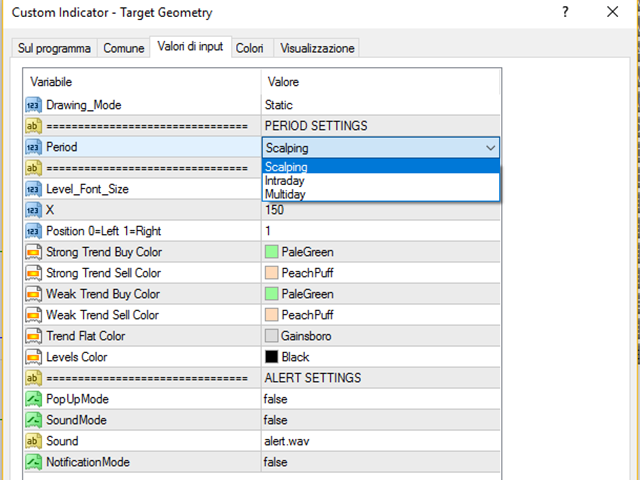
- MODE SETTINGS
- Scalping (for use in low timeframes)
- Intraday (for use in middle timeframes)
- Multiday (for use in high timeframes)
- Shift (period)
- LEVEL SETTINGS
- TRADE ZONE color: NO TRADE, LONG, SHORT
- Levels Color for each zone
- line width for each zone
- Style of line for each zone













good indicator so far