LineSyncMirrorCharts
- 지표
- Vitaly Muzichenko
- 버전: 16.11
- 업데이트됨: 19 6월 2020
- 활성화: 10
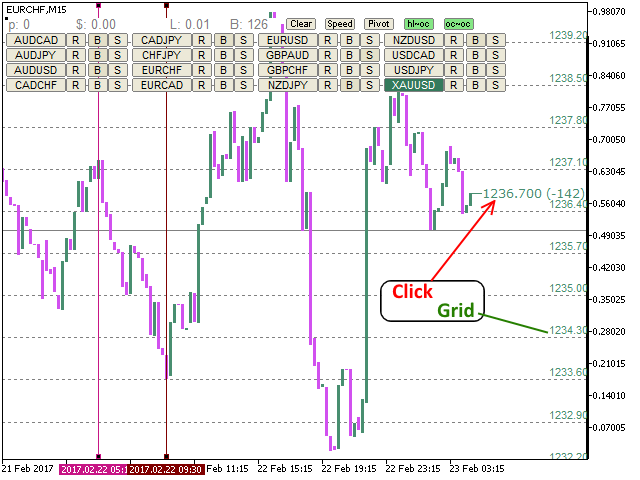
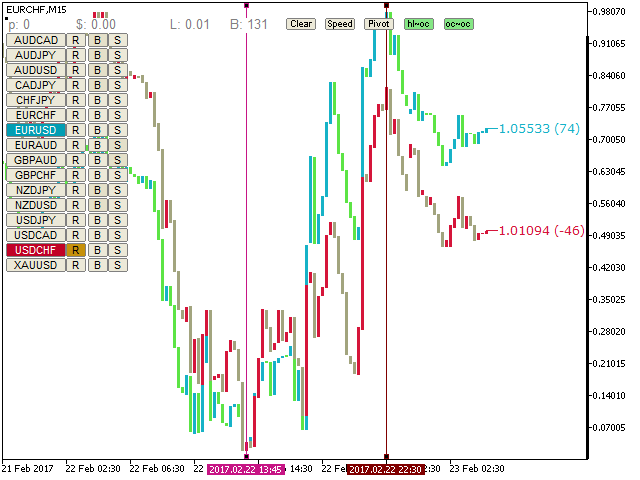
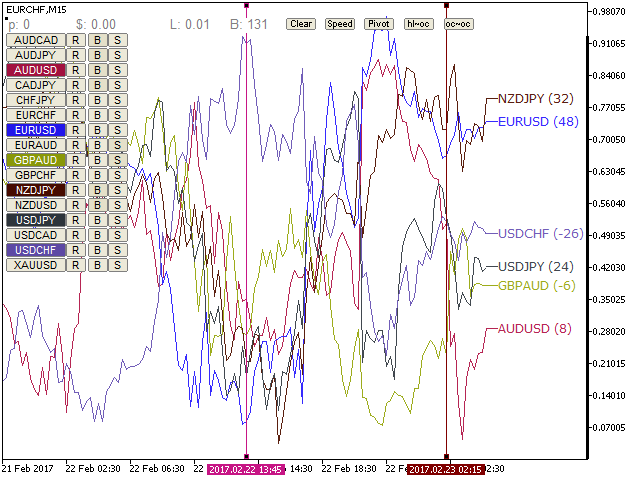
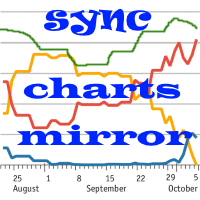
Indicator of correlation and divergence of currency pairs - all pairs on one price chart. It shows all pair that are open in the terminal. Full synchronization of all charts.
Does not work in the tester!
Advantages
Traders who use multicurrency trading strategies can visually observe the price movement of selected pairs on a single price chart in order to compare the parameters of their movement. This is an advanced and extended version of the OverLay Chart indicator
It is quite effective assistant for multicurrency trading - "paired trading" and "portfolio trading". It helps identify the emerging movements in advance.
The method consists of two strategies. The first one is designed to search for divergences between the currency pairs after a release of high-impact news or at the time the trading floors open. The logic of such operation is extremely simple. It is based on the assumption that once the "storm" in the market subsides, the delta between the price of instruments will begin to converge. It is recommended to pay attention to strong support and resistance levels, in order to avoid buying right under a strong resistance and selling at the very bottom.
Identification of false breakouts of the support/resistance levels.
Features
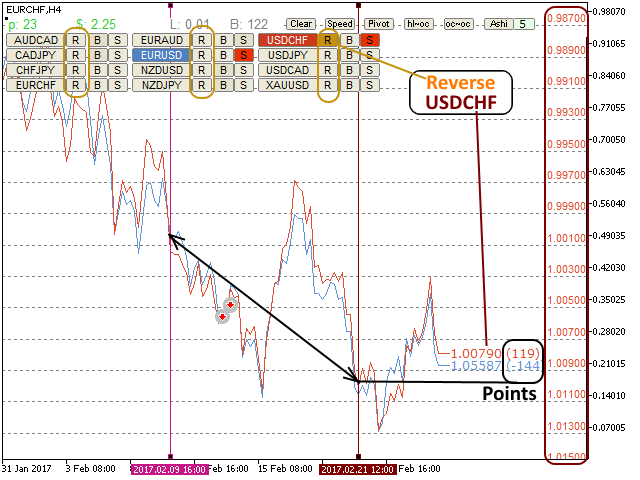
- Invert any pair on the chart
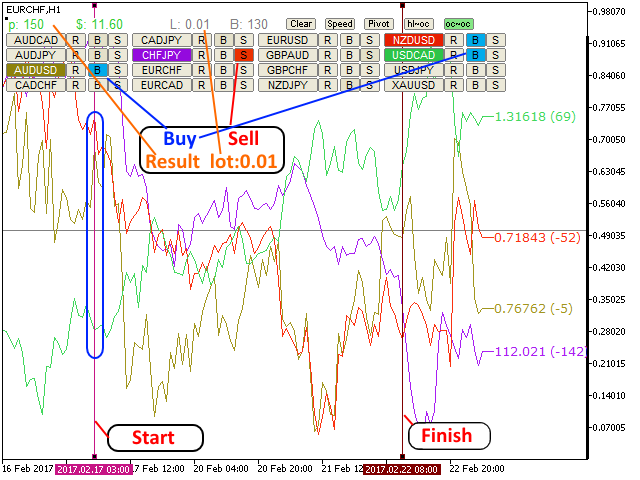
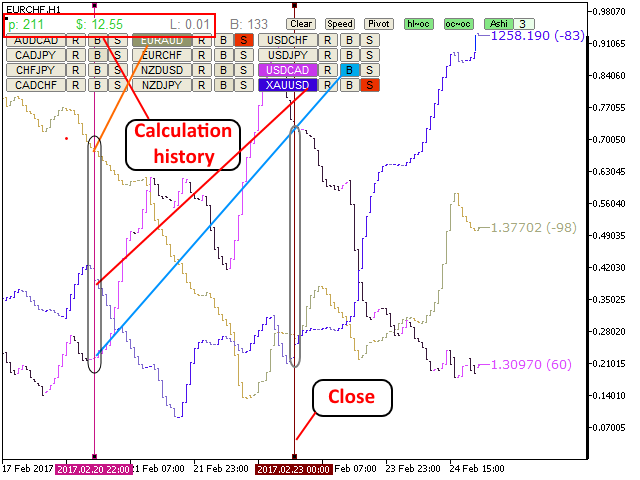
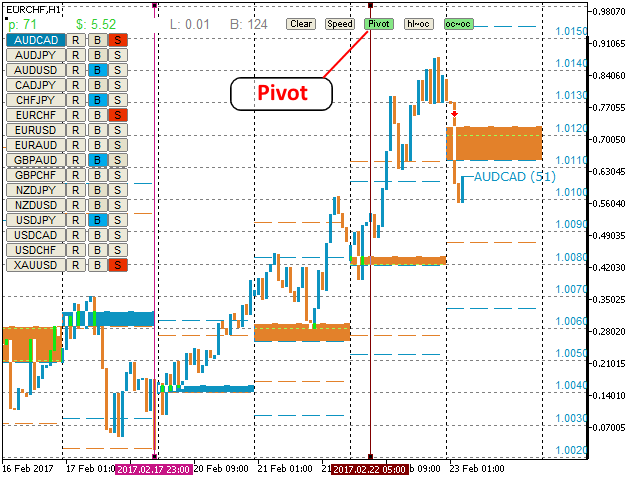
- Identify the regularities in history in the form of virtual buys or sells of multiple pairs
- Calculates the distance in points the price had passed on the selected interval
- Visually determine the strength of the currency movement
- Select different display color for each currency pair
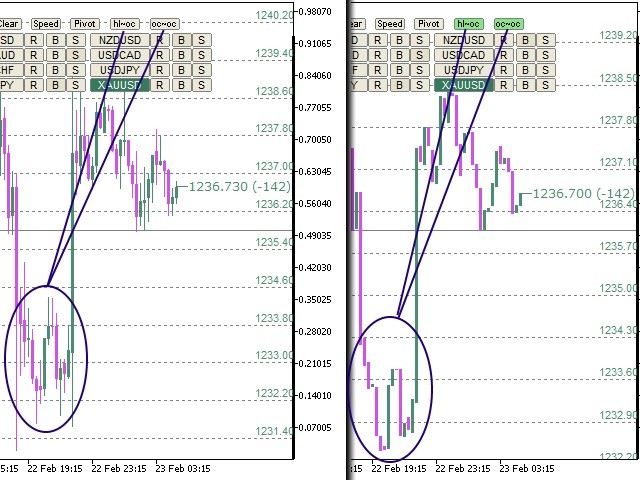
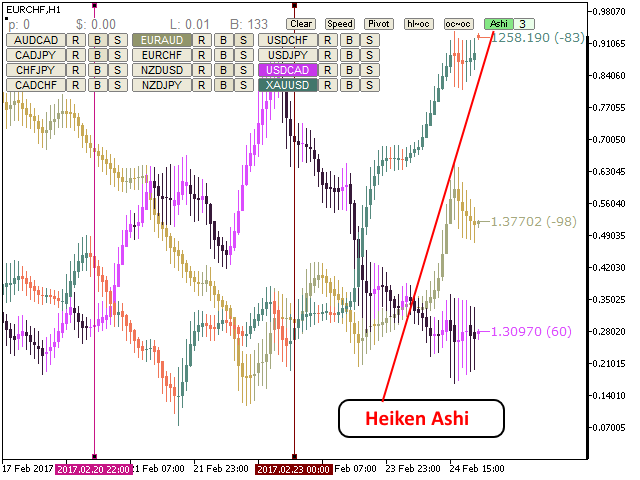
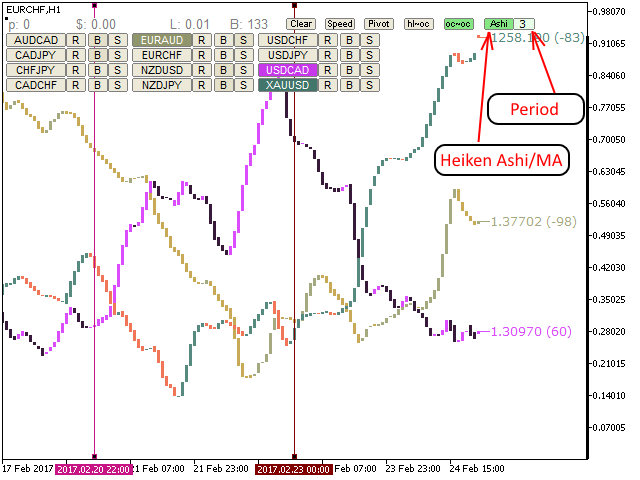
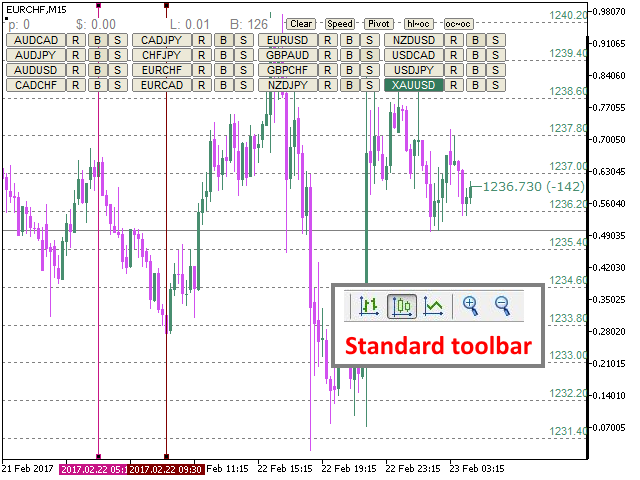
- Display style: Bars, Candles, Lines, Heiken Ashi
- Synchronization of timeframes and scrolling of all charts
- Ability to trade any pair on one main chart
- Alert when exceeding the price change in "Points" per "Time"
It can be conveniently used in conjunction with the "CorrelatePairs" indicator
Warning
The indicator should be placed on one chart!
Does not work in the tester!
See the video for more details
The EA used in the video is attached in the Comments section (attach to one chart only!)
