Reliable Step
- 지표
- Gevorg Hakobyan
- 버전: 1.2
- 업데이트됨: 8 4월 2020
- 활성화: 10
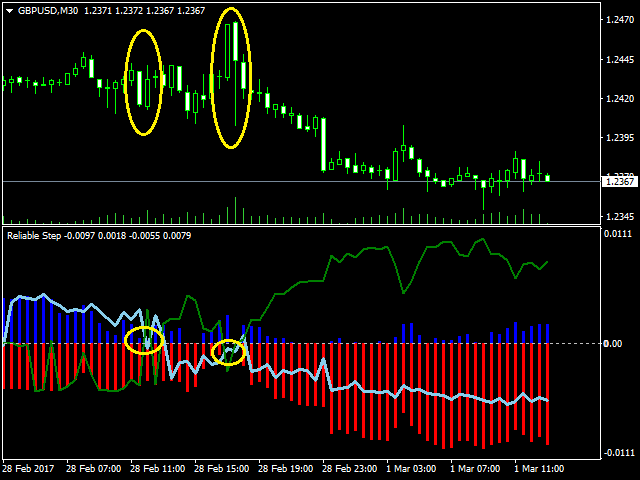
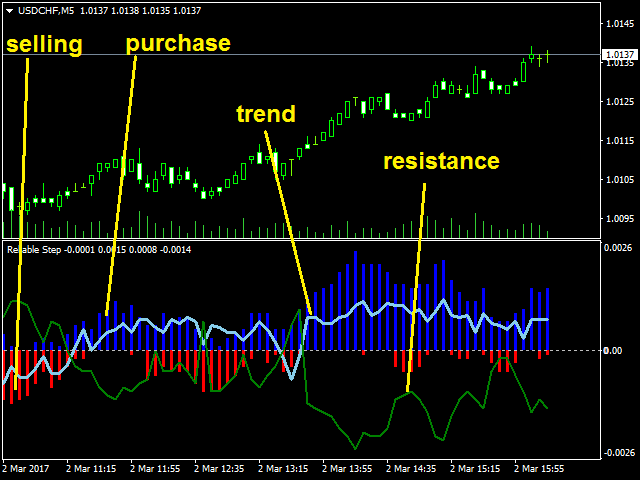
It would be good to always be aware of the "struggle" between buyers and sellers. Then it would be much easier to determine the best direction to go in order not to lose out. This indicator offers an original solution to this problem: the supply and demand values are compared with the High and Low prices for the selected period, thus trying to determine the market movement towards the stronger side without ignoring the strength of the opposite side. All this is displayed in a separate window using the four indicators. Blue histogram shows the strength of the uptrend, red - downtrend. The first line shows the market movement, and the second green line shows the resistance level, exceeding which is a sign of change in market direction.
How to use the indicator?
- First, it is necessary to understand how to determine the best time for entering: this is when the lines intersect. Sell signal: when the trend line crosses the resistance line downwards, and the greater the line values at the moment of intersection, the stronger the signal. Buy signal: when an opposite intersection occurs, it is stronger when the line values are below zero. The only way filter to reduce the false or short-term signals is to choose a large period value for the indicator.
- Second, it is necessary to understand when to exit the market or to secure profit: this is when the histogram does not exceed the trend line (blue histogram for an uptrend, red histogram for a downtrend).
- Now you can wait for a reversal. Reversal signal: when the resistance line is exceeded by the histogram (red histogram in an uptrend, blue histogram in a downtrend).
Input Parameter
- period - the number of bars for indicator calculations. (Minimum value is 2).
To summarize
- blue histogram - "the power of buyers",
- red bar chart - "the power of sellers",
- trend line - "the tendency of the market",
- resistance line - "level of market resistance power".
For a successful trading with the indicator, select a large period and analyze all four indications.
Successful profits to you!


It's a great tool. Is perfect for evaluating strenght of buyers and sellers. I use it for scalping. For more confident entry and exit. Congrats!