Linear Regression Global
- 지표
- Igor Semyonov
- 버전: 1.22
- 업데이트됨: 24 7월 2024
- 활성화: 7
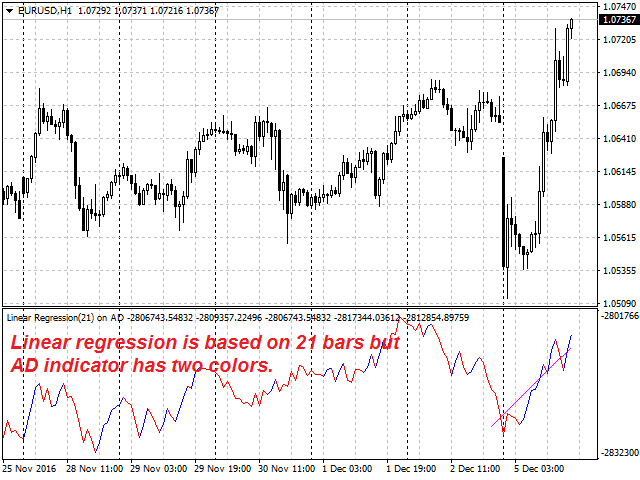
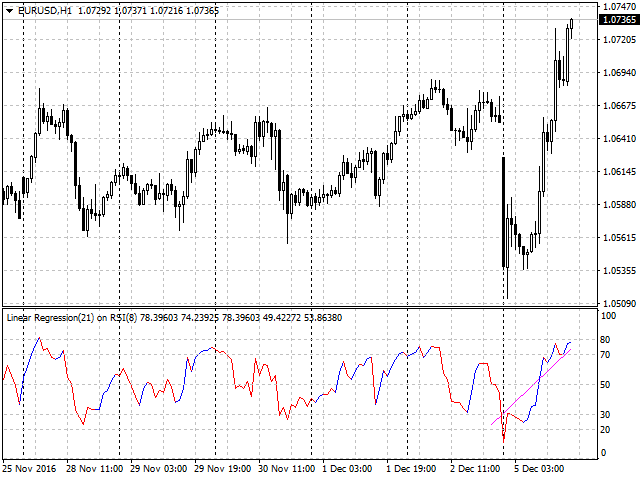
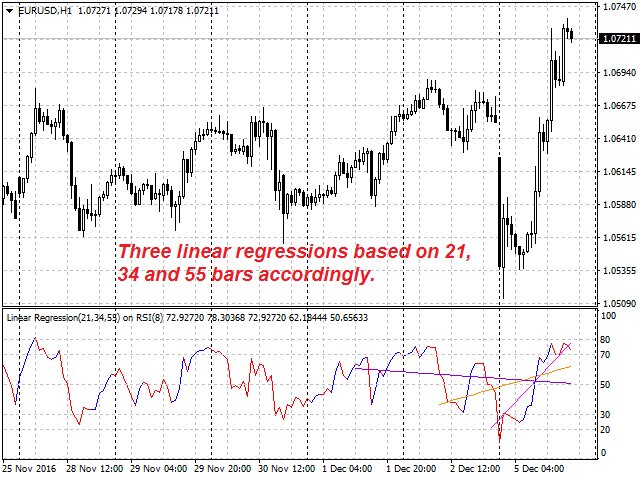
This is the linear regression indicator for basic indicators included in the standard package of the MetaTrader 4 terminal. It is used for the analysis of price movements and market mood.
The market mood is judged by the slope of the linear regression and price being below or above this line. Regression line breakthrough by the indicator line may serve as a market entry signal.
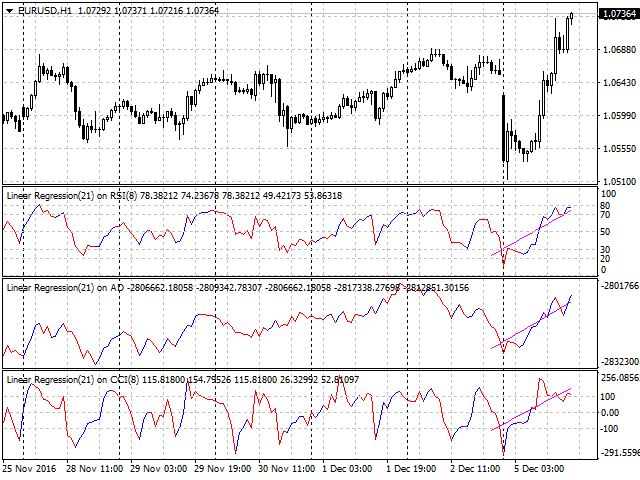
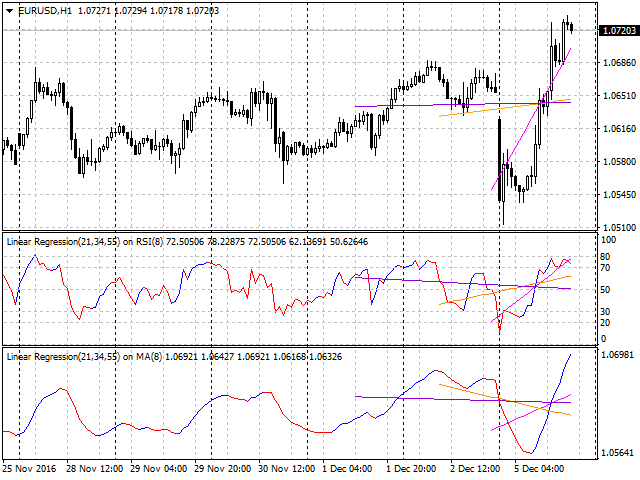
There is possibility of setting the color for bullish and bearish sentiments of the basic indicators as well as plotting three regression lines with different periods.
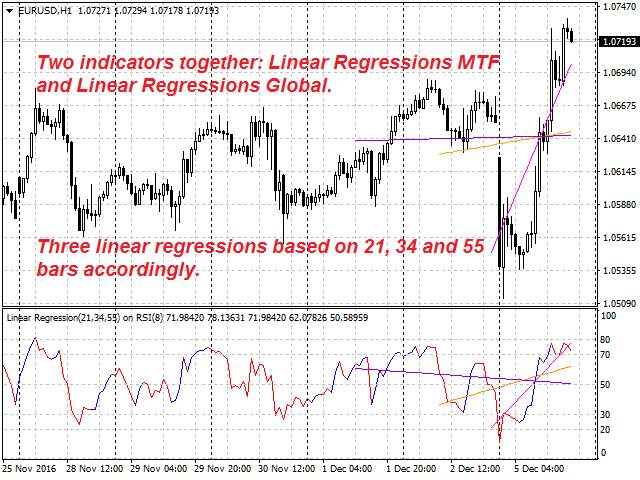
The indicator can be used in combination with Linear Regression MTF, Strongest Level, Fibo Levels or others.
Possible application methods are shown on the screenshots and video.
Purpose
The indicator can be used for manual or automated trading as part of an Expert Advisor. Values of indicator buffer of the double type can be used for automated trading:
- The main line of the basic indicator - buffer 0.
- Regression line 1 - buffer 1.
- The bullish sentiment of the basic indicator - buffer 2.
- The bearish sentiment of the basic indicator - buffer 3.
- The signal line of ADX or RVI basic indicator - buffer 4.
- Regression line 2 - buffer 5.
- Regression line 3 - buffer 6.
Values of the basic indicator's buffers for the main and/or signal line should not be equal to EMPTY_VALUE.
Values of the linear regression buffers should not be equal to zero.
Inputs
- Basic Indicator - basic indicator type:
- AD.
- OBV.
- FORCE.
- MFI.
- ATR.
- MOMENTUM.
- RSI.
- CCI.
- RVI.
- ADX.
- DeMARKER.
- StdDev.
- MA.
- Bars Number 1 - number of bars to calculate the regression line 1.
- Bars Number 2 - number of bars to calculate the regression line 2.
- Bars Number 3 - number of bars to calculate the regression line 3.
- Period - basic indicator calculation period.
- MA Method - moving average smoothing method.
- Applied Price - applied price type.
- Shift - shift of the basic indicator relative to the price chart.
- Colored Lines - color bullish and bearish sentiments of the main indicator:
- true - yes.
- false - no.
- Regression 2 - calculate the regression line 2:
- true - yes.
- false - no.
- Regression 3 - calculate the regression line 3:
- true - yes.
- false - no.
