• 미리보기
  • 리뷰
  • 코멘트 (2)
  • 새 소식

Seconds Bars

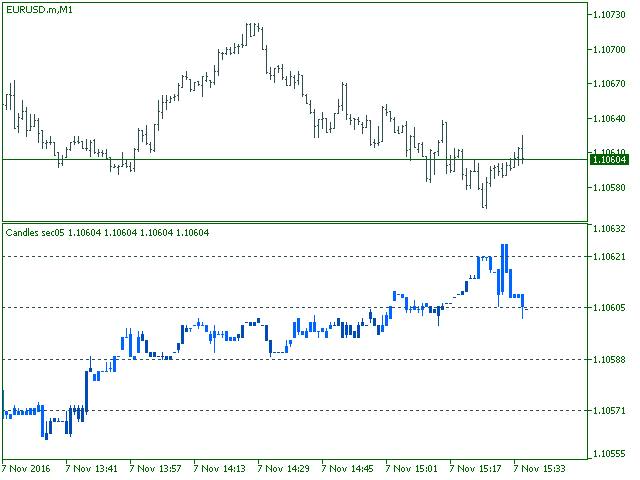
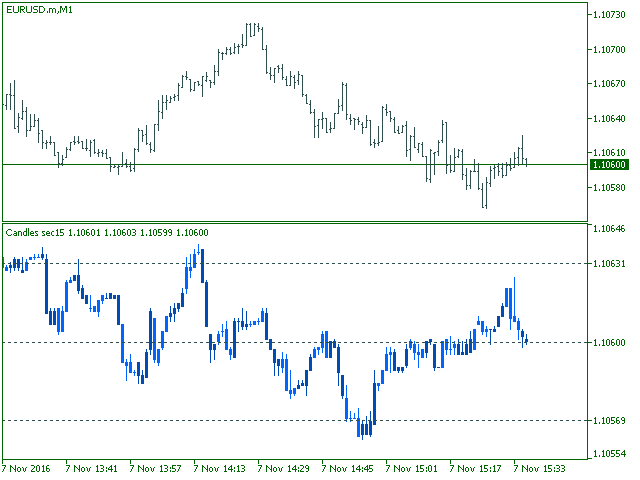
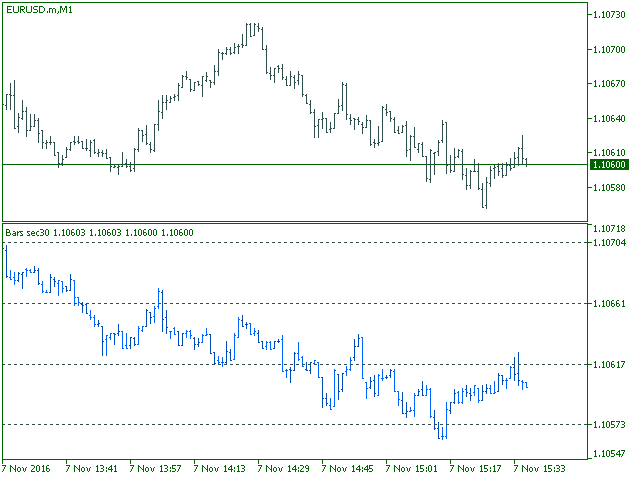
The indicator displays in a separate window a price chart as bars or Japanese candlesticks with a periodicity below a minute.

Available periods (seconds): 30, 20, 15, 12, 10, 6, 5, 4, 3, 2, 1.

The display mode (bars or candlesticks) is switched by clicking on the chart.


Parameters

  • Period in seconds - the period of bars in seconds
  • Price levels count - the number of price levels on a chart

Buffer number: 0 - Open, 1 - High, 2 - Low, 3 - Close, 4 - Color.

추천 제품
Noize Absorption Index
Ekaterina Saltykova
Noize Absorption Index - is the manual trading system that measures the difference of pressure between bears forces and bulls forces. Green line - is a noize free index that showing curent situation. Zero value of index shows totally choppy/flat market.Values above zero level shows how powerfull bullish wave is and values below zero measures bearish forces.Up arrow appears on bearish market when it's ready to reverse, dn arrow appears on weak bullish market, as a result of reverse expectation.
US30NinjaMT5
Satyaseelan Shankarananda Moodley
US30 Ninja is a 5 minute scalping indicator that will let know you when there is a trade set up (buy or sell). Once the indicator gives the trade direction, you can open a trade and use a 30 pip stop loss and a 30 pip to 50 pip take profit. Please trade at own own risk. This indicator has been created solely for the US30 market and may not yield positive results on any other pair. 
Premium level Pro
Dmitriy Kashevich
Premium level is a unique indicator with more than 80% accuracy of correct predictions! This indicator has been tested for more than two months by the best Trading Specialists! The author's indicator you will not find anywhere else! From the screenshots you can see for yourself the accuracy of this tool! 1 is great for trading binary options with an expiration time of 1 candle. 2 works on all currency pairs, stocks, commodities, cryptocurrencies Instructions: As soon as the red arrow app
Owl Smart Levels MT5
Sergey Ermolov
4.07 (28)
MT4 버전  |  FAQ Owl Smart Levels Indicator 는 Bill Williams 의 고급 프랙탈, 시장의 올바른 파동 구조를 구축하는 Valable ZigZag, 정확한 진입 수준을 표시하는 피보나치 수준과 같은 인기 있는 시장 분석 도구를 포함하는 하나의 지표 내에서 완전한 거래 시스템입니다. 시장과 이익을 취하는 장소로. 전략에 대한 자세한 설명 표시기 작업에 대한 지침 고문-거래 올빼미 도우미의 조수 개인 사용자 채팅 ->구입 후 나에게 쓰기,나는 개인 채팅에 당신을 추가하고 거기에 모든 보너스를 다운로드 할 수 있습니다 힘은 단순함에 있습니다! Owl Smart Levels 거래 시스템은 사용하기 매우 쉽기 때문에 전문가와 이제 막 시장을 연구하고 스스로 거래 전략을 선택하기 시작한 사람들 모두에게 적합합니다. 전략 및 지표에는 눈에 보이지 않는 비밀 공식 및 계산 방법이 없으며 모든 전략 지표는 공개되어 있습니다. Owl Smart Levels를 사
Mine Farm
Maryna Kauzova
Mine Farm is one of the most classic and time-tested scalping strategies based on the breakdown of strong price levels. Mine Farm is the author's modification of the system for determining entry and exit points into the market... Mine Farm - is the combination of great potential with reliability and safety. Why Mine Farm?! - each order has a short dynamic Stop Loss - the advisor does not use any risky methods (averaging, martingale, grid, locking, etc.) - the advisor tries to get the most
PZ Penta O MT5
PZ TRADING SLU
The Penta-O is a 6-point retracement harmonacci pattern which usually precedes big market movements. Penta-O patterns can expand and repaint quite a bit. To make things easier this indicator implements a twist: it waits for a donchian breakout in the right direction before signaling the trade. The end result is an otherwise repainting indicator with a very reliable trading signal. The donchian breakout period is entered as an input. [ Installation Guide | Update Guide | Troubleshooting | FAQ | A
Volality Index Scalper
Lesedi Oliver Seilane
5 (1)
Volality Index scalper indicator  Meant for Volality pairs such as Volality 10, 25, 50, 75 and 100 The indicator works on all timeframes from the 1 minute to the monthly timeframe the indicator is non repaint the indicator has 3 entry settings 1 color change on zero cross 2 color change on slope change 3 color change on signal line cross Orange line is your sell signal Blue line is your buy signal.
Stratos Pali mt5
Michela Russo
5 (4)
Stratos Pali Indicator is a revolutionary tool designed to enhance your trading strategy by accurately identifying market trends. This sophisticated indicator uses a unique algorithm to generate a complete histogram, which records when the trend is Long or Short. When a trend reversal occurs, an arrow appears, indicating the new direction of the trend. Important Information Revealed Leave a review and contact me via mql5 message to receive My Top 5 set files for Stratos Pali at no cost ! Down
Flow Bookmap
Thalles Nascimento De Carvalho
Flow Bookmap: 시장 흐름을 시각화하고 거래를 보호하세요 ️ 매수자와 매도자에 대한 정확한 정보로 시장을 지배하고 싶으신가요? Flow Bookmap은 시장의 행동을 깊이 이해하고자 하는 트레이더를 위한 궁극적인 도구입니다. 이 도구는 주문 흐름 데이터를 MT5 차트의 직관적인 인터페이스로 변환하여, 빠르고 안전한 결정을 내리기 위해 중요한 관심 영역을 강조합니다. 작동 원리 Flow Bookmap은 시장에서 매수자와 매도자 간의 상호작용을 해석하고, 중요한 불균형(imbalances)을 강조합니다: 매수자가 우세할 때, 가격은 떨어지는 경향이 있습니다. 이는 매도자가 가격을 조정할 유리한 조건을 찾기 때문입니다. 매도자가 우세할 때, 가격은 상승하는 경향이 있습니다. 이는 동일한 균형 논리의 반대 결과입니다. 또한, 지표는 실시간 데이터를 수집하면서 차트에 정보를 바로 플로팅하여 히스토리를 생성합니다. 즉, 지표는 계산이 완료될 때마다 불균형 구역과 매수
Blahtech Market Profile MT5
Blahtech Limited
5 (10)
Was: $249  Now: $149   Market Profile defines a number of day types that can help the trader to determine market behaviour. A key feature is the Value Area, representing the range of price action where 70% of trading took place. Understanding the Value Area can give traders valuable insight into market direction and establish the higher odds trade. It is an excellent addition to any system you may be using. Inspired by Jim Dalton’s book “Mind Over Markets”, this indicator is designed to suit the
HMA Trend Professional MT5
Pavel Zamoshnikov
4.25 (4)
Improved version of the free HMA Trend indicator (for MetaTrader 4) with statistical analysis. HMA Trend is a trend indicator based on the Hull Moving Average (HMA) with two periods. HMA with a slow period identifies the trend, while HMA with a fast period determines the short-term movements and signals in the trend direction. The main differences from the free version: Ability to predict the probability of a trend reversal using analysis of history data. Plotting statistical charts for analyzi
Your Trend Friend
Luigi Nunes Labigalini
5 (1)
The trend is your friend! Look at the color of the indicator and trade on that direction. It does not  repaint. After each candle is closed, that's the color of the trend. You can focus on shorter faster trends or major trends, just test what's most suitable for the symbol and timeframe you trade. Simply change the "Length" parameter and the indicator will automatically adapt. You can also change the color, thickness and style of the lines. Download and give it a try! There are big movements w
To get access to MT4 version please click here . - This is the exact conversion from TradingView: "Stochastic Momentum Index" By "UCSgears". - This is a popular version of stochastic oscillator on tradingview. - This is a light-load processing and non-repaint indicator. - Buffers are available for the lines on chart. - You can message in private chat for further changes you need. Thanks for downloading
DYJ BoS
Daying Cao
DYJ BoS 지표는 다음을 포함하여 시장 구조 변화의 필수 요소를 자동으로 식별하고 표시합니다. 구조 돌파(BoS): 가격이 크게 움직여 이전 구조 지점을 돌파할 때 감지됩니다. 상승 추세선과 하락 추세선(UP & DN, 즉 연속적인 신고가와 신저가)을 표시하고, 가격이 이러한 선을 돌파하면 빨간색(BEAR)과 초록색(BULL) 화살표를 표시합니다. BoS는 일반적으로 가격이 이전 가격 움직임에 의해 확립된 스윙 저점이나 스윙 고점을 확실히 통과할 때 발생합니다. 가격이 스윙 하이보다 높거나 스윙 로우보다 낮게 움직일 경우, 이는 단순히 이전에 형성된 시장 구조를 깨는 것이므로 "브레이크아웃" 구조라고 합니다. 이는 종종 시장 심리와 추세 방향의 변화를 나타내며, 기존 추세가 지속되거나 새로운 추세가 시작됨을 알립니다. 일반적으로 마감 정확도를 높이기 위해 손절매와 이익실현을 설정하지 않는 것이 좋습니다. 최종 포지션은 일반적으로 같은 방향의 다음 돌파점에서 마감되거나 반
Welcome to the Ultimate Harmonic Patterns recognition indicator that is focused to detect advanced patterns. The Gartley pattern, Bat pattern, and Cypher pattern  are popular technical analysis tools used by traders to identify potential reversal points in the market. Our Ultimate Harmonic Patterns recognition Indicator is a powerful tool that uses advanced algorithms to scan the markets and identify these patterns in real-time. With our Ultimate Harmonic Patterns recognition Indicator, you ca
Trading Utility for Forex Currency Pairs Only not for Gold  Functions Auto Lot Calculation based on Risk Auto stoploss  Auto TakeProfit Breakeven Auto Close Half % Close in percentage with respect to the PIPs Pending Orders BuyLimit Sell Limit with distances BuyStop Sell Stop    with distances Trading Informations Risk in percentage For Multiple trades Combine Takeprofit and Combine Stoplosses
This indicator presents an alternative approach to identify Market Structure. The logic used is derived from learning material created by   DaveTeaches (on X) Upgrade v1.10: + add option to put protected high/low value to buffer (figure 11, 12) + add  Retracements  value to buffer when Show Retracements When quantifying Market Structure, it is common to use fractal highs and lows to identify "significant" swing pivots. When price closes through these pivots, we may identify a Market Structure S
No Demand No Supply MT5
Trade The Volume Waves Single Member P.C.
No Demand No Supply   This indicator identifies   No Demand –No Supply candles to your chart and plots volume bars colored according to the signal. It can be applied to all timeframes or to a specific one only. It can also be used as regular volume indicator  with exceptional future of WEIGHTED VOLUME. Furthermore is has an alert notification, sound and email when a signals occurs. The indicator does not repaint but the alert will come on two candles back due to the definition of No Demand No Su
PZ Fibonacci MT5
PZ TRADING SLU
5 (1)
Are you tired of plotting Fibonacci retracements or extensions manually? This indicator displays Fibo retracements or extensions automatically, calculated from two different price points, without human intervention or manual object anchoring. [ Installation Guide | Update Guide | Troubleshooting | FAQ | All Products ] Easy to use Manual anchoring is not needed Perfect for price confluence studies The indicator evaluates if retracements or extensions are needed Once drawn, you can manually edit t
숫자 시퀀스 중 하나를 "산불 시퀀스"라고 합니다. 가장 아름다운 새로운 시퀀스 중 하나로 인식되었습니다. 주요 특징은 이 시퀀스가 ​​가장 짧은 경우에도 선형 추세를 피한다는 것입니다. 이 지표의 기초를 형성한 것은 이 속성입니다. 금융 시계열을 분석할 때 이 지표는 가능한 모든 추세 옵션을 거부하려고 합니다. 그리고 그가 실패하는 경우에만 그는 추세의 존재를 인식하고 적절한 신호를 제공합니다. 이 접근 방식을 통해 새로운 트렌드가 시작되는 순간을 정확하게 결정할 수 있습니다. 그러나 거짓 긍정도 가능합니다. 숫자를 줄이기 위해 이 표시기에 추가 필터가 추가되었습니다. 새 막대가 열리면 신호가 생성됩니다. 어떤 경우에도 다시 그리기가 발생하지 않습니다. 표시 매개변수: Applied Price   - 적용된 가격 상수. Period Main   - 표시기의 기본 기간, 유효한 값은 5 - 60 이내입니다. Period Additional   - 추가 기간, 이 매개변수의 유효한
An indicator of pattern #31 ("Long Island") from Encyclopedia of Chart Patterns by Thomas N. Bulkowski. The second gap is in the opposite direction. Parameters: Alerts - show alert when an arrow appears   Push - send a push notification when an arrow appears (requires configuration in the terminal) GapSize - minimum gap size in points ArrowType - a symbol from 1 to 17 ArrowVShift - vertical shift of arrows in points   ShowLevels - show levels ColUp - color of an upward line ColDn - color of a d
Super Trend Trading View 5
Mohammad Taher Halimi Tabrizi
The SuperTrend indicator is a popular technical analysis tool used by traders and investors to identify trends in the price of a financial instrument, such as a stock, currency pair, or commodity. It is primarily used in chart analysis to help traders make decisions about entering or exiting positions in the market. this version of super trend indicator is exactly converted from trading view to be used in MT5
우리의   Basic Support and Resistance   표시기는 기술 분석을 향상시키는 데 필요한 솔루션입니다.이 표시기는 차트/ MT4 버전 특징 피보나치 수준의 통합 : 지원 및 저항 수준과 함께 피보나치 수준을 표시하는 옵션과 함께, 우리의 지표는 시장 행동과 가능한 역전 영역에 대한 더 깊은 통찰력을 제공합니다. 성능 최적화 : 각 막대의 개구부에서만 확장 라인을 업데이트하는 옵션을 사용하여, 우리의 지표는 지원 및 저항 수준의 정확도를 희생하지 않고 최적의 성능을 보장합니다. 입력 주요 설정 Timeframe:  이 입력을 통해 차트에 더 높은 기간의 지지선과 저항선을 표시하도록 선택할 수 있습니다. Support/Resistance Strength [Number of Bars]:   이 입력을 사용하면 지지대와 저항의 강도를 결정할 수 있습니다.숫자가 높을수록지지/저항이 더 강해집니다. Price mode:  이 매개 변수를 사용하면 지원 및 저항 수준을
This indicator allows you to enjoy the two most popular products for analyzing request volumes and market deals at a favorable price: Actual Depth of Market Chart Actual Tick Footprint Volume Chart This product combines the power of both indicators and is provided as a single file. The functionality of Actual COMBO Depth of Market AND Tick Volume Chart is fully identical to the original indicators. You will enjoy the power of these two products combined into the single super-indicator! Below is
To get access to MT4 version please click here . This is the exact conversion from TradingView: "[SHK] Schaff Trend Cycle (STC)" by "shayankm". This is a light-load processing indicator. This is a non-repaint indicator. Buffers are available for processing in EAs. All input fields are available. You can message in private chat for further changes you need. Thanks for downloading
Crash 1000 Scalping Indicator for the Crash 1000 Deriv Synthetic Index. Introduction The Crash 1000 Scalping Indicator is a specialized tool designed for the Crash 1000 index on the Deriv Synthetic market. This indicator is particularly useful for scalping on the M1 timeframe, helping traders to identify precise entry and exit points for buy positions. It is designed to be non-repainting, providing clear signals with audible alerts and push notifications, and is compatible with mobile devices th
이것은 가격 레이블이 있는 Advanced ZigZag Dynamic   및/또는   Extended Fractals   표시기 극값을 기반으로 하는 지원 및 저항 수준의 MTF 표시기입니다(비활성화 가능). MTF 모드에 대해 더 높은 TF를 선택할 수 있습니다. 기본적으로 레벨은 지그재그 표시 점을 기반으로 생성됩니다. 프랙탈 표시 점은 지그재그와 함께 또는 대신 사용할 수도 있습니다. 사용을 단순화하고 CPU 시간을 절약하기 위해 열릴 때 각 막대당 한 번씩 계산이 수행됩니다. 매개변수: ForcedTF - 레벨 계산을 위한 차트 타임프레임(현재와 같거나 초과할 수 있음) MinPipsLevelWidth - 포인트 단위의 최소 레벨 너비(매우 좁은 레벨에 사용) Use ZigZag Extremums points - 지그재그 피크를 사용하여 지원/저항 수준 계산을 활성화/비활성화합니다. Fixed pips range - 지그재그 표시기를 계산하기 위한 최소값과 최대값 사이의 거리
Laguerre SuperTrend Clouds   adds an Adaptive Laguerre averaging algorithm and alerts to the widely popular SuperTrend indicator. As the name suggests,   Laguerre SuperTrend Clouds (LSC)   is a trending indicator which works best in trendy (not choppy) markets. The SuperTrend is an extremely popular indicator for intraday and daily trading, and can be used on any timeframe. Incorporating Laguerre's equation to this can facilitate more robust trend detection and smoother filters. The LSC uses the
Scanner
Ervand Oganesyan
다중 시간대 및 다중 기호 시장 스캐너. 이 표시기는 선택한 모든 기기 및 기간에 대해 선택한 기술 전략을 테스트하고 몇 분의 1초 안에 스캔 결과를 표시합니다. 사용 사례 지표를 실행하고 거래 시간과 거래 논리를 설정하세요. 대부분의 장비에서 스캔 결과가 수익성이 있는지 확인한 다음 마우스 클릭 한 번으로 원하는 차트로 전환하십시오. 무역 신호가 준비되었습니다. 신호의 주파수가 편안한지 확인하고 필요한 경우 "트리거 감도" 옵션을 사용하여 변경하십시오. 화면 및 전화 알림을 설정합니다. 실시간 거래를 위한 모든 준비가 완료되었습니다. 특징 - 시간과 거래 논리를 사용자 정의할 수 있습니다. 추세 추종, 역추세, 지역 돌파, 평균 회귀 전략 중에서 선택하세요. 아시아, 런던, 뉴욕 세션 중 거래 여부를 설정합니다. - 스캔 결과는 스크롤 가능하고 승리 확률에 따라 정렬 가능하며 클릭하여 스캔된 차트로 전환하고 거래를 구성할 수 있습니다. - 다시 그리지 않고 지연되지 않습니다.
VWAP Trend
Driller Capital Management UG
Welcome dear traders , We are offering a Volume Weighted Average Price (VWAP) indicator for purchase. The indicator is programmed for easy use. Simply drag it onto the chart, and the algorithm takes care of the rest. Based on the selected time period, the volume-weighted average price lines are automatically calculated. Unlike other VWAP indicators, our indicator also allows calculations for shorter timeframes than D1, W1, or MN1. This makes the indicator ideal for intraday trading. In addition
이 제품의 구매자들이 또한 구매함
Trend Screener Pro MT5
STE S.S.COMPANY
4.89 (72)
트렌드 표시기, 트렌드 트레이딩 및 필터링을 위한 획기적인 고유 솔루션, 하나의 도구 안에 내장된 모든 중요한 트렌드 기능! Forex, 상품, 암호 화폐, 지수 및 주식과 같은 모든 기호/도구에 사용할 수 있는 100% 다시 칠하지 않는 다중 시간 프레임 및 다중 통화 표시기입니다. Trend Screener는 차트에 점이 있는 화살표 추세 신호를 제공하는 효율적인 지표 추세 추종 지표입니다. 추세 분석기 표시기에서 사용할 수 있는 기능: 1. 트렌드 스캐너. 2. 최대 이익 분석이 있는 추세선. 3. 추세 통화 강도 측정기. 4. 경고가 있는 추세 반전 점. 5. 경고가 있는 강력한 추세 점. 6. 추세 화살표 Trend Screener Indicator가 있는 일일 분석 예, 일일 신호 성능...등은 여기에서 찾을 수 있습니다. 여기를 클릭하십시오. LIMITED TIME OFFER : Trend Screener Indicator는 50$ 및 평생 동안만 사용할 수 있습니다.
Golden Trend Indicator MT5
Noha Mohamed Fathy Younes Badr
4.86 (14)
Golden Trend indicator  is The best indicator for predicting trend movement this indicator never lags and never repaints and never back paints    and give  arrow buy and sell    before the candle appear  and it will help you and  will make your trading decisions clearer its work on all currencies and  gold and crypto and all time frame This unique  indicator uses very secret algorithms to catch the  trends, so you can trade using this indicator and see the trend clear on charts  manual guide and
FX Volume MT5
Daniel Stein
4.82 (17)
FX Volume: 브로커 시각에서 바라보는 진짜 시장 심리 간단 요약 트레이딩 접근 방식을 한층 더 향상시키고 싶으신가요? FX Volume 는 소매 트레이더와 브로커의 포지션을 실시간으로 파악할 수 있게 해 줍니다. 이는 COT 같은 지연된 보고서보다 훨씬 빠릅니다. 꾸준한 수익을 추구하는 분이든, 시장에서 더 깊은 우위를 원하시는 분이든, FX Volume 을 통해 대규모 불균형을 찾아내고, 돌파 여부를 확인하며 리스크 관리를 정교화할 수 있습니다. 지금 시작해 보세요! 실제 거래량 데이터가 의사결정을 어떻게 혁신할 수 있는지 직접 경험해 보시기 바랍니다. 1. 트레이더에게 FX Volume이 매우 유익한 이유 탁월한 정확도를 지닌 조기 경보 신호 • 다른 사람들보다 훨씬 앞서, 각 통화쌍을 매수·매도하는 트레이더 수를 거의 실시간으로 파악할 수 있습니다. • FX Volume 은 여러 리테일 브로커에서 추출한 실제 거래량 데이터를 종합해 명확하고 편리한 형태로 제공하는
FX Power MT5 NG
Daniel Stein
5 (10)
FX Power: 통화 강세 분석으로 더 스마트한 거래 결정을 개요 FX Power 는 어떤 시장 상황에서도 주요 통화와 금의 실제 강세를 이해하기 위한 필수 도구입니다. 강한 통화를 매수하고 약한 통화를 매도함으로써 FX Power 는 거래 결정을 단순화하고 높은 확률의 기회를 발견합니다. 트렌드를 따르거나 극단적인 델타 값을 사용해 반전을 예측하고자 한다면, 이 도구는 귀하의 거래 스타일에 완벽히 적응합니다. 단순히 거래하지 말고, FX Power 로 더 스마트하게 거래하세요. 1. FX Power가 거래자에게 매우 유용한 이유 통화와 금의 실시간 강세 분석 • FX Power 는 주요 통화와 금의 상대적 강세를 계산하고 표시하여 시장 역학에 대한 명확한 통찰력을 제공합니다. • 어떤 자산이 앞서고 있고 어떤 자산이 뒤처지는지 모니터링하여 보다 현명한 거래 결정을 내릴 수 있습니다. 포괄적인 멀티 타임프레임 뷰 • 단기, 중기 및 장기 타임프레임에서 통화와 금의 강세를
Quantum TrendPulse
Bogdan Ion Puscasu
5 (13)
SuperTrend   ,   RSI   ,   Stochastic   의 힘을 하나의 포괄적인 지표로 결합하여 트레이딩 잠재력을 극대화하는 궁극의 트레이딩 도구   인 Quantum TrendPulse를   소개합니다. 정밀성과 효율성을 추구하는 트레이더를 위해 설계된 이 지표는 시장 추세, 모멘텀 변화, 최적의 진입 및 종료 지점을 자신 있게 식별하는 데 도움이 됩니다. 주요 특징: SuperTrend 통합:   주요 시장 추세를 쉽게 따라가고 수익성의 물결을 타세요. RSI 정밀도:   매수 과다 및 매도 과다 수준을 감지하여 시장 반전 시점을 파악하는 데 적합하며 SuperTrend 필터로 사용 가능 확률적 정확도:   변동성이 큰 시장에서 숨겨진 기회를 찾기 위해 확률적 진동   을 활용하고 SuperTrend의 필터로 사용 다중 시간대 분석:   M5부터 H1 또는 H4까지 다양한 시간대에 걸쳐 시장을 최신 상태로 유지하세요. 맞춤형 알림:   맞춤형 거래 조건이 충족되면
IX Power MT5
Daniel Stein
4.83 (6)
IX Power: 지수, 원자재, 암호화폐 및 외환 시장 통찰력을 발견하세요 개요 IX Power 는 지수, 원자재, 암호화폐 및 외환 시장의 강도를 분석할 수 있는 다목적 도구입니다. FX Power 는 모든 가용 통화 쌍 데이터를 사용하여 외환 쌍에 대해 가장 높은 정확도를 제공하는 반면, IX Power 는 기초 자산 시장 데이터에만 초점을 맞춥니다. 이로 인해 IX Power 는 비외환 시장에 이상적이며, 다중 쌍 분석이 필요하지 않은 간단한 외환 분석에도 신뢰할 수 있는 도구입니다. 모든 차트에서 매끄럽게 작동하며, 거래 결정을 향상시키기 위한 명확하고 실행 가능한 통찰력을 제공합니다. 1. IX Power가 트레이더에게 유용한 이유 다양한 시장 강도 분석 • IX Power 는 지수, 원자재, 암호화폐 및 외환 심볼의 강도를 계산하여 각 시장에 맞는 통찰력을 제공합니다. • US30, WTI, 금, 비트코인 또는 통화 쌍과 같은 자산을 모니터링하여 거래 기회를 발견
FX Levels MT5
Daniel Stein
5 (2)
FX Levels: 모든 시장을 위한 뛰어난 정확도의 지지와 저항 간단 요약 통화쌍, 지수, 주식, 원자재 등 어떤 시장이든 믿을 만한 지지·저항 레벨을 찾고 싶나요? FX Levels 는 전통적인 “Lighthouse” 기법과 첨단 동적 접근을 결합해, 거의 보편적인 정확성을 제공합니다. 실제 브로커 경험을 반영하고, 자동화된 일별 업데이트와 실시간 업데이트를 결합함으로써 FX Levels 는 가격 반전 포인트를 파악하고, 수익 목표를 설정하며, 자신 있게 트레이드를 관리할 수 있게 돕습니다. 지금 바로 시도해 보세요—정교한 지지/저항 분석이 어떻게 여러분의 트레이딩을 한 단계 끌어올릴 수 있는지 직접 확인하세요! 1. FX Levels가 트레이더에게 매우 유용한 이유 뛰어난 정확도의 지지·저항 존 • FX Levels 는 다양한 브로커 환경에서도 거의 동일한 존을 생성하도록 설계되어, 데이터 피드나 시간 설정 차이로 인한 불일치를 해소합니다. • 즉, 어떤 브로커를 사용하
TPSpro RFI Levels MT5
Roman Podpora
4.53 (19)
지침         러시아   -        영어       표시기와 함께 사용하는 것이 좋습니다   .       -       TPSpro   트렌드 프로 -   MT4 버전         거래에서 핵심 요소는 거래 상품을 매수 또는 매도하기로 결정하는 구역 또는 수준입니다. 주요 업체가 시장에서 자신의 존재를 숨기려는 시도에도 불구하고, 그들은 필연적으로 흔적을 남깁니다. 우리의 과제는 이러한 흔적을 식별하고 올바르게 해석하는 방법을 배우는 것이었습니다. 주요 기능:: 판매자와 구매자를 위한 활성 영역을 표시합니다! 이 지표는 매수 및 매도를 위한 모든 올바른 초기 임펄스 레벨/존을 보여줍니다. 진입점 검색이 시작되는 이러한 레벨/존이 활성화되면 레벨의 색상이 바뀌고 특정 음영으로 채워집니다. 또한 상황을 보다 직관적으로 이해하기 위해 화살표가 나타납니다. 더 높은 시간대의 레벨/존 표시(MTF 모드) 더 높은 시간 간격을 사용하여 레벨/존을 표시하는 기능을 추가했습니다.
TPSproTREND PrO MT5
Roman Podpora
4.47 (17)
TPSpro TREND PRO  - is a trend indicator that automatically analyzes the market and provides information about the trend and each of its changes, as well as giving signals for entering trades without redrawing! The indicator uses each candle, analyzing them separately. referring to different impulses - up or down impulse. Exact entry points into transactions for currencies, crypto, metals, stocks, indices!  ИНСТРУКЦИЯ RUS         INSTRUCTIONS  ENG       R ecommended to use with an indicator   -
RelicusRoad Pro MT5
Relicus LLC
4.78 (18)
이제 $ 147 (몇 가지 업데이트 후 $ 499 증가) - 무제한 계정 (PCS 또는 MACS) RelicusRoad 사용 설명서 + 교육 비디오 + 비공개 Discord 그룹 액세스 + VIP 상태 시장을 보는 새로운 방법 RelicusRoad는 외환, 선물, 암호화폐, 주식 및 지수에 대한 세계에서 가장 강력한 거래 지표로서 거래자에게 수익성을 유지하는 데 필요한 모든 정보와 도구를 제공합니다. 우리는 초보자부터 고급까지 모든 거래자가 성공할 수 있도록 기술적 분석 및 거래 계획을 제공합니다. 미래 시장을 예측할 수 있는 충분한 정보를 제공하는 핵심 거래 지표입니다. 우리는 차트에서 말이 안 되는 여러 지표 대신 완전한 솔루션을 믿습니다. 타의 추종을 불허하는 매우 정확한 신호, 화살표 + 가격 조치 정보를 표시하는 올인원 표시기입니다. 강력한 AI를 기반으로 하는 RelicusRoad는 누락된 정보와 도구를 제공하여 교육하고 성공적인 트레이더인 트레이딩 전문가가 되도
Support And Resistance Screener는 하나의 지표 안에 여러 도구를 제공하는 MetaTrader에 대한 하나의 레벨 지표입니다. 사용 가능한 도구는 다음과 같습니다. 1. 시장 구조 스크리너. 2. 완고한 후퇴 영역. 3. 약세 후퇴 영역. 4. 일일 피벗 포인트 5. 주간 피벗 포인트 6. 월간 피벗 포인트 7. 고조파 패턴과 볼륨에 기반한 강력한 지지와 저항. 8. 은행 수준 구역. LIMITED TIME OFFER : HV 지원 및 저항 표시기는 50 $ 및 평생 동안만 사용할 수 있습니다. ( 원래 가격 125$ ) MQL5 블로그에 액세스하면 분석 예제와 함께 모든 프리미엄 지표를 찾을 수 있습니다. 여기를 클릭하십시오. 주요 특징들 고조파 및 볼륨 알고리즘을 기반으로 하는 강력한 지원 및 저항 영역. Harmonic 및 Volume 알고리즘을 기반으로 한 강세 및 약세 풀백 영역. 시장 구조 스크리너 일간, 주간 및 월간 피벗 포인트. 실제 거래의
Bill Williams Advanced
Siarhei Vashchylka
5 (9)
Bill Williams Advanced is designed for automatic chart analysis using Bill Williams' "Profitunity" system. The indicator analyzes four timeframes at once. Manual (Be sure to read before purchasing) Advantages 1. Automatically analyzes the chart using the "Profitunity" system of Bill Williams. The found signals are placed in a table in the corner of the screen. 2. Equipped with a trend filter based on the Alligator indicator. Most of the system signals are recommended to be used only according t
Basic Harmonic Patterns Dashboard MT5
Mehran Sepah Mansoor
4.57 (7)
이 대시보드는 선택한 심볼에 대해 사용 가능한 최신 고조파 패턴을 표시하므로 시간을 절약하고 더 효율적으로 사용할 수 있습니다 /   MT4 버전 . 무료 인디케이터:   Basic Harmonic Pattern 인디케이터 열 Symbol :   선택한 심볼이 나타납니다 Trend :   강세 또는 약세 Pattern :   패턴 유형(가틀리, 나비, 박쥐, 게, 상어, 사이퍼 또는 ABCD) Entry :   진입 가격 SL:   스톱로스 가격 TP1:   1차 테이크프로핏 가격 TP2:   2차 테이크프로핏 가격 TP3:   3차 테이크프로핏 가격 Current price:   현재 가격 Age (in bars):   마지막으로 그려진 패턴의 나이 주요 입력 Symbols :   "28개 주요 통화쌍" 또는 "선택한 심볼" 중에서 선택합니다. Selected Symbols :   쉼표로 구분하여 모니터링하려는 원하는 심볼("EURUSD,GBPUSD,XAUUSD")을 선택
우선적으로, 이 거래 도구는 전문적인 거래에 이상적인 비-다시 그리기 및 지연되지 않는 지표입니다.  온라인 강좌, 사용자 매뉴얼 및 데모. 스마트 가격 액션 컨셉트 인디케이터는 신규 및 경험 많은 트레이더 모두에게 매우 강력한 도구입니다. Inner Circle Trader Analysis 및 Smart Money Concepts Trading Strategies와 같은 고급 거래 아이디어를 결합하여 20가지 이상의 유용한 지표를 하나로 결합합니다. 이 인디케이터는 스마트 머니 컨셉트에 중점을 두어 대형 기관의 거래 방식을 제공하고 이동을 예측하는 데 도움을 줍니다.  특히 유동성 분석에 뛰어나 기관이 어떻게 거래하는지 이해하는 데 도움을 줍니다. 시장 트렌드를 예측하고 가격 변동을 신중하게 분석하는 데 탁월합니다. 귀하의 거래를 기관 전략에 맞추어 시장의 동향에 대해 더 정확한 예측을 할 수 있습니다. 이 인디케이터는 시장 구조를 분석하고 중요한 주문 블록을 식별하고 다양
Entry Points Pro for MT5
Yury Orlov
4.46 (129)
다시 색을 칠하지 않고 거래에 진입할 수 있는 정확한 신호를 제공하는 MT5용 지표입니다. 외환, 암호화폐, 금속, 주식, 지수 등 모든 금융 자산에 적용할 수 있습니다. 매우 정확한 추정값을 제공하고 매수와 매도의 가장 좋은 시점을 알려줍니다. 하나의 시그널로 수익을 내는 지표의 예와 함께 비디오 (6:22)시청하십시오! 대부분의 거래자는 Entry Points Pro 지표의 도움으로 첫 거래 주 동안 트레이딩 결과를 개선합니다. 저희의   Telegram Group 을 구독하세요! Entry Points Pro 지표의 좋은점. 재도색이 없는 진입 신호 신호가 나타나고 확인되면(시그널 캔들이 완성된 경우) 신호는 더 이상 사라지지 않습니다. 여타 보조지표의 경우 신호를 표시한 다음 제거되기 때문에 큰 재정적 손실로 이어집니다. 오류 없는 거래 게시 알고리즘을 통해 트레이드(진입 또는 청산)를 할 이상적인 순간을 찾을 수 있으며, 이를 통해 이를 사용하는 모든 거래자의 성공률이
FX Dynamic: 맞춤형 ATR 분석으로 변동성과 트렌드를 파악하세요 개요 FX Dynamic 는 Average True Range(ATR) 계산을 활용하여 트레이더에게 일간 및 일중 변동성에 대한 뛰어난 인사이트를 제공하는 강력한 도구입니다. 80%, 100%, 130%와 같은 명확한 변동성 임계값을 설정함으로써 시장이 평소 범위를 초과할 때 빠르게 경고를 받고, 유망한 수익 기회를 재빨리 식별할 수 있습니다. FX Dynamic 는 브로커의 시간대를 인식하거나 수동으로 조정할 수 있으며, 변동성 측정 기준을 일관되게 유지하며, MetaTrader 플랫폼과 완벽하게 연동되어 실시간 분석을 지원합니다. 1. FX Dynamic이 트레이더에게 매우 유용한 이유 실시간 ATR 인사이트 • 하루 및 일중 변동성을 한눈에 모니터링하세요. ATR의 80%, 100%, 130% 임계값이 도달 또는 초과되면, 시장의 중요한 지점에 있음을 알 수 있습니다. • 변동성이 완전히 폭발하기
Gold Stuff mt5
Vasiliy Strukov
4.92 (173)
Gold Stuff mt5는 금을 위해 특별히 설계된 추세 지표이며 모든 금융 상품에서도 사용할 수 있습니다. 표시기가 다시 그려지지 않고 지연되지 않습니다. 권장 기간 H1. 설정 및 개인 보너스를 받으려면 구매 후 즉시 저에게 연락하십시오!     강력한 지원 및 트렌드 스캐너 표시기의 무료 사본을 받으실 수 있습니다. 메시지를 보내주세요. 나!   설정 화살표 그리기 - 켜기 끄기. 차트에 화살표 그리기. 경고 - 가청 경고를 끕니다. 이메일 알림 - 켜기 끄기. 이메일 알림. Puch-notification - 켜기 끄기. 푸시 알림. 다음으로 색 영역을 조정합니다. Gold Stuff mt5는 금을 위해 특별히 설계된 추세 지표이며 모든 금융 상품에서도 사용할 수 있습니다. 표시기가 다시 그려지지 않고 지연되지 않습니다. 권장 기간 H1. 설정 및 개인 보너스를 받으려면 구매 후 즉시 저에게 연락하십시오!   설정 화살표 그리기 - 켜기 끄기. 차트에 화살표 그
소개       Quantum Breakout PRO   , 브레이크아웃 존 거래 방식을 변화시키는 획기적인 MQL5 지표! 13년 이상의 거래 경험을 가진 숙련된 트레이더 팀이 개발한       퀀텀 브레이크아웃 PRO       혁신적이고 역동적인 브레이크아웃 존 전략으로 거래 여정을 새로운 차원으로 끌어올리도록 설계되었습니다. Quantum Breakout Indicator는 5개의 이익 목표 영역이 있는 브레이크아웃 영역의 신호 화살표와 브레이크아웃 상자를 기반으로 한 손절 제안을 제공합니다. 초보자 거래자와 전문 거래자 모두에게 적합합니다. Quantum EA 채널:       여기를 클릭하세요 중요한! 구매 후 설치 매뉴얼을 받으려면 개인 메시지를 보내주십시오. 추천: 기간: M15 통화쌍: GBPJPY, EURJPY, USDJPY,NZDUSD, XAUUSD 계정 유형: 스프레드가 매우 낮은 ECN, Raw 또는 Razor 브로커 시간: GMT +3 중개인 :
Matrix Arrow Indicator MT5
Juvenille Emperor Limited
5 (13)
매트릭스 화살표 표시기 MT5 는 외환, 상품, 암호 화폐, 지수, 주식과 같은 모든 기호/도구에 사용할 수 있는 100% 다시 칠하지 않는 다중 기간 표시기를 따르는 고유한 10 in 1 추세입니다.  Matrix Arrow Indicator MT5 는 다음과 같은 최대 10개의 표준 지표에서 정보와 데이터를 수집하여 초기 단계에서 현재 추세를 결정합니다. 평균 방향 이동 지수(ADX) 상품 채널 지수(CCI) 클래식 하이켄 아시 캔들 이동 평균 이동 평균 수렴 발산(MACD) 상대 활력 지수(RVI) 상대 강도 지수(RSI) 포물선 SAR 스토캐스틱 오실레이터 윌리엄스의 백분율 범위 모든 지표가 유효한 매수 또는 매도 신호를 제공하면 강력한 상승/하락 추세를 나타내는 다음 캔들/막대가 시작될 때 해당 화살표가 차트에 인쇄됩니다. 사용자는 사용할 표시기를 선택하고 각 표시기의 매개변수를 개별적으로 조정할 수 있습니다. 매트릭스 화살표 표시기 MT5는 선택한 표시기에서만 정보를 수
Easy Breakout MT5
Mohamed Hassan
5 (3)
After your purchase, feel free to contact me for more details on how to receive a bonus indicator called VFI, which pairs perfectly with Easy Breakout for enhanced confluence!     Easy Breakout MT5   is a powerful price action trading system built on one of the most popular and widely trusted strategies among traders: the   Breakout strategy ! This indicator delivers crystal-clear Buy and Sell signals based on breakouts from key support and resistance zones. Unlike typical breakout indicators
Gartley Hunter Multi
Siarhei Vashchylka
5 (9)
Gartley Hunter Multi - An indicator for searching for harmonic patterns simultaneously on dozens of trading instruments and on all possible timeframes. Manual (Be sure to read before purchasing) | Version for MT4 Advantages 1. Patterns: Gartley, Butterfly, Shark, Crab. Bat, Alternate Bat, Deep Crab, Cypher 2. Simultaneous search for patterns on dozens of trading instruments and on all possible timeframes 3. Search for patterns of all possible sizes. From the smallest to the largest 4. All fou
Royal Scalping Indicator M5
Vahidreza Heidar Gholami
5 (6)
Royal Scalping Indicator is an advanced price adaptive indicator designed to generate high-quality trading signals. Built-in multi-timeframe and multi-currency capabilities make it even more powerful to have configurations based on different symbols and timeframes. This indicator is perfect for scalp trades as well as swing trades. Royal Scalping is not just an indicator, but a trading strategy itself. Features Price Adaptive Trend Detector Algorithm Multi-Timeframe and Multi-Currency Trend Low
Trade smarter, not harder: Empower your trading with Harmonacci Patterns Special Offer: Purchase now to receive free bonuses worth $165! (Read more for details) This is arguably the most complete harmonic price formation auto-recognition indicator you can find for the MetaTrader Platform. It detects 19 different patterns, takes fibonacci projections as seriously as you do, displays the Potential Reversal Zone (PRZ) and finds suitable stop-loss and take-profit levels. [ Installation Guide | Upd
Basic Supply Demand Dashboard MT5
Mehran Sepah Mansoor
5 (1)
이 대시보드는 선택한 기호에 대한 거래 전략에 따라 스캘핑 모드와 장기 모드 모두에서 차트의 공급 및 수요 영역을 검색하고 표시합니다. 또한 대시보드의 스캐너 모드를 통해 원하는 모든 기호를 한눈에 확인하고 적합한 위치를 놓치지 않도록 도와줍니다 / MT4 버전 . 무료 보조지표:   Basic Supply Demand 특징 여러 통화쌍에 대한 거래 기회를 볼 수 있으며, 공급 및 수요 영역에 대한 근접성에 따라 순위가 매겨진 모든 쌍을 명확하고 간결하게 볼 수 있습니다. 색상부터 감지 매개변수까지 특정 요구에 맞게 사용자 지정 설정 가능 주요 입력 Indicator mode :   표시기 모드 또는 새로운 기능이 포함된 패널 모드 중에서 선택 가능 Symbols :   "28개 주요 통화쌍" 또는 "선택한 심볼" 중에서 선택 Selected Symbols :   쉼표로 구분하여 모니터링하려는 원하는 심볼("EURUSD, GBPUSD, XAUUSD")을 선택합니다. 브로
QM Pattern Scanner MT5
Reza Aghajanpour
5 (4)
Contact me  to send you instruction and add you in group. QM (Quasimodo) Pattern is based on Read The Market(RTM) concepts. The purpose of this model is to face the big players of the market (financial institutions and banks), As you know in financial markets, big traders try to fool small traders, but RTM prevent traders from getting trapped. This style is formed in terms of price candles and presented according to market supply and demand areas and no price oscillator is used in it. RTM conc
Auto Order Block with break of structure based on ICT and Smart Money Concepts (SMC) Futures Break of Structure ( BoS )             Order block ( OB )            Higher time frame Order block / Point of Interest ( POI )    shown on current chart           Fair value Gap ( FVG ) / Imbalance   -  MTF      ( Multi Time Frame )    HH/LL/HL/LH  -  MTF      ( Multi Time Frame )  Choch  MTF      ( Multi Time Frame )  Volume Imbalance     ,  MTF          vIMB Gap’s Power of 3 Equal High / Low’s  
Volumatic VIDyA MT5
Duc Hoan Nguyen
5 (1)
Special offer : ALL TOOLS , just $35 each! New tools   will be   $30   for the   first week   or the   first 3 purchases !  Trading Tools Channel on MQL5 : Join my MQL5 channel to update the latest news from me Volumatic VIDYA (Variable Index Dynamic Average) 는 트렌드를 추적하고 각 트렌드 단계에서 매수 및 매도 압력을 분석하기 위해 설계된 고급 지표입니다. 가변 지수 동적 평균(Variable Index Dynamic Average)을 핵심 동적 평활화 기술로 활용하여 이 도구는 주요 시장 구조 수준에서 가격 및 거래량 역학에 대한 중요한 통찰력을 제공합니다. MT4 버전 보기:  Volumatic VIDyA MT4 다른 제품 보기:    모든 제품 To use iCustom
Dark Absolute Trend   is an Indicator for intraday trading. This Indicator is based on   Trend Following  strategy but use also candlestick patterns and Volatility. We can enter in good price with this Indicator, in order to follow the main trend on the current instrument. It is advised to use low spread ECN brokers. This Indicator does   Not repaint   and   N ot lag . Recommended timeframes are M5, M15 and H1. Recommended working pairs: All. I nstallation and  Update Guide   -  Troubleshooting
CONTACT US  after purchase to get the Indicator Manual. Try Now—Limited 50% Discount for First 10 Buyers! Download the  Metatrader 4 Version Due to regulatory restrictions, our service is unavailable in certain countries such as India, Pakistan, and Bangladesh. William Delbert Gann (W.D. Gann) was an exceptional market analyst, whose trading technique was based on a complex blend of mathematics, geometry, astrology, and ancient mathematics which proved to be extremely accurate. A Note from t
Suleiman Levels
Suleiman Alhawamdah
5 (2)
중요 사항: 스크린샷에 표시된 이미지는 제가 사용하는 2가지 지표인 "술레이만 레벨(Suleiman Levels)" 지표와 "RSI 트렌드 V(RSI Trend V)" 지표입니다. "RSI Trend V1" 지표와 함께 사용하는 것을 권장했습니다. 특히 색상 구름을 확인하고 일치시키며 화살표 신호를 위해, 그리고 피보나치 지표와 그에 첨부된 우수한 수준의 중요성을 고려하여 사용하는 것이 좋습니다 : https://www.mql5.com/en/market/product/132080 "술레이만 레벨(Suleiman Levels)" 지표는 고급 올인원 전문 분석 도구입니다. 약 9,800줄의 코드로 구성된 이 지표는 혁신, 정확성, 단순성을 결합하여 차트를 이전보다 더 명확하게 만들어줍니다. 이는 단순한 지표가 아닙니다. "술레이만 레벨(Suleiman Levels)"을 차별화하는 강력한 기능: 노란색 상자(자금 흐름 감지): 특정 캔들에서 은행 및 기관의 자금 유입을 감지합니다. 이
제작자의 제품 더 보기
TrailingStop MA
Andrej Nikitin
3.5 (2)
The indicator draws two simple moving averages using High and Low prices. The MA_High line is displayed when the moving average is directed downwards. It can be used for setting a stop order for a sell position. The MA_Low line is displayed when the moving average is directed upwards. It can be used for setting a stop order for a buy position. The indicator is used in the TrailingStop Expert Advisor. Parameters Period - period of calculation of the moving average. Deviation - rate of convergence
FREE
Ticks
Andrej Nikitin
3 (1)
A simple tick indicator of Bid and Ask prices. The period separator (1 minute) is displayed as a histogram. Parameters Show Bid Line - show/hide the Bid line; Show Ask Line - show/hide the Ask line; Show Labels - show/hide the last price values.
FREE
Ticks Bars
Andrej Nikitin
4 (2)
This tick indicator draws synthetic bars/candlesticks that contain a definite number of ticks. Parameters: option prices - price option. It can be Bid, Ask or (Ask+Bid)/2. the number of ticks to identify Bar - number of ticks that form OHLC. price levels count - number of displayed price levels (no levels are displayed if set to 0 or a lower value). calculated bar  - number of bars on the chart. Buffer indexes: 0 - OPEN, 1 - HIGH, 2 - LOW, 3 - CLOSE.
FREE
AccountQuickReport
Andrej Nikitin
5 (1)
The script creates account summary report in a separate window. The report can be created for all deals and on deals for selected financial instruments. It is possible to specify a time interval of calculation and save report to htm-file. The script creates account summary report in a separate window. The report can be created for all deals and for deals of the selected financial instruments. It is possible to specify a time interval of calculation and save report to htm-file. Input parameters
The script creates account summary report in a separate window. The report can be created for all deals and for deals on selected financial instruments. It is possible to specify a time interval of calculation and save report to an htm file. Script inputs report starting date - initial report generation date. symbols selection for report - select a method of choosing tools for a report generation. allSymbol - report is generated for deals performed on all symbols. onlyCurrentSymbol - report is
TrailingStop MA 4
Andrej Nikitin
4 (1)
The indicator draws two simple moving averages using High and Low prices. The MA_High line is displayed when the moving average is directed downwards. It can be used for setting a stop order for a sell position. The MA_Low line is displayed when the moving average is directed upwards. It can be used for setting a stop order for a buy position. The indicator is used in the TrailingStop Expert Advisor. Parameters Period - period of calculation of the moving average. Deviation - rate of convergence
FREE
MarginGrid
Andrej Nikitin
3 (1)
The analyzer allow estimating how the margin level changes when a position price or volume changes. It also displays price level at which StopOut and MarginCall may occur. Parameters: volume position upgrading - the number of lot position changes. number of levels on the chart - the number of levels plotted on the chart levels color - color for drawing levels
Tick
Andrej Nikitin
4.5 (2)
A simple tick indicator of Bid and Ask prices. The period separator (1 minute) is displayed as a histogram. Parameters Price_levels_count - number of price levels to be displayed. Bar_under_calculation - number of bars of the indicator to be displayed on the chart.
FREE
Ticks RSI 4
Andrej Nikitin
The Relative Strength Index indicator drawn using a tick chart. After launching it, wait for enough ticks to come. Parameters: RSI Period - period of averaging. overbuying level - overbought level. overselling level - oversold level. calculated bar - number of bars on the chart for the indicator calculation. The following parameters are intended for adjusting the weight of RSI signals (from 0 to 100). You can find their description in the Signals of the Oscillator Relative Strength Index section
The Envelopes indicator drawn using a tick chart. After launching it, wait for enough ticks to come. Parameters: Averaging period - period of averaging. Smoothing type - type of smoothing. Can have any values of the enumeration ENUM_MA_METHOD . Option prices - price to be used. Can be Ask, Bid or (Ask+Bid)/2. Deviation of boundaries from the midline (in percents) - deviation from the main line in percentage terms. Price levels count - number of displayed price levels (no levels are displayed if
The Stochastic Oscillator indicator is drawn on the tick price chart. After launching it, wait for enough ticks to come. Parameters: K period - number of single periods used for calculation of the stochastic oscillator; D period - number of single periods used for calculation of the %K Moving Average line; Slowing - period of slowing %K; Calculated bar - number of bars in the chart for calculation of the indicator. The following parameters are intended for adjusting the weight of signals of the
Ticks MACD 4
Andrej Nikitin
The Moving Average Convergence/Divergence(MACD) indicator drawn using a tick chart. After launching it, wait for enough ticks to come. Parameters: Fast EMA period - indicator drawn using a tick chart. Slow EMA period - slow period of averaging. Signal SMA period - period of averaging of the signal line. calculated bar - number of bars on the chart for the indicator calculation. The following parameters are intended for adjusting the weight of MACD signals (from 0 to 100). You can find their desc
Ticks Bands 4
Andrej Nikitin
The Bollinger Bands indicator drawn using a tick chart. After launching it, wait for enough ticks to come. Parameters: Period - period of averaging. Deviation - deviation from the main line. Price levels count - number of displayed price levels (no levels are displayed if set to 0). Bar under calculation - number of bars on the chart for the indicator calculation. Buffer indexes: 0 - BASE_LINE, 1 - UPPER_BAND, 2 - LOWER_BAND, 3 - BID, 4 - ASK.
Ticks OsMA 4
Andrej Nikitin
The Moving Average of Oscillator(OsMA) indicator drawn using a tick chart. After launching it, wait for enough ticks to come. Parameters: Fast EMA period - fast period of averaging. Slow EMA period - slow period of averaging. Signal SMA period - period of averaging of the signal line. calculated bar - number of bars for the indicator calculation.
Ticks CCI 4
Andrej Nikitin
The Commodity Channel Index(CCI) indicator drawn using a tick chart. After launching it, wait for enough ticks to come. Parameters: period - number of single periods used for the indicator calculation. calculated bar - number of bars for the indicator calculation. The following parameters are intended for adjusting the weight of CCI signals (from 0 to 100). You can find their description in the Signals of the Commodity Channel Index section of MQL5 Reference. The oscillator has required directio
Ticks ADX 4
Andrej Nikitin
The Average Directional Movement Index indicator drawn using a tick chart. After launching it, wait for enough ticks to come. Parameters: Period - period of averaging. Сalculated bar - number of bars on the chart for the indicator calculation. Buffer indexes: 0 - MAIN_LINE, 1 - PLUSDI_LINE, 2 - MINUSDI_LINE.
Tick StdDev 4
Andrej Nikitin
The Standard Deviation (StdDev) indicator drawn using a tick chart. After launching it, wait for enough ticks to come. Parameters: Period - period of averaging. Method - method of averaging. calculated bar - number of bars for the indicator calculation.
Ticks Momentum 4
Andrej Nikitin
The Momentum indicator drawn using a tick chart. After launching it, wait for enough ticks to come. Parameters: period - period of the indicator calculation. levels count - number of displayed levels (no levels are displayed if set to 0) calculated bar - number of bars for the indicator calculation.
Ticks Bulls 4
Andrej Nikitin
The Bulls Power indicator drawn using a tick chart. After launching it, wait for enough ticks to come. Parameters: Period - period of averaging. The number of ticks to identify high/low - number of single ticks for determining high/low. Calculated bar - number of bars for the indicator calculation. The following parameters are intended for adjusting the weight of Bulls Power signals (from 0 to 100). You can find their description in the Signals of the Bulls Power oscillator section of MQL5 Refer
Ticks Bears 4
Andrej Nikitin
The  Bears Power indicator drawn using a tick chart. After launching it, wait for enough ticks to come. Parameters: Period - period of averaging. The number of ticks to identify high/low - number of single ticks for determining high/low. Calculated bar - number of bars for the indicator calculation. The following parameters are intended for adjusting the weight of Bears Power signals (from 0 to 100). You can find their description in the Signals of the Bears Power oscillator section of MQL5 Refe
Tiks ATR 4
Andrej Nikitin
The  Average True Range (ATR)  indicator drawn using a tick chart. After launching it, wait for enough ticks to come. Parameters: ATR Period  - number of single periods used for the indicator calculation. The number of ticks to identify Bar  - number of single ticks that form OHLC. Price levels count  - number of displayed price levels (no levels are displayed if set to 0 or a lower value). price mode  - choice of prices under calculation (can be bid, ask or average). Сalculated bar  - number of
Tiks WPR 4
Andrej Nikitin
The  Williams' Percent Range (%R)  indicator drawn using a tick chart. After launching it, wait for enough ticks to come. Parameters: WPR Period  - period of the indicator. Overbuying level  - overbought level. Overselling level  - oversold level. price mode  - choice of prices under calculation (can be bid, ask or average). Сalculated bar  - number of bars for the indicator calculation. The following parameters are intended for adjusting the weight of WPR signals (from 0 to 100). You can find t
The  Price Channel  indicator drawn using a tick chart. After launching it, wait for enough ticks to come. Parameters: Period  - period for determining the channel boundaries. Price levels count  - number of displayed price levels (no levels are displayed if set to 0). price mode  - choice of prices under calculation (can be bid, ask or average). Bar under calculation  - number of bars on the chart for the indicator calculation. Buffer indexes: 0 - Channel upper, 1 - Channel lower, 2 - Channel m
Abigail 4
Andrej Nikitin
Description: Abigail is a medium-term trading system making profit during the price rollback. The Expert Advisor has been optimized for working on EURUSD. However, it can successfully work with other currency pairs as well. You can examine the Expert Advisor's trading statistics for different brokers and symbols at MetaTrader 4 and MetaTrader 5 Trading Signals sections. Parameters: Risk management: enter volume - market entry volume. If the value is greater than 0 - number of lots, if less than
TimeFilter indicator allows you to visually select bit masks (GoodHourOfDay, BadHoursOfDay, GoodDayOfWeek, BadDaysOfWeek) for the  Intraday Time Filter  module of trading signals of the Standard Library. The use of time filters allows you to take into account the particulars of each trading session in performing trading operations.
TimeFilter simple 4
Andrej Nikitin
1 (1)
The indicator is an inter-week hourly filter. When executing trading operations, the indicator allows considering time features of each trading session. Permissive and restrictive filter intervals are set in string form. The used format is [first day]-[last day]:[first hour]-[last hour]. See the screenshots for examples. Parameters: Good Time for trade - intervals when trading is allowed. Bad Time for trade - intervals when trading is forbidden. time filter shift (hours) - hourly shift. percenta
TrailingStop 4
Andrej Nikitin
4.83 (6)
The Expert Advisor modifies the Stop Loss order position opened for the instrument of the current chart based on indicator values. Uses indicators Parabolic SAR ,  NRTR (Nick Rypock Trailing Reverse) ,  Moving Average  or linear regression channel. Switchable modes: Trailing stop only when in profit; Trailing stop only following the price; On every teak or on formed bars; Trailing for each order separately or for a total position. Has an option of "hidden stop", also you can exclude individual
The EA performs trade operations of closing position groups. Positions are grouped by type. It is possible to select orders by the profit (loss) value. It is possible to form the closure groups manually. You can set a value for automatic closure of a positions group after reaching a certain profit/loss level or price level. The additional functions of the EA are called using the hot keys: SHIFT+A - show/hide Auto exit options. SHIFT+S - show/hide Settings panel. SHIFT+V - sound ON/OFF. SHIFT+I -
The Expert Advisor for increasing (or opening) market positions. Allows specifying the desired risk, target and searching for the best open price and trade volume. Configurable Parameters: lots - directly the volume of the position increase. % equity - the amount of growth as a percentage of the amount of funds. stop loss - directly the level of the stop loss order. loss - the level of the stop loss order depending on the allowable loss. take profit - directly the take profit level of the o
The Expert Advisor notifies that a price has crossed a line on the chart. It handles two types of lines - horizontal line and a trendline. The number of lines is unlimited. Parameters: prefix of signal line - prefix of object (line) names processed by the indicator. If the parameter is empty, it handles all object types: horizontal lines and trendlines. price Mode - price type (bid or ask). timeout - crossing alert timeout. number of repeats - the limit of crossing alert repeats. number of comme
필터:
Andrei
836
Andrei 2017.05.28 08:08 
 

사용자가 평가에 대한 코멘트를 남기지 않았습니다

리뷰 답변
버전 1.12 2021.11.17
Compile application in the latest platform build.
버전 1.10 2017.01.20
Added downloading of bars from available tick history.
Added the ability to select the base price.