HZZ
- 지표
- Nikolay Likhovid
- 버전: 1.1
- 업데이트됨: 17 11월 2021
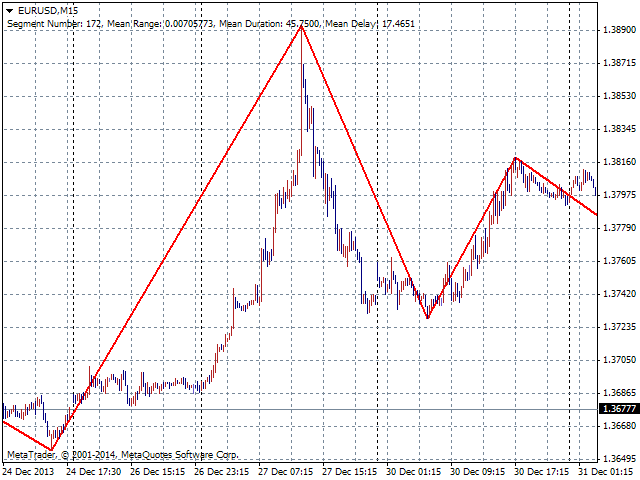
This is a very fast and not redrawing ZiGZag; it supports switching the segments at breakouts of price levels located at a specified distance (H parameter) from the current extremum. MinBars parameter sets the depth of history for drawing the indicator; 0 means drawing on the entire history. SaveData parameter allows writing the coordinates of extremums to a file (time in the datatime format and price).
Some statistics calculated on the basis of the ZigZag is displayed in the form of comments.









사용자가 평가에 대한 코멘트를 남기지 않았습니다