Technical Dashboard
- 유틸리티
- Dominik Mandok
- 버전: 1.1
- 업데이트됨: 30 11월 2021
- 활성화: 10
Technical Dashboard is a great tool for quickest possible analysis of multiple currency pairs in terms of coherent conditions of 4 different indicators at the same time.
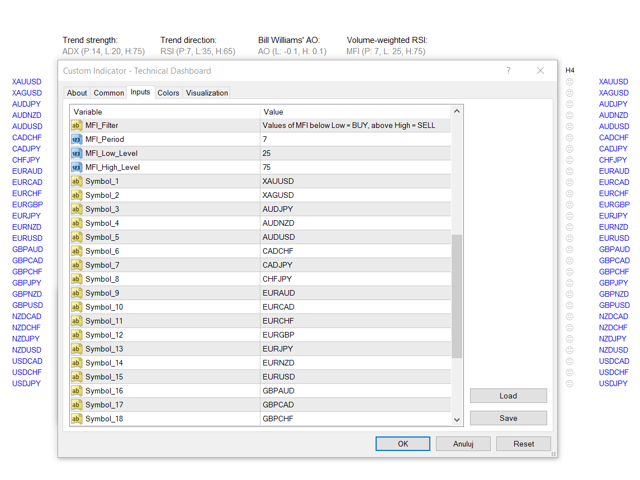
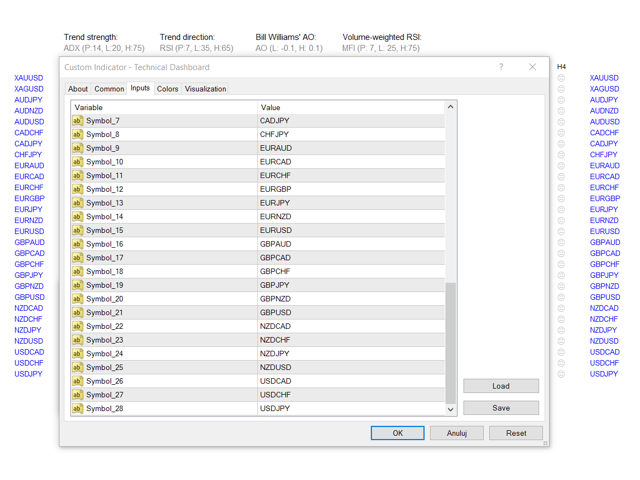
The number of displayed symbols is 30 and the name of each symbol can be edited in the parameters, so we are able to analyze not only predetermined currency pairs, but also other ones, commodities, equities, indices, currency pairs with prefixes and suffixes etc.
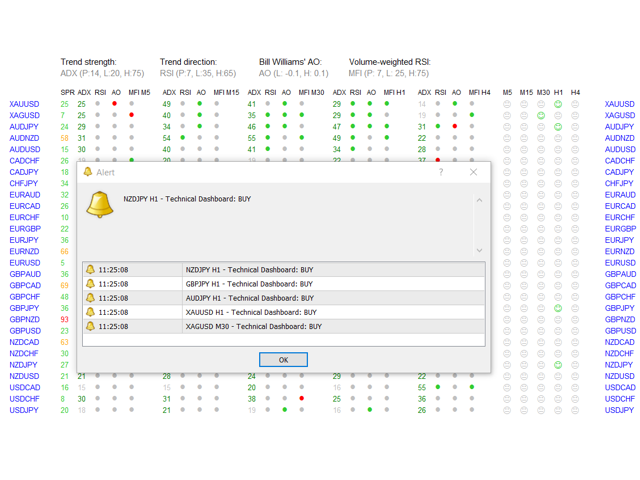
This analyzer is perfect for alert notifications through the MetaTrader terminal, push notifications to mobile device and also email alerts, e.g. from a VPS. We can disable/enable each one (alerts, notifications, e-mails).
Technical Dashboard is based on 4 technical indicators:
- Average Directional Movement Index which indicates strength of the trend.
- Relative Strength Index which indicates direction of the trend.
- Bill Williams' Awesome Oscillator which shows the market momentum.
- Money Flow Index (called also: volume-weighted Relative Strength Index) which indicates buying and selling pressure based on price and volume.
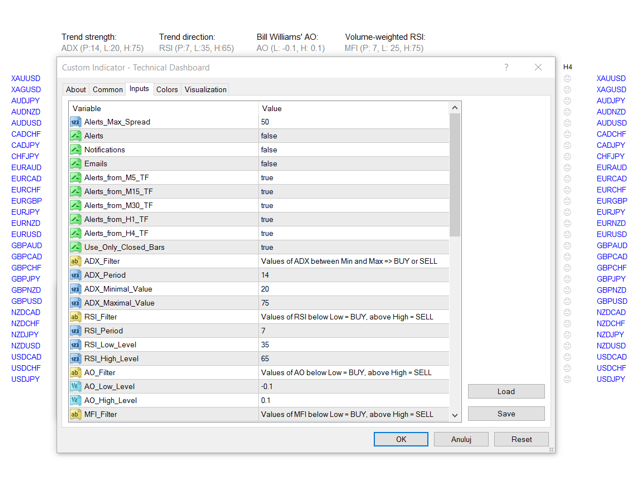
For each indicator we can set Low and High Level (for ADX it's Maximal and Minimal Value). For ADX, RSI and MFI we can set also Period. Conditions to trigger alerts can be met only if value of ADX is between ADX Minimal Value and ADX Maximal Value, value of RSI is lower than RSI Low Level (for BUY) or higher than RSI High Level (for SELL), value of AO is below AO Low Level (for BUY) or above AO High Level (for SELL), and value of MFI is lower than MFI Low Level (for BUY) or higher than MFI High Level (for SELL).
We get alert/notification/email only if all 4 conditions are met for a given currency pair in a given period of time and are coherent, so:
- ADX must be between Minimal and Maximal Value.
- RSI, AO and MFI must be above High Level for signal to SELL or below Low Level for signal to BUY.
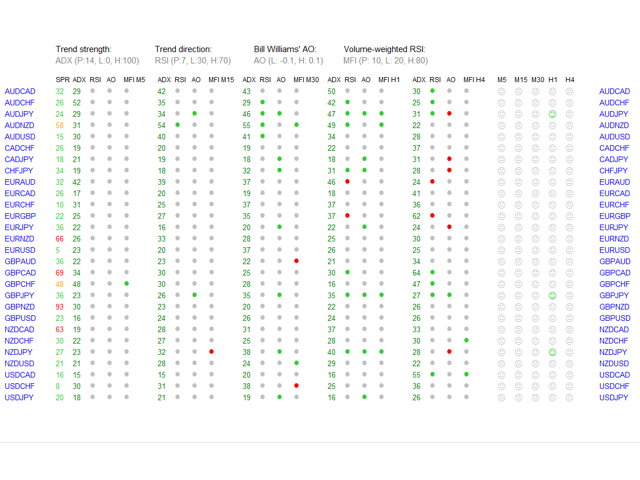
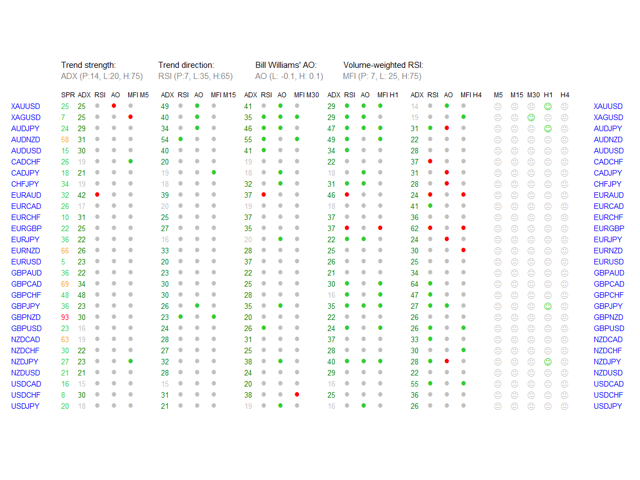
Green and red dots on dashboard indicate if condition is met for specified indicator, currency pair and timeframe. Green dots show Oversold (BUY), red - Overbought (SELL). If ADX is between Minimal and Maximal Value (value in green color - otherwise is gray) and 3 dots (for 3 indicators) are green or red for specified currency pair and timeframe - we will see green or red smiley on the right side of the dashboard. This means that all indicators are coherent.
Another parameter is "Use_Only_Closed_Bars" - if is set to "True" alerts come only from closed candles. If is set to "False" - alerts come immediately from current values of current candles.
Dashboard gives us possibility to choose 5 timeframes from which we will get alerts: M5, M15, M30, H1, H4.
In header of the dashboard are displayed all parameters of 4 indicators.
We can set maximum spread at which the notifications will come ("Alerts_Max_Spread").
Visible spread values on the dashboard have different colors:
- a) when value is lower or equal to "Alerts_Max_Spread" - Green,
- b) between 1 and 1.5 times higher than this parameter - Orange,
- c) above 1.5 times higher than this parameter - Red.
I suggest to make a new template only with "Technical Dashboard" and scheme without colors ("None"), only Background and Foreground set to "White".
Remember, no one except yourself is responsible for any investment decision made by you.
You are responsible for your own investment research and investment decisions.
Good luck!

Hi, Dominik! Once again you did a decent Dashboard! Very convenient to market analysis!