• 미리보기
  • 리뷰 (6)
  • 코멘트 (2)
  • 새 소식

PZ Lopez Flow MT5

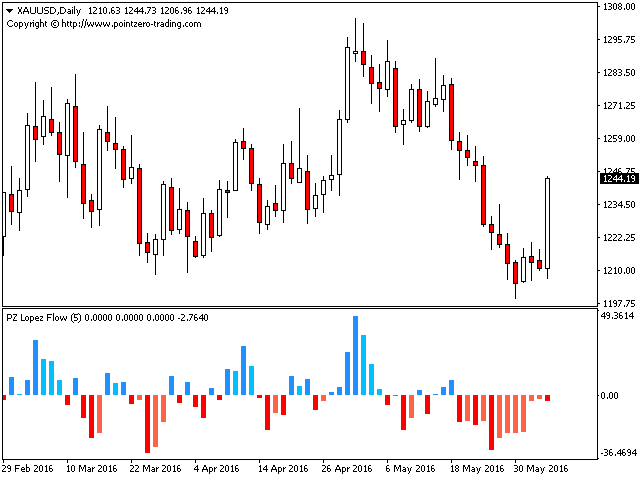
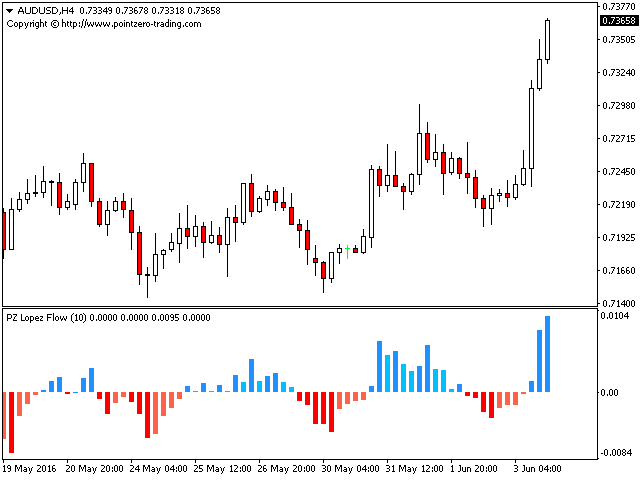
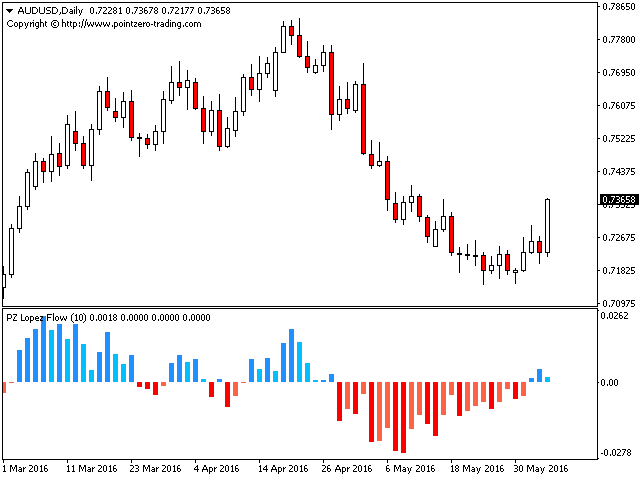
This indicator studies price action as an aggregation of price and time vectors, and uses the average vector to determine the direction and strength of the market. This indicator highlights the short-term directionality and strength of the market, and can be used to capitalize from short-term price movements by trading breakouts or binary options

  [ Installation Guide | Update Guide | Troubleshooting | FAQ | All Products ]

  • Find market direction easily
  • Confirm with breakouts or other indicators
  • Draws at bar closing and does not repaint
  • It implements alerts of all kinds

The indicator is interpreted as follows:

  • A red oscillator means bearish movement
  • A blue oscillator means bullish movement
  • A dark red oscillator means accelerated bearish movement
  • A dark blue oscillator means accelerates bullish movement

Input Parameters

  • Indicator Period: The amount of bars to consider to calculate the flow
  • Visual Alerts: Enables or disables email alerts
  • Mail Alerts: Enables or disables email alerts
  • Sound Alerts: Enables or disables sound alerts
  • Push Alerts: Enables or disables push alerts


    Author

    Arturo López Pérez, private investor and speculator, software engineer and founder of Point Zero Trading Solutions.

    추천 제품
    An indicator of pattern #31 ("Long Island") from Encyclopedia of Chart Patterns by Thomas N. Bulkowski. The second gap is in the opposite direction. Parameters: Alerts - show alert when an arrow appears   Push - send a push notification when an arrow appears (requires configuration in the terminal) GapSize - minimum gap size in points ArrowType - a symbol from 1 to 17 ArrowVShift - vertical shift of arrows in points   ShowLevels - show levels ColUp - color of an upward line ColDn - color of a d
    Support & Resistance indicator is a modification of the standard Bill Williams' Fractals indicator. The indicator works on any timeframes. It displays support and resistance levels on the chart and allows setting stop loss and take profit levels (you can check the exact value by putting the mouse cursor over the level). Blue dashed lines are support level. Red dashed lines are resistance levels. If you want, you can change the style and color of these lines. If the price approaches a support lev
    Owl Smart Levels MT5
    Sergey Ermolov
    4.07 (28)
    MT4 버전  |  FAQ Owl Smart Levels Indicator 는 Bill Williams 의 고급 프랙탈, 시장의 올바른 파동 구조를 구축하는 Valable ZigZag, 정확한 진입 수준을 표시하는 피보나치 수준과 같은 인기 있는 시장 분석 도구를 포함하는 하나의 지표 내에서 완전한 거래 시스템입니다. 시장과 이익을 취하는 장소로. 전략에 대한 자세한 설명 표시기 작업에 대한 지침 고문-거래 올빼미 도우미의 조수 개인 사용자 채팅 ->구입 후 나에게 쓰기,나는 개인 채팅에 당신을 추가하고 거기에 모든 보너스를 다운로드 할 수 있습니다 힘은 단순함에 있습니다! Owl Smart Levels 거래 시스템은 사용하기 매우 쉽기 때문에 전문가와 이제 막 시장을 연구하고 스스로 거래 전략을 선택하기 시작한 사람들 모두에게 적합합니다. 전략 및 지표에는 눈에 보이지 않는 비밀 공식 및 계산 방법이 없으며 모든 전략 지표는 공개되어 있습니다. Owl Smart Levels를 사
    Noize Absorption Index
    Ekaterina Saltykova
    Noize Absorption Index - is the manual trading system that measures the difference of pressure between bears forces and bulls forces. Green line - is a noize free index that showing curent situation. Zero value of index shows totally choppy/flat market.Values above zero level shows how powerfull bullish wave is and values below zero measures bearish forces.Up arrow appears on bearish market when it's ready to reverse, dn arrow appears on weak bullish market, as a result of reverse expectation.
    이것은 가격 레이블이 있는 Advanced ZigZag Dynamic   및/또는   Extended Fractals   표시기 극값을 기반으로 하는 지원 및 저항 수준의 MTF 표시기입니다(비활성화 가능). MTF 모드에 대해 더 높은 TF를 선택할 수 있습니다. 기본적으로 레벨은 지그재그 표시 점을 기반으로 생성됩니다. 프랙탈 표시 점은 지그재그와 함께 또는 대신 사용할 수도 있습니다. 사용을 단순화하고 CPU 시간을 절약하기 위해 열릴 때 각 막대당 한 번씩 계산이 수행됩니다. 매개변수: ForcedTF - 레벨 계산을 위한 차트 타임프레임(현재와 같거나 초과할 수 있음) MinPipsLevelWidth - 포인트 단위의 최소 레벨 너비(매우 좁은 레벨에 사용) Use ZigZag Extremums points - 지그재그 피크를 사용하여 지원/저항 수준 계산을 활성화/비활성화합니다. Fixed pips range - 지그재그 표시기를 계산하기 위한 최소값과 최대값 사이의 거리
    US30NinjaMT5
    Satyaseelan Shankarananda Moodley
    US30 Ninja is a 5 minute scalping indicator that will let know you when there is a trade set up (buy or sell). Once the indicator gives the trade direction, you can open a trade and use a 30 pip stop loss and a 30 pip to 50 pip take profit. Please trade at own own risk. This indicator has been created solely for the US30 market and may not yield positive results on any other pair. 
    거래 세션 표시기는 각 거래 세션의 시작과 끝을 강조 표시합니다 . 제품의 유료 버전은 세션의 시작/끝을 사용자 정의 할 수있는 가능성 무료 입니다. [옵션:] Asian session Open Asian session Close Asian session OpenSummertime Asian session CloseSummertime European session Open European session Close European session Open European session Close Timeshift 최상의 결과를 얻으려면 시간대를 사용하십시오. 시간 프레임에 대한 보정을 추가했습니다. 대략적인 수정: Bars           Correction ------------------ 23.50 ____ 10 23.54 ____ 5 23.55 ____ 4(5) 00.05 ____ 5(6) 시장에 나의 다른 제품 https://www.mql5.com/en/users/
    Volality Index Scalper
    Lesedi Oliver Seilane
    5 (1)
    Volality Index scalper indicator  Meant for Volality pairs such as Volality 10, 25, 50, 75 and 100 The indicator works on all timeframes from the 1 minute to the monthly timeframe the indicator is non repaint the indicator has 3 entry settings 1 color change on zero cross 2 color change on slope change 3 color change on signal line cross Orange line is your sell signal Blue line is your buy signal.
    Product overview  The HPL (High Probability Levels) indicator is a cutting-edge trading tool designed to identify high-probability levels in the market using imbalances. By leveraging the concept of imbalances, HPL provides traders with precise insights into potential market reversals and continuations, enhancing trading accuracy and decision-making. Key features  1. Imbalance detection : HPL automatically identifies and marks imbalances on the chart, highlighting areas where the market may seek
    DYJ BoS
    Daying Cao
    DYJ BoS 지표는 다음을 포함하여 시장 구조 변화의 필수 요소를 자동으로 식별하고 표시합니다. 구조 돌파(BoS): 가격이 크게 움직여 이전 구조 지점을 돌파할 때 감지됩니다. 상승 추세선과 하락 추세선(UP & DN, 즉 연속적인 신고가와 신저가)을 표시하고, 가격이 이러한 선을 돌파하면 빨간색(BEAR)과 초록색(BULL) 화살표를 표시합니다. BoS는 일반적으로 가격이 이전 가격 움직임에 의해 확립된 스윙 저점이나 스윙 고점을 확실히 통과할 때 발생합니다. 가격이 스윙 하이보다 높거나 스윙 로우보다 낮게 움직일 경우, 이는 단순히 이전에 형성된 시장 구조를 깨는 것이므로 "브레이크아웃" 구조라고 합니다. 이는 종종 시장 심리와 추세 방향의 변화를 나타내며, 기존 추세가 지속되거나 새로운 추세가 시작됨을 알립니다. 일반적으로 마감 정확도를 높이기 위해 손절매와 이익실현을 설정하지 않는 것이 좋습니다. 최종 포지션은 일반적으로 같은 방향의 다음 돌파점에서 마감되거나 반
    Premium level Pro
    Dmitriy Kashevich
    Premium level is a unique indicator with more than 80% accuracy of correct predictions! This indicator has been tested for more than two months by the best Trading Specialists! The author's indicator you will not find anywhere else! From the screenshots you can see for yourself the accuracy of this tool! 1 is great for trading binary options with an expiration time of 1 candle. 2 works on all currency pairs, stocks, commodities, cryptocurrencies Instructions: As soon as the red arrow app
    Snipeer2
    Ignacio Agustin Mene Franco
    Sniper2 , It has points of lines, with colors that are showing you an entrance, that work as support and resistance! green dotted lines green shows entry for sale, the red dotted lines show a buy entry, pay attention to the supports that work as a break to catch long candles in a longer period of time. works for forex all pairs works for synthetic indices all pairs ! indicator on sale!
    PZ Penta O MT5
    PZ TRADING SLU
    The Penta-O is a 6-point retracement harmonacci pattern which usually precedes big market movements. Penta-O patterns can expand and repaint quite a bit. To make things easier this indicator implements a twist: it waits for a donchian breakout in the right direction before signaling the trade. The end result is an otherwise repainting indicator with a very reliable trading signal. The donchian breakout period is entered as an input. [ Installation Guide | Update Guide | Troubleshooting | FAQ | A
    Trading Utility for Forex Currency Pairs Only not for Gold  Functions Auto Lot Calculation based on Risk Auto stoploss  Auto TakeProfit Breakeven Auto Close Half % Close in percentage with respect to the PIPs Pending Orders BuyLimit Sell Limit with distances BuyStop Sell Stop    with distances Trading Informations Risk in percentage For Multiple trades Combine Takeprofit and Combine Stoplosses
    Blahtech Market Profile MT5
    Blahtech Limited
    5 (10)
    Was: $249  Now: $149   Market Profile defines a number of day types that can help the trader to determine market behaviour. A key feature is the Value Area, representing the range of price action where 70% of trading took place. Understanding the Value Area can give traders valuable insight into market direction and establish the higher odds trade. It is an excellent addition to any system you may be using. Inspired by Jim Dalton’s book “Mind Over Markets”, this indicator is designed to suit the
    HMA Trend Professional MT5
    Pavel Zamoshnikov
    4.25 (4)
    Improved version of the free HMA Trend indicator (for MetaTrader 4) with statistical analysis. HMA Trend is a trend indicator based on the Hull Moving Average (HMA) with two periods. HMA with a slow period identifies the trend, while HMA with a fast period determines the short-term movements and signals in the trend direction. The main differences from the free version: Ability to predict the probability of a trend reversal using analysis of history data. Plotting statistical charts for analyzi
    Renko Gold
    Ignacio Agustin Mene Franco
    Renko Gold! clearly indicates the floors and ceilings where it goes from 4 lines, the line below that marks the floor in green confirming with the thinnest line clarifies the purchase entry, the same is for sale, the top line marks the ceiling and the thinnest red line marks the sale, This indicator works for all temporalities! For Forex and Synthetic Indices markets! It also works for crypto markets! Good profit! World Investor.
    Trend Monitor MT5
    Pavel Zamoshnikov
    4.5 (2)
    The indicator generates early signals basing on ADX reading data combined with elements of price patterns. Works on all symbols and timeframes. The indicator does not redraw its signals. You see the same things on history and in real time. For better visual perception signals are displayed as arrows (in order not to overload the chart). Features The best results are obtained when the indicator works on two timeframes. For example: M30 – the indicator shows the main trend; M5 – the indicator gen
    Your Trend Friend
    Luigi Nunes Labigalini
    5 (1)
    The trend is your friend! Look at the color of the indicator and trade on that direction. It does not  repaint. After each candle is closed, that's the color of the trend. You can focus on shorter faster trends or major trends, just test what's most suitable for the symbol and timeframe you trade. Simply change the "Length" parameter and the indicator will automatically adapt. You can also change the color, thickness and style of the lines. Download and give it a try! There are big movements w
    Trend Master Chart MT5
    Frederic Jacques Collomb
    Trend Master Chart는 귀하에게 필요한 추세 지표입니다. 차트를 오버레이하고 색상 코딩을 사용하여 다양한 시장 동향/움직임을 정의합니다. 두 개의 이동 평균과 서로 다른 오실레이터를 결합하는 알고리즘을 사용합니다. 이 세 가지 요소의 기간은 수정 가능합니다. 모든 시간대와 모든 쌍에서 작동합니다. 한 눈에 상승 또는 하락 추세와 이 추세의 다양한 진입점을 식별할 수 있습니다. 예를 들어 뚜렷한 상승 추세(밝은 녹색) 동안 이 추세 내의 다양한 시장 충동은 짙은 녹색 양초로 표시됩니다. 구성 가능한 경고를 사용하면 이러한 충동 중 하나를 놓치지 않을 수 있습니다. MT4 버전. 입력 매개변수: Period 1: 빠른 기간 이동 평균. Period 2: 느린 기간 이동 평균. Oscillator period: 오실레이터 기간. Sell/Buy alert: 시장 충동 경고, 추세 진입점. Bullish/Bearish alert: 추세 변화가 있을 경우
    Laguerre SuperTrend Clouds   adds an Adaptive Laguerre averaging algorithm and alerts to the widely popular SuperTrend indicator. As the name suggests,   Laguerre SuperTrend Clouds (LSC)   is a trending indicator which works best in trendy (not choppy) markets. The SuperTrend is an extremely popular indicator for intraday and daily trading, and can be used on any timeframe. Incorporating Laguerre's equation to this can facilitate more robust trend detection and smoother filters. The LSC uses the
    Mine Farm
    Maryna Kauzova
    Mine Farm is one of the most classic and time-tested scalping strategies based on the breakdown of strong price levels. Mine Farm is the author's modification of the system for determining entry and exit points into the market... Mine Farm - is the combination of great potential with reliability and safety. Why Mine Farm?! - each order has a short dynamic Stop Loss - the advisor does not use any risky methods (averaging, martingale, grid, locking, etc.) - the advisor tries to get the most
    This indicator obeys the popular maxim that: "THE TREND IS YOUR FRIEND" It paints a Blue line for BUY and also paints a RED line for SELL. (you can change the colors). It gives alarms and alerts of all kinds. can be used for all currency pairs and timeframes. Yes, as easy and simple as that. Even a newbie can use it to make great and reliable trades. MetaTrader 4 Version    
    Crypto to MT5
    Rajesh Kumar Nait
    크립토닷컴에서 MT5로 Crypto.com websocket에서 Metatrader 5로 라이브 촛대 스트리밍 OHCLV(시가 고가 저가 종가) 실시간 요금 데이터입니다.  트레이더, 분 차트에서 OHLC 데이터가 정확하지 않으면 기술 차트 연구에서 잘못된 분석을 제공할 수 있습니다. 이 제품은 수동 분석에 도움이 될 수 있는 실시간으로 정확한 데이터를 제공하도록 보장합니다. 내 프로필 https://www.mql5.com/en/users/rajeshnait/seller에서 내 다른 암호화 제품을 확인할 수 있습니다. 1. OHLCV 데이터 2. 여러 심볼 지원 및 생성 3. 도구 > 옵션 > URL 탭에서 웹 요청 허용에서 언급한 대로 바이낸스 웹 소켓 및 API URL을 추가하고 웹 요청 허용 확인란을 선택해야 합니다. - 웹소켓 URL : stream.crypto.com - API URL : api.crypto.com 4. 차트는 GMT+0 시간대(Crypt
    Better RSI MT5
    KO PARTNERS LTD
    This Indicator enhances the default Relative Strength Index (RSI) by introducing several improvements. First, it visually highlights overbought and oversold regions by changing the RSI color from white to red. Second, it includes additional reference lines at 20, 40, 50, 60, and 80, providing a clearer framework for assessing RSI values. The most notable feature is the use of the middle 50-line to indicate the current market cycle. The color of the 50-line dynamically reflects the cycle: green f
    Maximum Trend Arrows OT MT5
    Mulweli Valdaz Makulana
    STRICTLY FOR BOOM INDEX ONLY!!!!! Here I bring the Maximum Trend Arrows OT1.0 MT5 indicator. This indicator is made up of a combination of different trend indicators for entries and exits, for entries an orange arrow will paint on the chart below the current market and a red flag for closing of trades and it produces buy arrows only. When the orange arrow appears, it will appear along with it's sound to notify you. The 1H timeframe is recommended, don't use it anywhere else than on the 1H timefr
    숫자 시퀀스 중 하나를 "산불 시퀀스"라고 합니다. 가장 아름다운 새로운 시퀀스 중 하나로 인식되었습니다. 주요 특징은 이 시퀀스가 ​​가장 짧은 경우에도 선형 추세를 피한다는 것입니다. 이 지표의 기초를 형성한 것은 이 속성입니다. 금융 시계열을 분석할 때 이 지표는 가능한 모든 추세 옵션을 거부하려고 합니다. 그리고 그가 실패하는 경우에만 그는 추세의 존재를 인식하고 적절한 신호를 제공합니다. 이 접근 방식을 통해 새로운 트렌드가 시작되는 순간을 정확하게 결정할 수 있습니다. 그러나 거짓 긍정도 가능합니다. 숫자를 줄이기 위해 이 표시기에 추가 필터가 추가되었습니다. 새 막대가 열리면 신호가 생성됩니다. 어떤 경우에도 다시 그리기가 발생하지 않습니다. 표시 매개변수: Applied Price   - 적용된 가격 상수. Period Main   - 표시기의 기본 기간, 유효한 값은 5 - 60 이내입니다. Period Additional   - 추가 기간, 이 매개변수의 유효한
    This indicator displays pivot points in the chart, including historical vales, and supports many calculation modes for Pivot Points and S/R levels. [ Installation Guide | Update Guide | Troubleshooting | FAQ | All Products ] It plots historical levels for backtesting purposes It allows you to select the reference timeframe It implements different Pivot Point calculation modes It implements different SR calculation modes It implements customizable colors and sizes Calculation Modes The indicato
    PZ Chart Overlay MT5
    PZ TRADING SLU
    4 (1)
    Master the market: harness the power of statistical arbitrage This indicator showcases the price action of multiple instruments on a single chart, enabling you to compare the fluctuations of different assets and seamlessly implement statistical arbitrage strategies. Its main usage is to find correlated symbols which are temporarily out of whack. [ Installation Guide | Update Guide | Troubleshooting | FAQ | All Products ] Find overbought or oversold currency pairs easily Plot up to six currency
    Are you tired of the uncertainty that arises when your orders fail to stop at a specific line due to the spread? Look no further! Introducing our  indicator that plots candlesticks based on the Ask price instead of the traditional bid-based chart commonly used in MQL4. With this indicator, you can say goodbye to the frustrations caused by the bid-based chart, as it provides you with a more accurate representation of market movements. By utilizing the Ask price, which represents the price at whic
    이 제품의 구매자들이 또한 구매함
    Trend Screener Pro MT5
    STE S.S.COMPANY
    4.89 (74)
    트렌드 표시기, 트렌드 트레이딩 및 필터링을 위한 획기적인 고유 솔루션, 하나의 도구 안에 내장된 모든 중요한 트렌드 기능! Forex, 상품, 암호 화폐, 지수 및 주식과 같은 모든 기호/도구에 사용할 수 있는 100% 다시 칠하지 않는 다중 시간 프레임 및 다중 통화 표시기입니다. Trend Screener는 차트에 점이 있는 화살표 추세 신호를 제공하는 효율적인 지표 추세 추종 지표입니다. 추세 분석기 표시기에서 사용할 수 있는 기능: 1. 트렌드 스캐너. 2. 최대 이익 분석이 있는 추세선. 3. 추세 통화 강도 측정기. 4. 경고가 있는 추세 반전 점. 5. 경고가 있는 강력한 추세 점. 6. 추세 화살표 Trend Screener Indicator가 있는 일일 분석 예, 일일 신호 성능...등은 여기에서 찾을 수 있습니다. 여기를 클릭하십시오. LIMITED TIME OFFER : Trend Screener Indicator는 50$ 및 평생 동안만 사용할 수 있습니다.
    Golden Trend Indicator MT5
    Noha Mohamed Fathy Younes Badr
    4.88 (16)
    Golden Trend indicator  is The best indicator for predicting trend movement this indicator never lags and never repaints and never back paints    and give  arrow buy and sell    before the candle appear  and it will help you and  will make your trading decisions clearer its work on all currencies and  gold and crypto and all time frame This unique  indicator uses very secret algorithms to catch the  trends, so you can trade using this indicator and see the trend clear on charts  manual guide and
    FX Levels MT5
    Daniel Stein
    5 (3)
    FX Levels: 모든 시장을 위한 뛰어난 정확도의 지지와 저항 간단 요약 통화쌍, 지수, 주식, 원자재 등 어떤 시장이든 믿을 만한 지지·저항 레벨을 찾고 싶나요? FX Levels 는 전통적인 “Lighthouse” 기법과 첨단 동적 접근을 결합해, 거의 보편적인 정확성을 제공합니다. 실제 브로커 경험을 반영하고, 자동화된 일별 업데이트와 실시간 업데이트를 결합함으로써 FX Levels 는 가격 반전 포인트를 파악하고, 수익 목표를 설정하며, 자신 있게 트레이드를 관리할 수 있게 돕습니다. 지금 바로 시도해 보세요—정교한 지지/저항 분석이 어떻게 여러분의 트레이딩을 한 단계 끌어올릴 수 있는지 직접 확인하세요! 1. FX Levels가 트레이더에게 매우 유용한 이유 뛰어난 정확도의 지지·저항 존 • FX Levels 는 다양한 브로커 환경에서도 거의 동일한 존을 생성하도록 설계되어, 데이터 피드나 시간 설정 차이로 인한 불일치를 해소합니다. • 즉, 어떤 브로커를 사용하
    IX Power MT5
    Daniel Stein
    4.83 (6)
    IX Power: 지수, 원자재, 암호화폐 및 외환 시장 통찰력을 발견하세요 개요 IX Power 는 지수, 원자재, 암호화폐 및 외환 시장의 강도를 분석할 수 있는 다목적 도구입니다. FX Power 는 모든 가용 통화 쌍 데이터를 사용하여 외환 쌍에 대해 가장 높은 정확도를 제공하는 반면, IX Power 는 기초 자산 시장 데이터에만 초점을 맞춥니다. 이로 인해 IX Power 는 비외환 시장에 이상적이며, 다중 쌍 분석이 필요하지 않은 간단한 외환 분석에도 신뢰할 수 있는 도구입니다. 모든 차트에서 매끄럽게 작동하며, 거래 결정을 향상시키기 위한 명확하고 실행 가능한 통찰력을 제공합니다. 1. IX Power가 트레이더에게 유용한 이유 다양한 시장 강도 분석 • IX Power 는 지수, 원자재, 암호화폐 및 외환 심볼의 강도를 계산하여 각 시장에 맞는 통찰력을 제공합니다. • US30, WTI, 금, 비트코인 또는 통화 쌍과 같은 자산을 모니터링하여 거래 기회를 발견
    FX Volume MT5
    Daniel Stein
    4.82 (17)
    FX Volume: 브로커 시각에서 바라보는 진짜 시장 심리 간단 요약 트레이딩 접근 방식을 한층 더 향상시키고 싶으신가요? FX Volume 는 소매 트레이더와 브로커의 포지션을 실시간으로 파악할 수 있게 해 줍니다. 이는 COT 같은 지연된 보고서보다 훨씬 빠릅니다. 꾸준한 수익을 추구하는 분이든, 시장에서 더 깊은 우위를 원하시는 분이든, FX Volume 을 통해 대규모 불균형을 찾아내고, 돌파 여부를 확인하며 리스크 관리를 정교화할 수 있습니다. 지금 시작해 보세요! 실제 거래량 데이터가 의사결정을 어떻게 혁신할 수 있는지 직접 경험해 보시기 바랍니다. 1. 트레이더에게 FX Volume이 매우 유익한 이유 탁월한 정확도를 지닌 조기 경보 신호 • 다른 사람들보다 훨씬 앞서, 각 통화쌍을 매수·매도하는 트레이더 수를 거의 실시간으로 파악할 수 있습니다. • FX Volume 은 여러 리테일 브로커에서 추출한 실제 거래량 데이터를 종합해 명확하고 편리한 형태로 제공하는
    FX Power MT5 NG
    Daniel Stein
    5 (11)
    FX Power: 통화 강세 분석으로 더 스마트한 거래 결정을 개요 FX Power 는 어떤 시장 상황에서도 주요 통화와 금의 실제 강세를 이해하기 위한 필수 도구입니다. 강한 통화를 매수하고 약한 통화를 매도함으로써 FX Power 는 거래 결정을 단순화하고 높은 확률의 기회를 발견합니다. 트렌드를 따르거나 극단적인 델타 값을 사용해 반전을 예측하고자 한다면, 이 도구는 귀하의 거래 스타일에 완벽히 적응합니다. 단순히 거래하지 말고, FX Power 로 더 스마트하게 거래하세요. 1. FX Power가 거래자에게 매우 유용한 이유 통화와 금의 실시간 강세 분석 • FX Power 는 주요 통화와 금의 상대적 강세를 계산하고 표시하여 시장 역학에 대한 명확한 통찰력을 제공합니다. • 어떤 자산이 앞서고 있고 어떤 자산이 뒤처지는지 모니터링하여 보다 현명한 거래 결정을 내릴 수 있습니다. 포괄적인 멀티 타임프레임 뷰 • 단기, 중기 및 장기 타임프레임에서 통화와 금의 강세를
    CBT Quantum Maverick 고효율 바이너리 옵션 거래 시스템 CBT Quantum Maverick는 정밀하고 간단하며 체계적인 거래를 원하는 트레이더를 위해 설계된 고성능 바이너리 옵션 거래 시스템입니다. 사용자 지정이 필요 없으며, 처음부터 최적화된 결과를 제공합니다. 약간의 연습만으로 신호를 쉽게 마스터할 수 있습니다. 주요 특징: 정확한 신호 제공: 현재 봉 데이터를 기반으로 다음 캔들에 대한 신호를 생성하며, 빈번한 재도색이 없습니다. 다양한 시장에 대한 적응성: 바이너리 옵션 거래에 특화되었으며, 여러 브로커 및 자산 클래스와 호환됩니다. 호환 가능: Deriv Synthetic Charts: 모든 시간 프레임에서 사용 가능. OTC 차트: Quotex, PocketOption, Binomo, Stockity, IQOption, Exnova, OlympTrade, Deriv, Binolla, Homebroker 등의 브로커와 호환(MT5로의 무료 데이터 임
    TPSproTREND PrO MT5
    Roman Podpora
    4.69 (16)
    TPSpro TREND PRO  - is a trend indicator that automatically analyzes the market and provides information about the trend and each of its changes, as well as giving signals for entering trades without redrawing! The indicator uses each candle, analyzing them separately. referring to different impulses - up or down impulse. Exact entry points into transactions for currencies, crypto, metals, stocks, indices!  ИНСТРУКЦИЯ RUS         INSTRUCTIONS  ENG       R ecommended to use with an indicator   -
    FX Dynamic: 맞춤형 ATR 분석으로 변동성과 트렌드를 파악하세요 개요 FX Dynamic 는 Average True Range(ATR) 계산을 활용하여 트레이더에게 일간 및 일중 변동성에 대한 뛰어난 인사이트를 제공하는 강력한 도구입니다. 80%, 100%, 130%와 같은 명확한 변동성 임계값을 설정함으로써 시장이 평소 범위를 초과할 때 빠르게 경고를 받고, 유망한 수익 기회를 재빨리 식별할 수 있습니다. FX Dynamic 는 브로커의 시간대를 인식하거나 수동으로 조정할 수 있으며, 변동성 측정 기준을 일관되게 유지하며, MetaTrader 플랫폼과 완벽하게 연동되어 실시간 분석을 지원합니다. 1. FX Dynamic이 트레이더에게 매우 유용한 이유 실시간 ATR 인사이트 • 하루 및 일중 변동성을 한눈에 모니터링하세요. ATR의 80%, 100%, 130% 임계값이 도달 또는 초과되면, 시장의 중요한 지점에 있음을 알 수 있습니다. • 변동성이 완전히 폭발하기
    Entry Points Pro for MT5
    Yury Orlov
    4.46 (130)
    다시 색을 칠하지 않고 거래에 진입할 수 있는 정확한 신호를 제공하는 MT5용 지표입니다. 외환, 암호화폐, 금속, 주식, 지수 등 모든 금융 자산에 적용할 수 있습니다. 매우 정확한 추정값을 제공하고 매수와 매도의 가장 좋은 시점을 알려줍니다. 하나의 시그널로 수익을 내는 지표의 예와 함께 비디오 (6:22)시청하십시오! 대부분의 거래자는 Entry Points Pro 지표의 도움으로 첫 거래 주 동안 트레이딩 결과를 개선합니다. 저희의   Telegram Group 을 구독하세요! Entry Points Pro 지표의 좋은점. 재도색이 없는 진입 신호 신호가 나타나고 확인되면(시그널 캔들이 완성된 경우) 신호는 더 이상 사라지지 않습니다. 여타 보조지표의 경우 신호를 표시한 다음 제거되기 때문에 큰 재정적 손실로 이어집니다. 오류 없는 거래 게시 알고리즘을 통해 트레이드(진입 또는 청산)를 할 이상적인 순간을 찾을 수 있으며, 이를 통해 이를 사용하는 모든 거래자의 성공률이
    Basic Harmonic Patterns Dashboard MT5
    Mehran Sepah Mansoor
    4.57 (7)
    이 대시보드는 선택한 심볼에 대해 사용 가능한 최신 고조파 패턴을 표시하므로 시간을 절약하고 더 효율적으로 사용할 수 있습니다 /   MT4 버전 . 무료 인디케이터:   Basic Harmonic Pattern 인디케이터 열 Symbol :   선택한 심볼이 나타납니다 Trend :   강세 또는 약세 Pattern :   패턴 유형(가틀리, 나비, 박쥐, 게, 상어, 사이퍼 또는 ABCD) Entry :   진입 가격 SL:   스톱로스 가격 TP1:   1차 테이크프로핏 가격 TP2:   2차 테이크프로핏 가격 TP3:   3차 테이크프로핏 가격 Current price:   현재 가격 Age (in bars):   마지막으로 그려진 패턴의 나이 주요 입력 Symbols :   "28개 주요 통화쌍" 또는 "선택한 심볼" 중에서 선택합니다. Selected Symbols :   쉼표로 구분하여 모니터링하려는 원하는 심볼("EURUSD,GBPUSD,XAUUSD")을 선택
    Matrix Arrow Indicator MT5
    Juvenille Emperor Limited
    5 (13)
    매트릭스 화살표 표시기 MT5 는 외환, 상품, 암호 화폐, 지수, 주식과 같은 모든 기호/도구에 사용할 수 있는 100% 다시 칠하지 않는 다중 기간 표시기를 따르는 고유한 10 in 1 추세입니다.  Matrix Arrow Indicator MT5 는 다음과 같은 최대 10개의 표준 지표에서 정보와 데이터를 수집하여 초기 단계에서 현재 추세를 결정합니다. 평균 방향 이동 지수(ADX) 상품 채널 지수(CCI) 클래식 하이켄 아시 캔들 이동 평균 이동 평균 수렴 발산(MACD) 상대 활력 지수(RVI) 상대 강도 지수(RSI) 포물선 SAR 스토캐스틱 오실레이터 윌리엄스의 백분율 범위 모든 지표가 유효한 매수 또는 매도 신호를 제공하면 강력한 상승/하락 추세를 나타내는 다음 캔들/막대가 시작될 때 해당 화살표가 차트에 인쇄됩니다. 사용자는 사용할 표시기를 선택하고 각 표시기의 매개변수를 개별적으로 조정할 수 있습니다. 매트릭스 화살표 표시기 MT5는 선택한 표시기에서만 정보를 수
    Gartley Hunter Multi
    Siarhei Vashchylka
    5 (9)
    Gartley Hunter Multi - An indicator for searching for harmonic patterns simultaneously on dozens of trading instruments and on all possible timeframes. Manual (Be sure to read before purchasing) | Version for MT4 Advantages 1. Patterns: Gartley, Butterfly, Shark, Crab. Bat, Alternate Bat, Deep Crab, Cypher 2. Simultaneous search for patterns on dozens of trading instruments and on all possible timeframes 3. Search for patterns of all possible sizes. From the smallest to the largest 4. All fou
    Gold Stuff mt5
    Vasiliy Strukov
    4.92 (173)
    Gold Stuff mt5는 금을 위해 특별히 설계된 추세 지표이며 모든 금융 상품에서도 사용할 수 있습니다. 표시기가 다시 그려지지 않고 지연되지 않습니다. 권장 기간 H1. 설정 및 개인 보너스를 받으려면 구매 후 즉시 저에게 연락하십시오!     강력한 지원 및 트렌드 스캐너 표시기의 무료 사본을 받으실 수 있습니다. 메시지를 보내주세요. 나!   설정 화살표 그리기 - 켜기 끄기. 차트에 화살표 그리기. 경고 - 가청 경고를 끕니다. 이메일 알림 - 켜기 끄기. 이메일 알림. Puch-notification - 켜기 끄기. 푸시 알림. 다음으로 색 영역을 조정합니다. Gold Stuff mt5는 금을 위해 특별히 설계된 추세 지표이며 모든 금융 상품에서도 사용할 수 있습니다. 표시기가 다시 그려지지 않고 지연되지 않습니다. 권장 기간 H1. 설정 및 개인 보너스를 받으려면 구매 후 즉시 저에게 연락하십시오!   설정 화살표 그리기 - 켜기 끄기. 차트에 화살표 그
    TPSpro RFI Levels MT5
    Roman Podpora
    4.53 (19)
    지침         러시아   -        영어       표시기와 함께 사용하는 것이 좋습니다   .       -       TPSpro   트렌드 프로 -   MT4 버전         거래에서 핵심 요소는 거래 상품을 매수 또는 매도하기로 결정하는 구역 또는 수준입니다. 주요 업체가 시장에서 자신의 존재를 숨기려는 시도에도 불구하고, 그들은 필연적으로 흔적을 남깁니다. 우리의 과제는 이러한 흔적을 식별하고 올바르게 해석하는 방법을 배우는 것이었습니다. 주요 기능:: 판매자와 구매자를 위한 활성 영역을 표시합니다! 이 지표는 매수 및 매도를 위한 모든 올바른 초기 임펄스 레벨/존을 보여줍니다. 진입점 검색이 시작되는 이러한 레벨/존이 활성화되면 레벨의 색상이 바뀌고 특정 음영으로 채워집니다. 또한 상황을 보다 직관적으로 이해하기 위해 화살표가 나타납니다. 더 높은 시간대의 레벨/존 표시(MTF 모드) 더 높은 시간 간격을 사용하여 레벨/존을 표시하는 기능을 추가했습니다.
    우선적으로, 이 거래 도구는 전문적인 거래에 이상적인 비-다시 그리기 및 지연되지 않는 지표입니다.  온라인 강좌, 사용자 매뉴얼 및 데모. 스마트 가격 액션 컨셉트 인디케이터는 신규 및 경험 많은 트레이더 모두에게 매우 강력한 도구입니다. Inner Circle Trader Analysis 및 Smart Money Concepts Trading Strategies와 같은 고급 거래 아이디어를 결합하여 20가지 이상의 유용한 지표를 하나로 결합합니다. 이 인디케이터는 스마트 머니 컨셉트에 중점을 두어 대형 기관의 거래 방식을 제공하고 이동을 예측하는 데 도움을 줍니다.  특히 유동성 분석에 뛰어나 기관이 어떻게 거래하는지 이해하는 데 도움을 줍니다. 시장 트렌드를 예측하고 가격 변동을 신중하게 분석하는 데 탁월합니다. 귀하의 거래를 기관 전략에 맞추어 시장의 동향에 대해 더 정확한 예측을 할 수 있습니다. 이 인디케이터는 시장 구조를 분석하고 중요한 주문 블록을 식별하고 다양
    Atomic Analyst MT5
    Issam Kassas
    4.32 (19)
    우선적으로 언급할 점은이 거래 지표가 다시 그리지 않고 지연되지 않으며 이를 통해 수동 및 로봇 거래 모두에 이상적이라는 점입니다. 사용자 매뉴얼: 설정, 입력 및 전략. Atomic Analyst는 가격의 강도와 모멘텀을 활용하여 시장에서 더 나은 이점을 찾는 PA Price Action Indicator입니다. 고급 필터를 장착하여 잡음과 거짓 신호를 제거하고 거래 잠재력을 높이는 데 도움이 됩니다. 복잡한 지표의 다중 레이어를 사용하여 Atomic Analyst는 차트를 스캔하고 복잡한 수학적 계산을 간단한 신호와 색상으로 변환하여 초보 트레이더가 이해하고 일관된 거래 결정을 내릴 수 있도록합니다. "Atomic Analyst"는 새로운 및 경험이 풍부한 트레이더를위한 종합적인 거래 솔루션입니다. 프리미엄 지표와 최고 수준의 기능을 하나의 거래 전략에 결합하여 모든 종류의 트레이더에 대한 다재다능한 선택지가되었습니다. 인트라데이 거래 및 스캘핑 전략 : 빠르고 정확한 일일
    Bill Williams Advanced
    Siarhei Vashchylka
    5 (9)
    Bill Williams Advanced is designed for automatic chart analysis using Bill Williams' "Profitunity" system. The indicator analyzes four timeframes at once. Manual (Be sure to read before purchasing) Advantages 1. Automatically analyzes the chart using the "Profitunity" system of Bill Williams. The found signals are placed in a table in the corner of the screen. 2. Equipped with a trend filter based on the Alligator indicator. Most of the system signals are recommended to be used only according t
    Support And Resistance Screener는 하나의 지표 안에 여러 도구를 제공하는 MetaTrader에 대한 하나의 레벨 지표입니다. 사용 가능한 도구는 다음과 같습니다. 1. 시장 구조 스크리너. 2. 완고한 후퇴 영역. 3. 약세 후퇴 영역. 4. 일일 피벗 포인트 5. 주간 피벗 포인트 6. 월간 피벗 포인트 7. 고조파 패턴과 볼륨에 기반한 강력한 지지와 저항. 8. 은행 수준 구역. LIMITED TIME OFFER : HV 지원 및 저항 표시기는 50 $ 및 평생 동안만 사용할 수 있습니다. ( 원래 가격 125$ ) MQL5 블로그에 액세스하면 분석 예제와 함께 모든 프리미엄 지표를 찾을 수 있습니다. 여기를 클릭하십시오. 주요 특징들 고조파 및 볼륨 알고리즘을 기반으로 하는 강력한 지원 및 저항 영역. Harmonic 및 Volume 알고리즘을 기반으로 한 강세 및 약세 풀백 영역. 시장 구조 스크리너 일간, 주간 및 월간 피벗 포인트. 실제 거래의
    Quantum Trend Sniper
    Bogdan Ion Puscasu
    4.73 (51)
    소개       Quantum Trend Sniper Indicator는   추세 반전을 식별하고 거래하는 방식을 변화시키는 획기적인 MQL5 지표입니다! 13년 이상의 거래 경험을 가진 숙련된 트레이더 팀이 개발한       Quantum Trend Sniper 표시기       매우 높은 정확도로 추세 반전을 식별하는 혁신적인 방법으로 거래 여정을 새로운 차원으로 끌어올리도록 설계되었습니다. ***Quantum Trend Sniper Indicator를 구입하면 Quantum Breakout Indicator를 무료로 받을 수 있습니다!*** Quantum Trend Sniper Indicator는 추세 반전을 식별하고 세 가지 이익실현 수준을 제안할 때 경고, 신호 화살표를 제공합니다. 초보자 거래자와 전문 거래자 모두에게 적합합니다. Quantum EA 채널:       여기를 클릭하세요 MT4 버전:       여기를 클릭하세요 추천: 기간:모든 기간.
    RelicusRoad Pro MT5
    Relicus LLC
    4.78 (18)
    이제 $ 147 (몇 가지 업데이트 후 $ 499 증가) - 무제한 계정 (PCS 또는 MACS) RelicusRoad 사용 설명서 + 교육 비디오 + 비공개 Discord 그룹 액세스 + VIP 상태 시장을 보는 새로운 방법 RelicusRoad는 외환, 선물, 암호화폐, 주식 및 지수에 대한 세계에서 가장 강력한 거래 지표로서 거래자에게 수익성을 유지하는 데 필요한 모든 정보와 도구를 제공합니다. 우리는 초보자부터 고급까지 모든 거래자가 성공할 수 있도록 기술적 분석 및 거래 계획을 제공합니다. 미래 시장을 예측할 수 있는 충분한 정보를 제공하는 핵심 거래 지표입니다. 우리는 차트에서 말이 안 되는 여러 지표 대신 완전한 솔루션을 믿습니다. 타의 추종을 불허하는 매우 정확한 신호, 화살표 + 가격 조치 정보를 표시하는 올인원 표시기입니다. 강력한 AI를 기반으로 하는 RelicusRoad는 누락된 정보와 도구를 제공하여 교육하고 성공적인 트레이더인 트레이딩 전문가가 되도
    Quantum TrendPulse
    Bogdan Ion Puscasu
    5 (13)
    SuperTrend   ,   RSI   ,   Stochastic   의 힘을 하나의 포괄적인 지표로 결합하여 트레이딩 잠재력을 극대화하는 궁극의 트레이딩 도구   인 Quantum TrendPulse를   소개합니다. 정밀성과 효율성을 추구하는 트레이더를 위해 설계된 이 지표는 시장 추세, 모멘텀 변화, 최적의 진입 및 종료 지점을 자신 있게 식별하는 데 도움이 됩니다. 주요 특징: SuperTrend 통합:   주요 시장 추세를 쉽게 따라가고 수익성의 물결을 타세요. RSI 정밀도:   매수 과다 및 매도 과다 수준을 감지하여 시장 반전 시점을 파악하는 데 적합하며 SuperTrend 필터로 사용 가능 확률적 정확도:   변동성이 큰 시장에서 숨겨진 기회를 찾기 위해 확률적 진동   을 활용하고 SuperTrend의 필터로 사용 다중 시간대 분석:   M5부터 H1 또는 H4까지 다양한 시간대에 걸쳐 시장을 최신 상태로 유지하세요. 맞춤형 알림:   맞춤형 거래 조건이 충족되면
    TW Trend Scalper Indicator: The TW Scalper Shoot는 최신 거래 전략과 인공지능 기술을 활용하여 독특한 거래 경험을 제공합니다. 이 제품은 두 가지 뚜렷한 신호 범주를 제공하여 스캘퍼 트레이더의 다양한 요구를 충족합니다. 오늘 이 특별한 제품을 테스트하고 트렌드 스캘퍼가 되는 독특한 경험을 시작하세요. 또한, $37 상당의 제품을 선물로 받으세요. 신호 범주: 1. 장기적이고 안전한 신호: 이러한 신호는 가격 행동 전략(스마트 머니 규칙), 피보나치 수준, 지원 및 저항 수준, 이동 평균을 사용하여 식별됩니다. 이 범주의 신호는 빨간색과 파란색 화살표 및 특정 목표와 함께 표시되어 장기적이고 신뢰할 수 있는 거래를 원하는 트레이더에게 이상적입니다. 2. 스캘핑 신호(전문 스캘퍼용): 앞서 언급한 전략 외에도 이러한 신호는 독점적인 Trade Wizards 지표 공식과 AI 노이즈 감소 방법도 활용합니다. 스캘핑 신호는 신뢰할 수 있는
    ON Trade Gann Squares MT5
    Abdullah Alrai
    5 (2)
    간 스퀘어 지표는 W.D. 간이 쓴 "시장 예측을 위한 수학적 공식" 기사에 기반한 강력한 시장 분석 도구입니다. 이 도구는 수학적 개념과 간 이론을 사용하여 정확한 시장 분석을 수행합니다. 144, 90, 52의 제곱과 9의 제곱을 사용합니다. 또한 의 9의 제곱근 및 해당 제곱의 채널 및 스타 패턴과의 관련성을 통합합니다. 사용자 메뉴얼 및 적용: 이 지표를 사용하기 전에 사용자 메뉴얼을 읽고 질문이 있을 경우 문의하시기 바랍니다. 전체 메뉴얼은 웹사이트에서 제공됩니다. MT5의 전체 버전을 구매하거나 MT4의 무료 버전을 테스트할 수 있습니다. 두 버전 모두 링크에서 확인하실 수 있습니다. 주요 기능 및 기능: 간 스퀘어 지표는 정확한 결정을 위해 기하학적 개념과 간 이론을 활용하는 시장 분석을 위한 포괄적인 도구 집합을 제공합니다. 주요 기능은 다음과 같습니다. 9의 제곱 분석:   이 지표는 9의 제곱에 대한 수평 선, 스타 패턴, 그리드 및 간 팬을 그릴 수 있습니다. 간
    ICT, SMC, SMART MONEY CONCEPTS, SMART MONEY, Smart Money Concept, Support and Resistance, Trend Analysis, Price Action, Market Structure, Order Blocks, BOS/CHoCH,   Breaker Blocks ,  Momentum Shift,   Supply&Demand Zone/Order Blocks , Strong Imbalance,   HH/LL/HL/LH,    Fair Value Gap, FVG,  Premium  &   Discount   Zones, Fibonacci Retracement, OTE, Buy Side Liquidity, Sell Side Liquidity, BSL/SSL Taken, Equal Highs & Lows, MTF Dashboard, Multiple Time Frame, BigBar, HTF OB, HTF Market Structure
    BookMap HeatMap
    Roberto Spadim
    1 (2)
    This Indicator creates a heatmap based on depth of market of the current symbol or another symbol. Other symbol is useful when you trade futures market and a contract has 'mini' and 'full' split. For example, in Brazil (B3 - BMF&Bovespa), WDO and DOL are future Forex contract of BRL/USD (where 1 DOL = 5 WDO) and big banks work mostly with DOL (where liquidity is important). Please use with M1 timeframe , objects are too small to be displayed at higher timeframes (MT5 limit). The number of level
    Berma Bands
    Muhammad Elbermawi
    5 (3)
    Berma Bands(BBs) 지표는 시장 동향을 파악하고 이를 활용하려는 트레이더에게 귀중한 도구입니다. 가격과 BBs 간의 관계를 분석함으로써 트레이더는 시장이 추세 단계인지 범위 단계인지를 분별할 수 있습니다. 자세한 내용을 알아보려면 [ Berma Home Blog ]를 방문하세요. 버마 밴드는 세 개의 뚜렷한 선으로 구성되어 있습니다. 어퍼 버마 밴드, 미들 버마 밴드, 로어 버마 밴드입니다. 이 선들은 가격 주위에 그려져 전체 추세에 대한 가격 움직임을 시각적으로 표현합니다. 이 밴드들 사이의 거리는 변동성과 잠재적인 추세 반전에 대한 통찰력을 제공할 수 있습니다. 버마 밴드 라인이 각각에서 분리될 때, 그것은 종종 시장이 횡보 또는 범위 이동 기간에 접어들고 있음을 시사합니다. 이는 명확한 방향 편향이 없음을 나타냅니다. 트레이더는 이러한 기간 동안 추세를 파악하기 어려울 수 있으며 더 명확한 추세가 나타날 때까지 기다릴 수 있습니다. 버마 밴드 라인이 단일 라인으로
    Gold Trend 5
    Sergei Linskii
    3.5 (2)
    금 추세 - 좋은 주식 기술 지표입니다. 인디케이터 알고리즘은 자산의 가격 움직임을 분석하고 변동성과 잠재적 진입 구간을 반영합니다. 최고의 지표 신호: - 매도 = 빨간색 히스토그램 + 빨간색 숏 포인터 + 같은 방향의 노란색 신호 화살표. - 매수 = 파란색 히스토그램 + 파란색 롱 포인터 + 같은 방향의 아쿠아 신호 화살표. 인디케이터의 장점 1. 표시기는 높은 정확도로 신호를 생성합니다. 2. 확인된 화살표 신호는 추세가 바뀔 때만 다시 그릴 수 있습니다. 3. 모든 브로커의 메타트레이더 5 거래 플랫폼에서 거래할 수 있습니다. 4. 모든 자산(통화, 금속, 암호화폐, 주식, 지수 등)을 거래할 수 있습니다. 5. H1 차트주기(중기 트레이딩)에서 거래하는 것이 좋습니다. 6. 지표 설정에서 개별 매개 변수(TF, 색상 등)를 변경할 수 있으므로 각 트레이더가 지표를 쉽게 사용자 지정할 수 있습니다. 7. 이 보조지표는 독립적인 트레이딩 시스템뿐만 아니라 트레이딩
    소개       Quantum Breakout PRO   , 브레이크아웃 존 거래 방식을 변화시키는 획기적인 MQL5 지표! 13년 이상의 거래 경험을 가진 숙련된 트레이더 팀이 개발한       퀀텀 브레이크아웃 PRO       혁신적이고 역동적인 브레이크아웃 존 전략으로 거래 여정을 새로운 차원으로 끌어올리도록 설계되었습니다. Quantum Breakout Indicator는 5개의 이익 목표 영역이 있는 브레이크아웃 영역의 신호 화살표와 브레이크아웃 상자를 기반으로 한 손절 제안을 제공합니다. 초보자 거래자와 전문 거래자 모두에게 적합합니다. Quantum EA 채널:       여기를 클릭하세요 중요한! 구매 후 설치 매뉴얼을 받으려면 개인 메시지를 보내주십시오. 추천: 기간: M15 통화쌍: GBPJPY, EURJPY, USDJPY,NZDUSD, XAUUSD 계정 유형: 스프레드가 매우 낮은 ECN, Raw 또는 Razor 브로커 시간: GMT +3 중개인 :
    Golden Spikes Detector
    Batsirayi L Marango
    3.25 (4)
    Golden Spikes Detector This indicator is based on an advanced strategy primarily for trading spikes on Boom and Crash Indices. Complex algorithms were implemented to detect high probability entries only. It alerts on potential Buy and Sell entries. To trade spikes on the Deriv or Binary broker, only take Buy Boom and Sell Cash alerts. It was optimised to be loaded on 5-minute timeframe although multiple timeframe analysis is done in the background. Features ·             Desktop pop up and sound
    제작자의 제품 더 보기
    PZ Support Resistance
    PZ TRADING SLU
    3.33 (3)
    Unlock key market insights with automated support and resistance lines Special Offer: Purchase now to receive free bonuses worth $75! (Read more for details) Tired of plotting support and resistance lines? This is a multi-timeframe indicator that detects and plots supports and resistance lines in the chart with the same precision as a human eye would. As price levels are tested over time and its importance increases, the lines become thicker and darker, making price leves easy to glance and eva
    This is the latest iteration of my famous scalper, Goldfinch EA, published for the first time almost a decade ago. It scalps the market on sudden volatility expansions that take place in short periods of time: it assumes and tries to capitalize of inertia in price movement after a sudden price acceleration. This new version has been simplified to allow the trader use the optimization feature of the tester easily to find the best trading parameters. [ Installation Guide | Update Guide | Troublesh
    PZ Harmonacci Patterns
    PZ TRADING SLU
    3.17 (6)
    Trade smarter, not harder: Empower your trading with Harmonacci Patterns Special Offer: Purchase now to receive free bonuses worth $165! (Read more for details) This is arguably the most complete harmonic price formation auto-recognition indicator you can find for the MetaTrader Platform. It detects 19 different patterns, takes fibonacci projections as seriously as you do, displays the Potential Reversal Zone (PRZ) and finds suitable stop-loss and take-profit levels. [ Installation Guide | Upda
    Trade smarter, not harder: Empower your trading with Harmonacci Patterns Special Offer: Purchase now to receive free bonuses worth $165! (Read more for details) This is arguably the most complete harmonic price formation auto-recognition indicator you can find for the MetaTrader Platform. It detects 19 different patterns, takes fibonacci projections as seriously as you do, displays the Potential Reversal Zone (PRZ) and finds suitable stop-loss and take-profit levels. [ Installation Guide | Upd
    PZ Trend Trading
    PZ TRADING SLU
    4.8 (5)
    Capture every opportunity: your go-to indicator for profitable trend trading Special Offer: Purchase now to receive free bonuses worth $109! (Read more for details) Trend Trading is an indicator designed to profit as much as possible from trends taking place in the market, by timing pullbacks and breakouts. It finds trading opportunities by analyzing what the price is doing during established trends. [ Installation Guide | Update Guide | Troubleshooting | FAQ | All Products ] Trade financial ma
    PZ Trendlines
    PZ TRADING SLU
    Tired of plotting trendlines? The PZ TrendLines indicator applies a mechanical approach to the construction of trend lines for you! [ Installation Guide | Update Guide | Troubleshooting | FAQ | All Products ] It can draw up to 18 trendlines Trendlines can be optionally based on fractals Each line represents a breakout level Each trendline can be broken or rejected Configurable amount of lines Configurable colors Author Arturo López Pérez, private investor and speculator, software engineer and
    PZ Risk Management
    PZ TRADING SLU
    5 (1)
    This indicator monitors the vital constants of your trading account to keep it healthy and away from excessive risks. It monitors all trades, absolute exposure, account floating point and leverage currently in use, using different color codes for your interpretation.  [ Installation Guide | Update Guide | Troubleshooting | FAQ | All Products ] Amazingly easy to understand The indicator is clean and simple It calculates exposure by pairs and currencies Keep your used leverage controlled at all ti
    This expert advisor implements the original Dennis and Eckhardt trading system, commonly known as The Turtle Trader. It trades exactly like the original turtles did, and can be used by experienced traders to capture trends in up or down markets. [ Installation Guide | Update Guide | Troubleshooting | FAQ | All Products ] Easy to use and supervise Fully configurable strategy settings Fully configurable trading settings Works for ECN/Non-ECN brokers and 2-3-4-5 digit symbols Works for CFDs and for
    PZ Trend Trading MT5
    PZ TRADING SLU
    3.8 (5)
    Capture every opportunity: your go-to indicator for profitable trend trading Special Offer: Purchase now to receive free bonuses worth $109! (Read more for details) Trend Trading is an indicator designed to profit as much as possible from trends taking place in the market, by timing pullbacks and breakouts. It finds trading opportunities by analyzing what the price is doing during established trends. [ Installation Guide | Update Guide | Troubleshooting | FAQ | All Products ] Trade financial ma
    PZ Chart Overlay MT5
    PZ TRADING SLU
    4 (1)
    Master the market: harness the power of statistical arbitrage This indicator showcases the price action of multiple instruments on a single chart, enabling you to compare the fluctuations of different assets and seamlessly implement statistical arbitrage strategies. Its main usage is to find correlated symbols which are temporarily out of whack. [ Installation Guide | Update Guide | Troubleshooting | FAQ | All Products ] Find overbought or oversold currency pairs easily Plot up to six currency
    PZ Swing Trading
    PZ TRADING SLU
    5 (3)
    Protect against whipsaws: revolutionize your swing trading approach Special Offer: Purchase now to receive free bonuses worth $135! (Read more for details) Swing Trading is the first indicator designed to detect swings in the direction of the trend and possible reversal swings. It uses the baseline swing trading approach, widely described in trading literature. The indicator studies several price and time vectors to track the aggregate trend direction and detects situations in which the market i
    PZ Swing Trading MT5
    PZ TRADING SLU
    5 (5)
    Protect against whipsaws: revolutionize your swing trading approach Special Offer: Purchase now to receive free bonuses worth $135! (Read more for details) Swing Trading is the first indicator designed to detect swings in the direction of the trend and possible reversal swings. It uses the baseline swing trading approach, widely described in trading literature. The indicator studies several price and time vectors to track the aggregate trend direction and detects situations in which the market i
    PZ Day Trading MT5
    PZ TRADING SLU
    2.83 (6)
    Effortless trading: non-repainting indicator for accurate price reversals Special Offer: Purchase now to receive free bonuses worth $60! (Read more for details) This indicator detects price reversals in a zig-zag fashion, using only price action analysis and a donchian channel. It has been specifically designed for short-term trading, without repainting or backpainting at all. It is a fantastic tool for shrewd traders aiming to increase the timing of their operations. [ Installation Guide | Upd
    This indicator analyzes price action patterns and helps you to make positive equity decisions in the binary options market. [ Installation Guide | Update Guide | Troubleshooting | FAQ | All Products ] Easy to trade Trade both call and put options No crystal ball and no predictions The indicator is non-repainting The only strategy suitable for binary options is applying a mathematical approach, like professional gamblers do. It is based on the following principles: Every binary option represents
    PZ Goldfinch Scalper EA
    PZ TRADING SLU
    1 (4)
    This is the latest iteration of my famous scalper, Goldfinch EA, published for the first time almost a decade ago. It scalps the market on sudden volatility expansions that take place in short periods of time: it assumes and tries to capitalize of inertia in price movement after a sudden price acceleration. This new version has been simplified to allow the trader use the optimization feature of the tester easily to find the best trading parameters. [ Installation Guide | Update Guide | Troublesh
    PZ Turtle Trading EA MT5
    PZ TRADING SLU
    2.33 (3)
    This expert advisor implements the original Dennis and Eckhardt trading system, commonly known as The Turtle Trader. It trades exactly like the original turtles did, and can be used by experienced traders to capture trends in up or down markets. [ Installation Guide | Update Guide | Troubleshooting | FAQ | All Products ] Easy to use and supervise Fully configurable strategy settings Fully configurable trading settings Works for ECN/Non-ECN brokers and 2-3-4-5 digit symbols Works for CFDs and for
    PZ Day Trading
    PZ TRADING SLU
    3.67 (3)
    Effortless trading: non-repainting indicator for accurate price reversals Special Offer: Purchase now to receive free bonuses worth $90! (Read more for details) This indicator detects price reversals in a zig-zag fashion, using only price action analysis and a donchian channel. It has been specifically designed for short-term trading, without repainting or backpainting at all. It is a fantastic tool for shrewd traders aiming to increase the timing of their operations. [ Installation Guide | Upd
    PZ Wolfe Waves
    PZ TRADING SLU
    1 (1)
    Precision trading: leverage wolfe waves for accurate signals Special Offer: Purchase now to receive free bonuses worth $109! (Read more for details) Wolfe Waves are naturally occurring trading patterns present in all financial markets and represent a fight towards an equilibrium price. These patterns can develop over short and long-term time frames and are one of the most reliable predictive reversal patterns in existence, normally preceding strong and long price movements. [ Installation Guide
    PZ Support Resistance MT5
    PZ TRADING SLU
    4.17 (6)
    Unlock key market insights with automated support and resistance lines Special Offer: Purchase now to receive free bonuses worth $75! (Read more for details) Tired of plotting support and resistance lines? This is a multi-timeframe indicator that detects and plots supports and resistance lines in the chart with the same precision as a human eye would. As price levels are tested over time and its importance increases, the lines become thicker and darker, making price leves easy to glance and eva
    Identify over 30 candlestick patterns with precision Special Offer: Purchase now to receive free bonuses worth $60! (Read more for details) This indicator recognizes over 30 Japanese Candlestick Patterns and highlights them beautifully on the chart. It is simply one of those indicators price action traders can't live without. [ Installation Guide | Update Guide | Troubleshooting | FAQ | All Products ] Boost your technical analysis overnight Detect japanese candlestick patterns easily Trade rel
    Stay ahead of the market: predict buying and selling pressure with ease This indicator analyzes past price action to anticipate buying and selling pressure in the market: it does so by looking back into the past and analyzing price peaks and valleys around the current price. It is a state-of-the-art confirmation indicator. [ Installation Guide | Update Guide | Troubleshooting | FAQ | All Products ] Predict buying and selling pressure in the market Avoid getting caught in buying selling frenzies
    PZ ABCD Retracement
    PZ TRADING SLU
    4 (5)
    Identify precise entry and exit points with AB=CD patterns This indicator finds AB=CD retracement patterns. The AB=CD Retracement pattern is a 4-point price structure where the initial price segment is partially retraced and followed by an equidistant move from the completion of the pullback, and is the basic foundation for all harmonic patterns. [ Installation Guide | Update Guide | Troubleshooting | FAQ | All Products ] Customizable pattern sizes Customizable AC and BD ratios Customizable br
    This is the latest iteration of my famous indicator, Reversal Fractals, published for the first time almost a decade ago. It examines the price structure of fractals to determine possible reversal points in the market, providing timing to positional traders that already have a fundamental or technical valuation model. [ Installation Guide | Update Guide | Troubleshooting | FAQ | All Products ] Reversal fractals can start long trends The indicator is non repainting It implements alerts of all ki
    This indicator displays pivot points in the chart, including historical vales, and supports many calculation modes for Pivot Points and S/R levels. [ Installation Guide | Update Guide | Troubleshooting | FAQ | All Products ] It plots historical levels for backtesting purposes It allows you to select the reference timeframe It implements different Pivot Point calculation modes It implements different SR calculation modes It implements customizable colors and sizes Calculation Modes The indicato
    Enhance your price action strategy: inside bar breakouts at your fingertips This indicator detects inside bars of several ranges, making it very easy for price action traders to spot and act on inside bar breakouts. [ Installation Guide | Update Guide | Troubleshooting | FAQ | All Products ] Easy to use and understand Customizable color selections The indicator implements visual/mail/push/sound alerts The indicator does not repaint or backpaint An inside bar is a bar or series of bars which is/a
    Spot high-probability trades: sandwich bar breakouts at your fingertips This indicator detects Sandwich Bars of several ranges, an extremely reliable breakout pattern. A sandwich setup consists on a single bar that engulfs several past bars, breaking and rejecting the complete price range. [ Installation Guide | Update Guide | Troubleshooting | FAQ | All Products ] Easy and effective usage Customizable bar ranges Customizable color selections The indicator implements visual/mail/push/sound aler
    PZ Correlation
    PZ TRADING SLU
    5 (1)
    In the world of finance, correlation is a statistical measure of how two securities move in relation to each other. Correlations are used in advanced portfolio management. This indicator measures how different securities move in relation to a reference one, thus making portfolio management easier.  [ Installation Guide | Update Guide | Troubleshooting | FAQ | All Products ] Avoid concurrent trades in highly correlated instruments Find trading opportunities among highly correlated instruments Cor
    This is a smooth and responsive accelerometer which reveals the market trend and strength. [ Installation Guide | Update Guide | Troubleshooting | FAQ | All Products ] Two moving averages indicate trend direction The histogram represents strength of the price movement It draws buy and sell zones as colored vertical lines Should be used as a confirmation indicator Customizable line widths and colors It implements alerts of all kinds This indicator is similar to MACD but aims to react faster to
    PZ Three Drives
    PZ TRADING SLU
    This indicator finds Three Drives patterns. The Three Drives pattern is a 6-point reversal pattern characterised by a series of higher highs or lower lows that complete at a 127% or 161.8% Fibonacci extension. It signals that the market is exhausted and a reversal can happen. [ Installation Guide | Update Guide | Troubleshooting | FAQ | All Products ] Customizable pattern sizes Customizable colors and sizes Customizable breakout periods Customizable 1-2-3 and 0-A-B ratios It implements visual/s
    This indicator evaluates the market sentiment using raw price action measurements, and it is an amazing trading confirmation. It can be used to take a trend-trade approach or a contrarian approach using reversal patterns. [ Installation Guide | Update Guide | Troubleshooting | FAQ | All Products ] Find early reversals Confirm short-term trades Detect indecision on the market Take contrarian trades near support and resistance levels Trade inside bars confirmed by overall direction of the market T
    필터:
    investigador
    54
    investigador 2023.11.12 16:37 
     

    사용자가 평가에 대한 코멘트를 남기지 않았습니다

    RKE
    705
    RKE 2022.11.18 02:14 
     

    사용자가 평가에 대한 코멘트를 남기지 않았습니다

    Hydra1504
    16
    Hydra1504 2022.08.27 14:15 
     

    사용자가 평가에 대한 코멘트를 남기지 않았습니다

    Lou Nu
    133
    Lou Nu 2021.07.19 23:55 
     

    사용자가 평가에 대한 코멘트를 남기지 않았습니다

    Zemljokres
    19
    Zemljokres 2021.01.22 15:10 
     

    사용자가 평가에 대한 코멘트를 남기지 않았습니다

    Peterson  Veiga Campos
    582
    Peterson Veiga Campos 2020.01.26 03:42 
     

    사용자가 평가에 대한 코멘트를 남기지 않았습니다

    리뷰 답변
    버전 2.0 2019.08.11
    - Minor changes