PipFinite Cluster Helix
- 지표
- Karlo Wilson Vendiola
- 버전: 9.0
- 업데이트됨: 7 7월 2024
- 활성화: 5
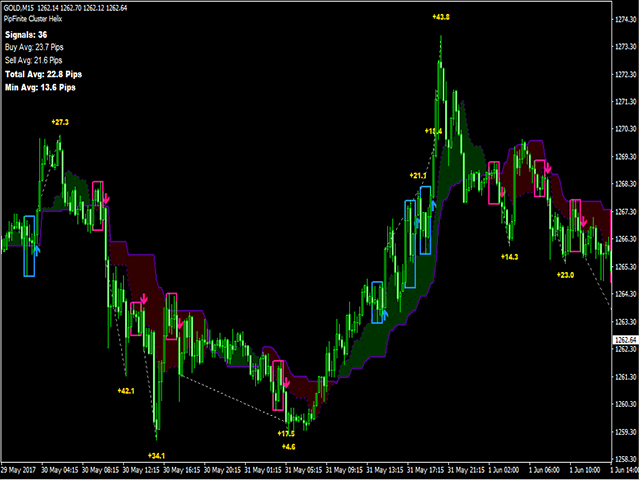
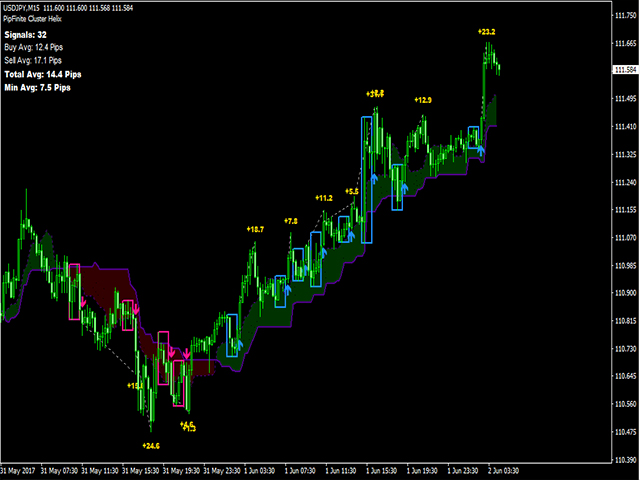
A combination of trend, pullback, range breakouts and statistics in one indicator
Mainly functions as an Entry indicator. Works in any pair and timeframe.
Suggested Combination
Cluster Helix with Strength Meter
- Strategy: Confirm signals with ideal strength levels
- Watch Video: (Click Here)
Features
- Detects range breakouts on pullback zones in the direction of the trend
- Analyzes statistics of maximum profits and calculates possible targets for the next signal
- Flexible tool, can be used in many ways to improve a trading system
- StopLoss Levels
- Option 1: Range Levels
- Below blue range box for buy signal
- Above red box for sell signal
- Option 2: Statistical Data
- Buy Average Value for buy signal
- Sell Average Value for sell signal
- Option 3: Higher Value
- Compare Option 1 and Option 2, Select the Higher Value
- TakeProfit Levels
- Option 1: Standard TakeProfit
- Buy Average Value for buy signal
- Sell Average Value for sell signal
- Option 2: Quick Takeprofit for Scalping
- Minimum Average Value
- Avoid late range breakouts
- RSI value below 70 for buy signals
- RSI value above 30 for sell signals
- Avoid trend weakness
- Only take the first 3 consecutive signals in the direction of the trend
- It is best to avoid the 4th signal and wait for the pullback zone to change color or reset
- Please watch the video for better understanding (Click Here)
- Exit Strategy
- Exit will depend on traders discretion according to his/her strategy
- Support/Resistance Areas
- Reversal signals from price action patterns
- We can use Exit Scope as alternate exit strategy
- Supporting Tool
- Ideally combined with price action trading
- Increase probabilities by combining to Strength Meter
- Avoid false signals by combining to Volume Critical
- Avoid buy signals if Volume Critical is Overbought
- Avoid sell signals if Volume Critical is Oversold
- Never repaints
- Never backpaints
- Never recalculates
- Signals strictly on the "Close of the bar"
- Compatible with Expert Advisor development
Day Trading Strategy (M15)
Buy Setup
- H4 Timeframe shows bullish pullback zone (green zone). Go to M15 timeframe for entries
- M15 Buy Signal
- Strength Meter Bullish Level 1 to Level 3 only (Use Period = 20 for settings)
- RSI is below 70
- Set your stoploss
- Option 1: Above the blue range box
- Option 2: Buy Average value
- Option 3: Select the higher value from Option 1 and 2
- Set yout takeprofit
- Option 1: Use average Buy Average value
- Option 2: For scalping, use Min Average value
Sell Setup
- H4 Timeframe shows bearish pullback zone (red zone). Go to M15 timeframe for entries
- M15 Sell Signal
- Strength Meter Bearish Level 1 or Level 3 only (Use Period = 20 for settings)
- RSI above 30
- Set your stoploss
- Option 1: Below the red range box
- Option 2: Sell Average value
- Option 3: Select the higher value from Option 1 and 2
- Set yout takeprofit
- Option 1: Use average Sell Average value
- Option 2: For scalping, use Min Average value
Scalping Strategy (M5)
Same as Day Trading Strategy but
- H1 as Higher Timeframe
- M5 as Entry Timeframe
- Strength Meter Period = 14 for settings
Swing Strategy (H1)
Same as Day Trading Strategy but
- D1 as Higher Timeframe
- H1 as Entry Timeframe
- Strength Meter Period = 7 for settings
Additional Guidelines
- Trade only London and US session for best breakout volatility
- Avoid signals 30 mins before and after major news releases
- Skip the 4th and succeeding signals. Wait for a reset to avoid trend weakness
Video References
Please Watch in High-Definition to further understand
- How it works (Click Here)
- How to trade (Click Here)
- How to avoid trend weakness (Click Here)
- Combining to Strength Meter (Click Here)

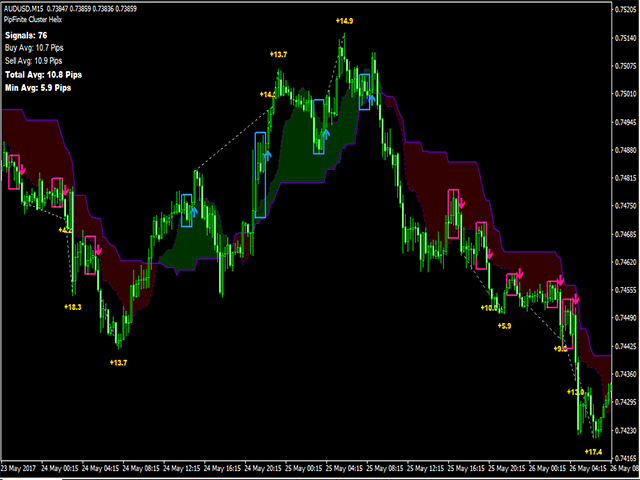
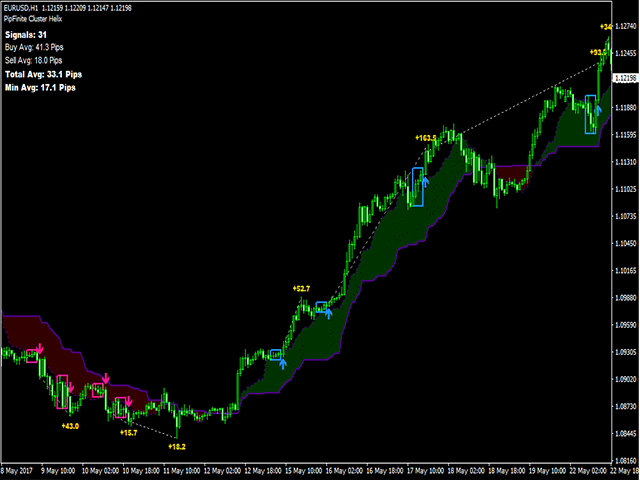
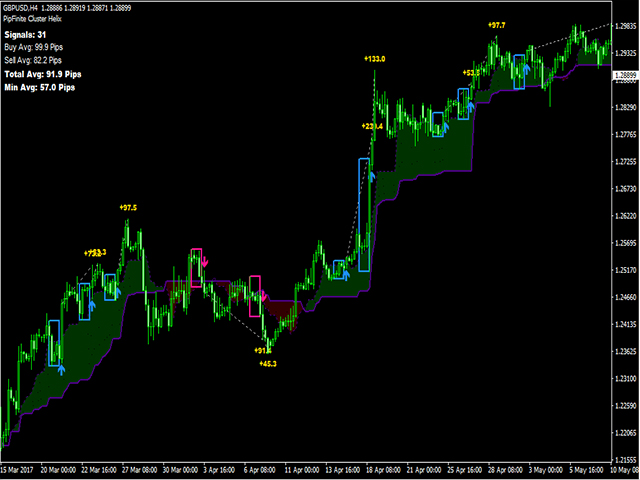
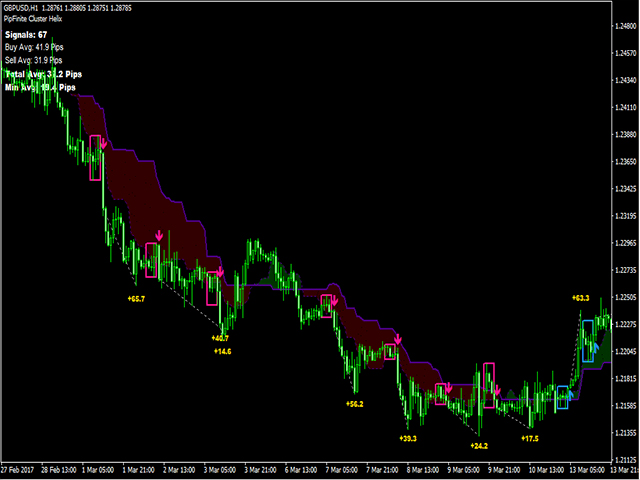































One of the best indicators if used correctly in combination with other confirmations, tools, trend and price action. If you understand it this is invaluable addition to a trading toolkit...