RSI Multi TimeFrame Multi Currency
- 지표
- Stuart Browne
- 버전: 1.0
- 활성화: 20
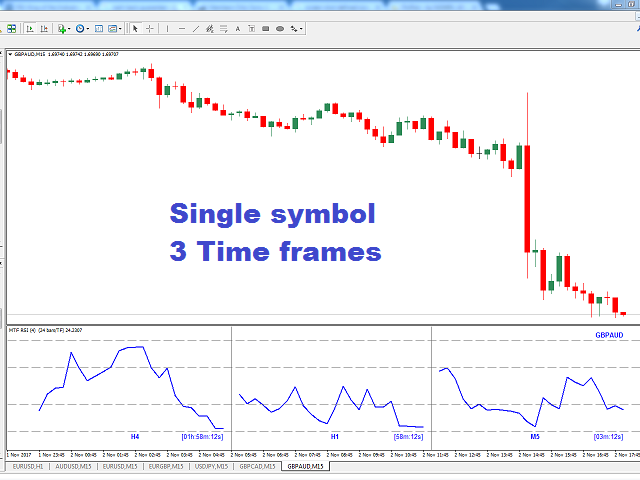
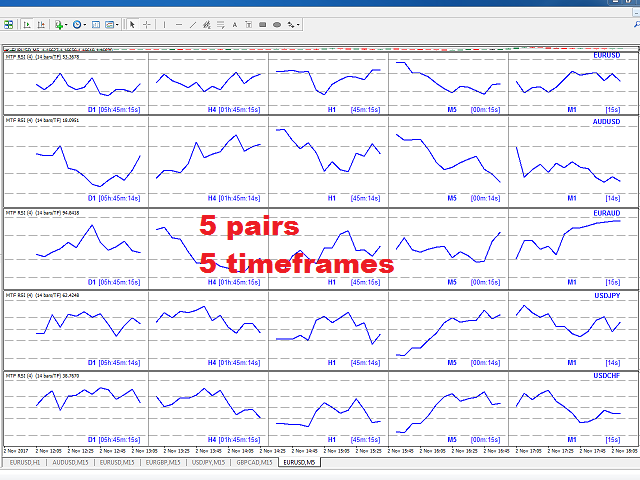
At last! See the actual, oscillating RSI for multiple pairs & multiple timeframes, all on the one chart!
The Benefits of Multi TimeFrame / Multi Pair Analysis
Multiple time frame analysis is one of the most important things you should be doing before you take every trade.
The most successful traders rely on monitoring several timeframes at once, from the weekly down to the 1 minute. They do this because using only one timeframe causes most traders to become lost in the "noise" of random price movements — resulting in losing trades and overthinking every decision. For instance, the trend on a 30 minute chart may be much different than the trend on a 5 minute or 120 minute chart. By tracking multiple timeframes at once, you'll gain a clearer perspective of the trend and will always know when multiple timeframes are in harmony or disagreement.
- The trend may appear differently on the time frame you are looking at than where the longer term trend is moving
- Price may appear to have room to move on one time frame where it is actually quite over-extended on a lesser time frame
- You can make a much more precise entry point on shorter times than on longer ones
- You may take a great trade on a short time frame and hit your target, but not realize you could have let it run for a way bigger profit due to the longer term trend
Features & Strategies
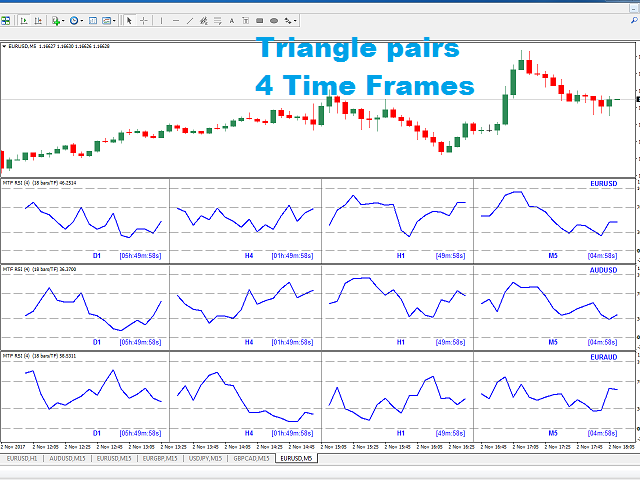
- Reduce clutter to just 1 chart. No more clicking back and forth between charts. Display as many symbols and as many time frames as you want!
- Works for every style of trade; long term, swing, intraday, scalping
- Identify high probability entries by comparing multiple timeframes
- Quickly spot divergences on correlated pairs
- Identify triangular pair arbitrage opportunities
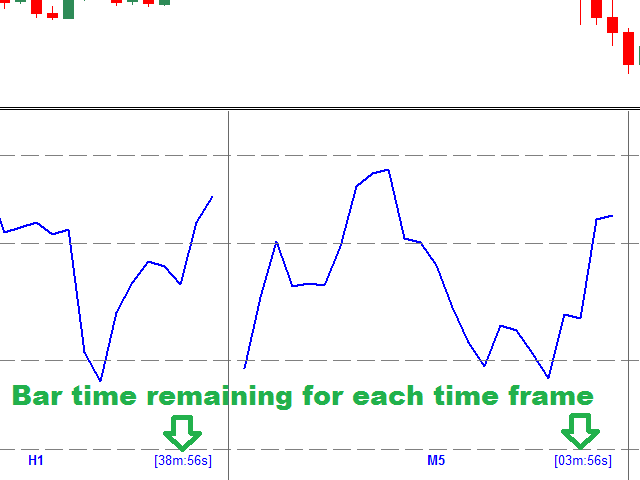
- Every time frame displays a countdown timer so you can see when the next bar is going to start
- Each time frame automatically scales with your chart as you zoom in/out, providing maximum use of your screen real estate
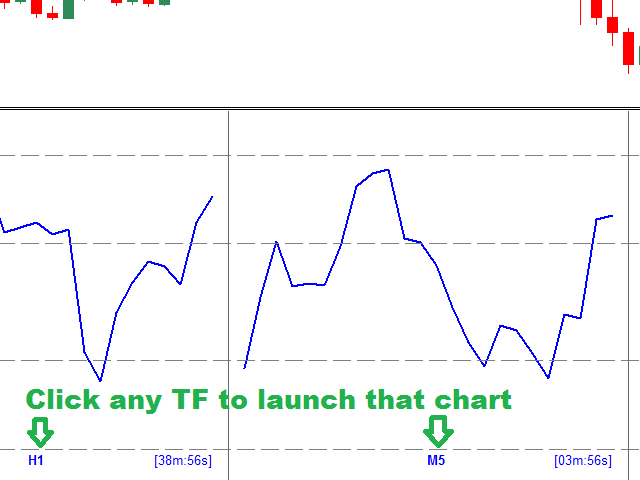
- Click on any symbols time frame text to instantly open the chart for that symbol & time frame
- We pride ourselves on our customer support and as with all of our tools, you receive 24/5 access to us through MQL5 PM, email or skype if you have any questions
Inputs
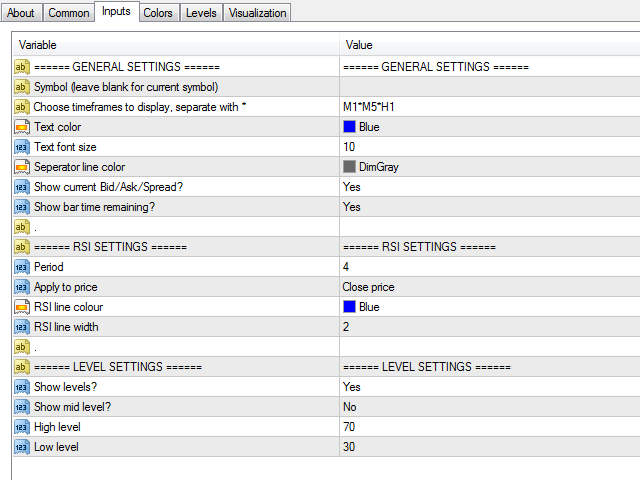
- Symbol Specify the symbol you wish to display, exactly as it appears in your Market Watch window (eg AUDUSD, AUDUSDm etc) Or, leave blank and the indicator will always show you the current symbol
- Timeframes Enter which timeframes you want to display, separated with an asterix (*). For instance M5*H1*H4*D1. You can enter as many TFs as you want!
The options are exactly as they appear in MT4: M1, M5, M15, M30, H1, H4, D1, W1, MN - Text color & size The size and color of all of the text within the indicator
- Separator line color The color of the line which separates each time frame
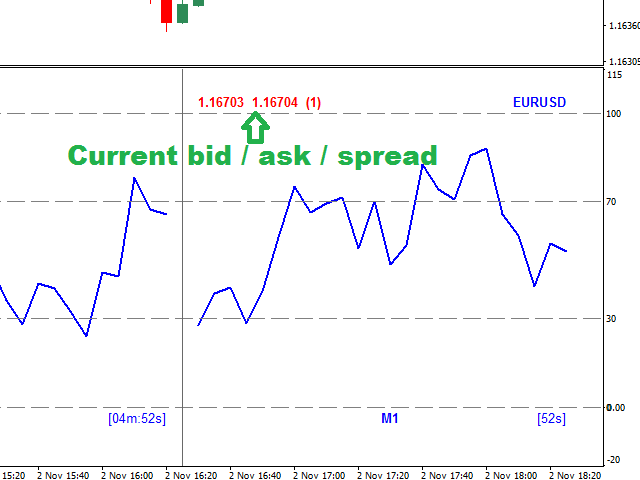
- Show bid/ask/spread Displays that symbols bid, ask & spread on the right side of the indicator.
- Show bar time remaining Shows the remaining amount of time to the next bar of every time frame. Very useful!
- RSI Settings Set the RSI period and applied to price (eg Close, Open, High etc) as well as the color and line width
- Level settings Set the overbought, oversold and mid levels and control which is displayed
IMPORTANT: Demo Version
Please note that due to the limitations of the MT4 back tester, the free demo version will only be able to show you the current symbol you have selected to test. Problems may also occur if you try to display an RSI timeframe that is lower than the tested time frame. This is not a bug in our indicator, it is due to the fact that MT4 does not handle multi symbol / multi time frame in the strategy tester.
