Harmonic 50
- 지표
- Sergey Deev
- 버전: 1.2
- 업데이트됨: 14 6월 2019
- 활성화: 5
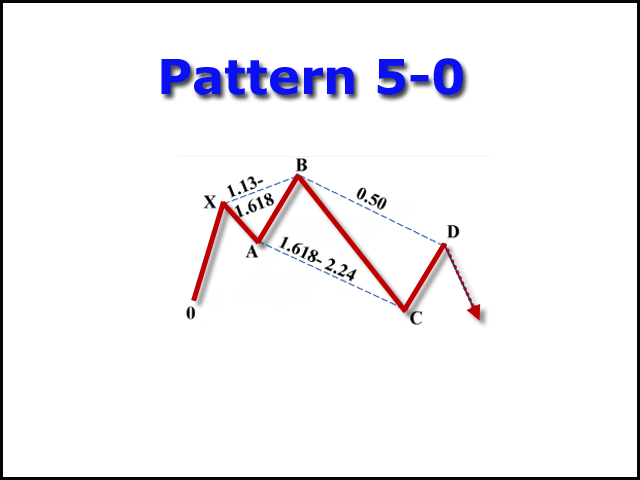
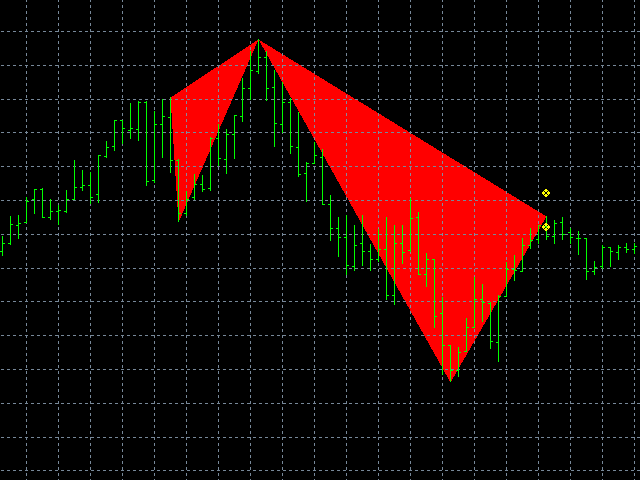
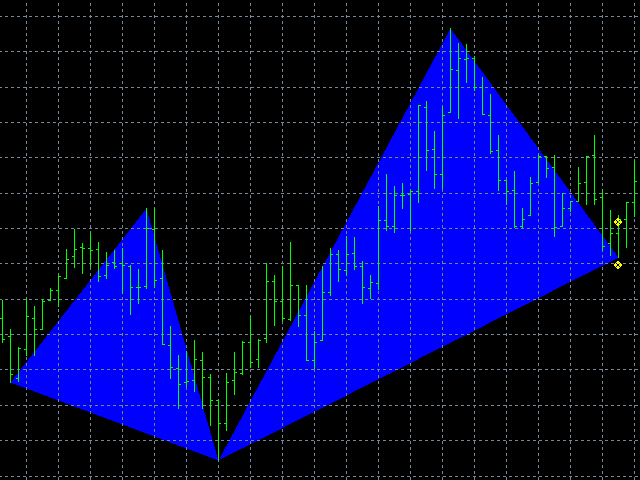
The indicator detects and displays the 5-0 harmonic pattern on the chart according to the scheme provided in the screenshot. The pattern is plotted by the extreme values of the ZigZag indicator (included in the resources, does not require additional installation). After detecting the pattern, the indicator notifies of that by the pop-up window, a mobile notification and an email. The indicator highlights not only the complete figure, but also the time of its formation. During the formation the figure is displayed by triangle outlines. Once the figure is finally formed, a potential reversal zone is displayed on the chart.
Parameters
- zzDepth, zzDev, zzBack - ZigZag parameters
- AB_min (ab/ax), AB_max (ab/ax) - minimum and maximum ratio of AB and AX levels
- BC_min (bc/ab), BC_max (bc/ab) - minimum and maximum ratio of BC and AB levels
- CD_min (cd/bc), CD_max (cd/bc) - minimum and maximum ratio of CD and BC levels
- bearColor - bearish pattern color
- bullColor - bullish pattern color
- CountBars - limit the amount of bars to be processed by the indicator (reduces the initial download time)
- UseAlert - enable pop-up messages
- UseNotification - enable push notifications
- UseMail - enable email notifications
- prefix - text label to ensure the uniqueness of the indicator objects on the chart (if multiple indicators are attached to the chart, different values must be entered in these parameters)
- MessageAdd - the text string added to the notifications sent by the indicator.


사용자가 평가에 대한 코멘트를 남기지 않았습니다