• 미리보기
  • 리뷰 (75)
  • 코멘트 (318)
  • 새 소식

Shepherd Harmonic Pattern

4.68

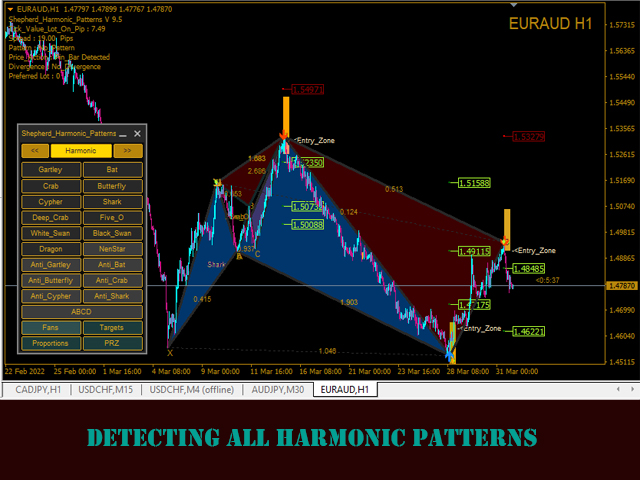
이 지표는 수동 및 자동 방법으로 차트에 그려진 고조파 패턴을 감지합니다. 사용자 매뉴얼은 다음 링크에서 확인할 수 있습니다.

리뷰를 작성하고 문의하면 무료 버전으로 MT4에서 제품을 시도할 수 있습니다. Gartley 및 Nenstar 패턴을 감지하는 데 사용할 수 있습니다.

https://www.mql5.com/en/market/product/30181

전체 MT4 버전을 구입하려면 다음에서 구입할 수 있습니다.

https://www.mql5.com/en/market/product/15212

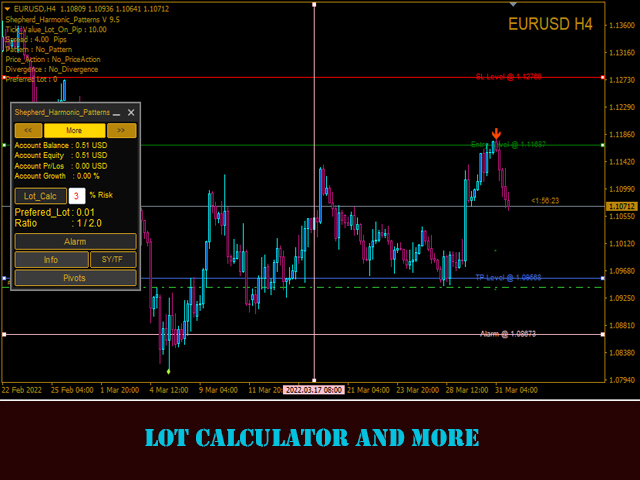
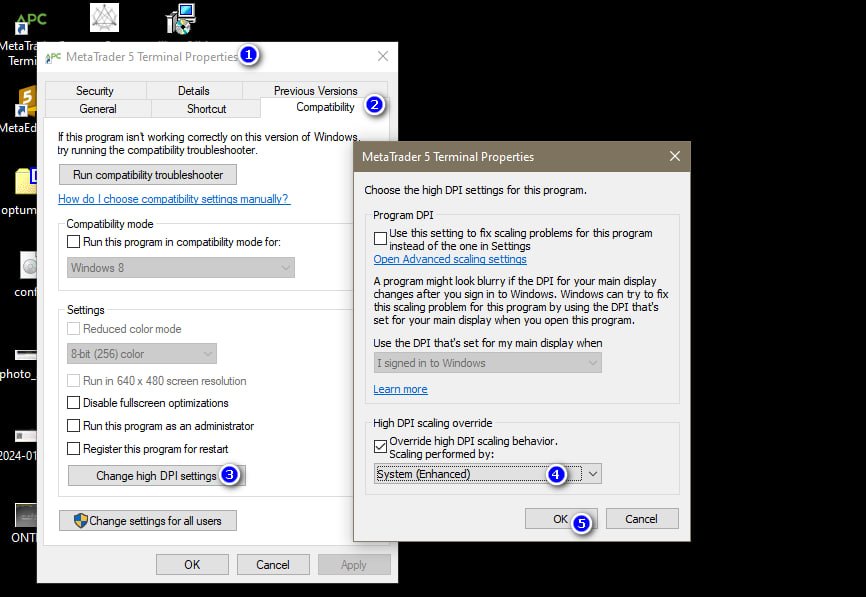
참고 사항 지표에는 제어 패널이 있으며 모든 (차트 및 시간대) 설정을 저장합니다. 차트에서 더 많은 공간을 확보하려면 최소화할 수 있으며, 다른 분석 도구로 작업하는 것이 선호되는 경우 모든 지표 데이터를 숨기려면 닫기 버튼을 누를 수 있습니다. 이 지표를 사용하고 설정을 변경하면 이동 평균 또는 볼린저 밴드와 같은 지표를 추가하면 자동으로 템플릿을 저장하고 필요할 때 언제든지 로드할 수 있습니다. Windows 10을 사용하는 경우 MetaTrader 아이콘에서 마우스 오른쪽 단추를 클릭하고 호환성, 고해상도 DPI 설정 변경, 시스템 (개선)을 눌러 최상의 화면 설정을 얻으십시오(고화질 장치에서 수행해야 함). 지표는 차트에서 고조파 거래 이론을 해석하는 것으로 단순하게 고조파 패턴을 감지합니다. 학습하려면 Scott Carney의 "Harmonic Trading vol 1&2"라는 책을 검색할 수 있습니다. 지표에는 가격 및 시간 경보 선이 있습니다. 지표는 검출된 패턴에 대해 피보나치 팬을 그릴 것입니다. 지표는 중심점/카메렐라/패턴 레이를 그릴 것입니다. 수동으로 그린 개체를 낮은 시간대로 로드할 수 있습니다. 리셋 버튼을 사용하여 모든 저장된 설정(모든/현재) 시간대를 지우십시오. 지표에는 신호로써 목표/정지/진입점을 제공하는 경보/알림 시스템이 있습니다. 지표는 발견된 발산(노란색 및 주황색 화살표)을 감지하며, 이것들은 좋은 확인으로 작용합니다. 지

Was this response better or worse?
Better Worse Same


리뷰 20
Suleiman Alhawamdah
1018
Suleiman Alhawamdah 2023.06.04 18:49 
 

Thanks for the new update

trinh tien
49
trinh tien 2023.03.08 15:29 
 

This is best indicator that i ever bought.It worked well in forex and stock. The author is very kind.He is willing to support customer. I appriciate him. However should add scanner function . it will convinient . we will take less time to search the harmonic patter. Thank you for hard-working.

David Gakuya Kariuki
137
David Gakuya Kariuki 2023.03.01 16:23 
 

Two things I love about Shepherd Hamonic Indicator: 1:It works well combining Markets action, Harmonics, and Elliott Wave. 2: The developer, Mr. Abdullah Alrai is approachable. I have invested in the indicator. I suggest, to your life-term benefit that you also do.

추천 제품
Trend Catcher with Alert
Issam Kassas
4.8 (65)
트렌드 캐쳐: 알림 인디케이터와 함께 하는 트렌드 캐쳐 전략은 시장 트렌드와 잠재적인 진입 및 체크 포인트를 식별하는 데 도움이 되는 다목적 기술 분석 도구입니다. 이는 시장 상황에 적응하여 트렌드 방향을 명확하게 시각적으로 표현하는 동적 트렌드 캐쳐 전략을 제공합니다. 트레이더는 선호도와 위험 허용도에 맞게 매개변수를 사용자 정의할 수 있습니다. 이 인디케이터는 트렌드 식별을 지원하고 잠재적인 반전을 신호로 제공하며 트레일링 스탑 메커니즘으로 작동하며 실시간 경고를 제공하여 신속한 시장 대응을 돕습니다. 특징: - 트렌드 식별: 상승 트렌드와 하락 트렌드를 신호합니다. - 트렌드 반전: 양봉 색상이 상승에서 하락으로 변경되거나 그 반대의 경우 잠재적인 반전을 경고합니다. - 실시간 경고: 새로운 트렌드 식별을 위한 경고를 생성합니다. 추천사항: - 통화 및 페어: EURUSD, AUDUSD, XAUUSD 등... - 시간 프레임: H1. - 계정 유형: 모든 E
FREE
>>> BIG SALE PROMOTION: 50% OFF + GIFT EA!  - Promo price: $64 / Regular price $129 <<< - The promotion will end soon! The Forex Trend Tracker is an advanced tool designed to enhance the trading capabilities of forex traders. This sophisticated indicator uses complex mathematical formulas alongside the Average True Range (ATR) to detect the beginnings of new upward and downward trends in the forex market. It offers visual cues and real-time alerts to give traders a competitive advantage in th
VR Cub
Vladimir Pastushak
VR Cub 은 고품질 진입점을 얻는 지표입니다. 이 지표는 수학적 계산을 용이하게 하고 포지션 진입점 검색을 단순화하기 위해 개발되었습니다. 지표가 작성된 거래 전략은 수년 동안 그 효율성을 입증해 왔습니다. 거래 전략의 단순성은 초보 거래자라도 성공적으로 거래할 수 있다는 큰 장점입니다. VR Cub은 포지션 개시 지점과 이익 실현 및 손절매 목표 수준을 계산하여 효율성과 사용 편의성을 크게 높입니다. 간단한 거래 규칙을 이해하려면 아래 전략을 사용한 거래 스크린샷을 살펴보세요. 설정, 세트 파일, 데모 버전, 지침, 문제 해결 등은 다음에서 얻을 수 있습니다. [블로그] 다음에서 리뷰를 읽거나 작성할 수 있습니다. [링크] 버전 [MetaTrader 5] 진입점 계산 규칙 포지션 개설 진입점을 계산하려면 VR Cub 도구를 마지막 최고점에서 마지막 최저점까지 늘려야 합니다. 첫 번째 지점이 두 번째 지점보다 빠른 경우, 거래자는 막대가 중간선 위에서 마감될 때까지 기다립
This is a new strategy for SUPPLY DEMAND areas It is based on a calculation using the tick volume to detect the big price action in market for both bear /bull actions this smart volume action candles are used to determine the supply and demand areas prices in between main supply and demand lines indicate sideway market  up arrows will be shown when prices moves above the main supply and the secondary supply lines Down arrows will be shown when prices moves below the main demand and the secondary
Trendiness Index
Libertas LLC
5 (3)
"The trend is your friend" is one of the best known sayings in investing, because capturing large trendy price movements can be extremely profitable. However, trading with the trend is often easier said than done, because many indicators are based on price reversals not trends. These aren't very effective at identifying trendy periods, or predicting whether trends will continue. We developed the Trendiness Index to help address this problem by indicating the strength and direction of price trend
PipFinite Exit EDGE
Karlo Wilson Vendiola
4.88 (161)
Did You Have A Profitable Trade But Suddenly Reversed? In a solid strategy, exiting a trade is equally important as entering. Exit EDGE helps maximize your current trade profit and avoid turning winning trades to losers. Never Miss An Exit Signal Again Monitor all pairs and timeframes in just 1 chart www.mql5.com/en/blogs/post/726558 How To Trade You can close your open trades as soon as you receive a signal Close your Buy orders if you receive an Exit Buy Signal. Close your Sell orde
El indicador "MR BEAST ALERTAS DE LIQUIDEZ" es una herramienta avanzada diseñada para proporcionar señales y alertas sobre la liquidez del mercado basándose en una serie de indicadores técnicos y análisis de tendencias. Ideal para traders que buscan oportunidades de trading en función de la dinámica de precios y los niveles de volatilidad, este indicador ofrece una visualización clara y detallada en la ventana del gráfico de MetaTrader. Características Principales: Canal ATR Adaptativo: Calcula
History Pattern Search
Yevhenii Levchenko
표시기는 현재 시세를 작성하여 과거 시세와 비교할 수 있으며 이를 바탕으로 가격 변동을 예측합니다. 표시기에는 원하는 날짜로 빠르게 이동할 수 있는 텍스트 필드가 있습니다. 옵션: 기호 - 표시기가 표시할 기호 선택. SymbolPeriod - 지표가 데이터를 가져올 기간 선택. IndicatorColor - 표시기 색상. HorisontalShift - 지시자가 그린 따옴표를 지정된 막대 수만큼 이동합니다. Inverse - true는 인용 부호를 반대로, false - 원래 보기를 반전합니다. ChartVerticalShiftStep - 차트를 수직으로 이동합니다(키보드의 위/아래 화살표). 다음은 날짜를 입력할 수 있는 텍스트 필드의 설정으로, '엔터'를 누르면 즉시 이동할 수 있습니다.
Market Profile 3
Hussien Abdeltwab Hussien Ryad
4 (4)
Market Profile 3 MetaTrader 4 indicator  — is a classic Market Profile implementation that can show the price density over time, outlining the most important price levels, value area, and control value of a given trading session. This indicator can be attached to timeframes between M1 and D1 and will show the Market Profile for daily, weekly, monthly, or even intraday sessions. Lower timeframes offer higher precision. Higher timeframes are recommended for better visibility. It is also possible t
FREE
Ultimate Supply Demand
Ramon Sobrevals Arce
5 (3)
After working during many months, with the help of Neural Networks, we have perfected the ultimate tool you are going to need for identifying key price levels (Supports and Resistances) and Supply and Demand zones. Perfectly suitable to trigger your trades, set up your future actions, decide your Take Profit and Stop Loss levels, and confirm the market direction. Price will always move between those levels, bouncing or breaking; from one zone to another, all the remaining movements are just mark
The indicator detects and displays 3 Drives harmonic pattern (see the screenshot). The pattern is plotted by the extreme values of the ZigZag indicator (included in the resources, no need to install). After detecting the pattern, the indicator notifies of that by a pop-up window, a mobile notification and an email. The indicator highlights the process of the pattern formation and not just the complete pattern. In the former case, it is displayed in the contour triangles. After the pattern is com
PZ Support Resistance
PZ TRADING SLU
3.33 (3)
Unlock key market insights with automated support and resistance lines Special Offer: Purchase now to receive free bonuses worth $89! (Read more for details) Tired of plotting support and resistance lines? This is a multi-timeframe indicator that detects and plots supports and resistance lines in the chart with the same precision as a human eye would. As price levels are tested over time and its importance increases, the lines become thicker and darker, making price leves easy to glance and ev
Title : UT_Bot - ATR-Based Trading Indicator Introduction : Discover the power of "UT_Bot," the ultimate trading indicator that leverages the Average True Range (ATR) to provide unparalleled accuracy in your trading decisions. If you're seeking a more reliable alternative to the Super Trend indicator, look no further. UT_Bot is your key to precision trading. Key Features : ATR-Powered Precision: UT_Bot uses the ATR to deliver accurate signals that adapt to market volatility. Enhanced Trend Detec
MT4용 외환 지표 "지원 저항 수준" 지표 "지원 저항 수준"은 거래에 매우 유용한 보조 지표입니다. "지원"과 "저항"은 가격이 존중하는 차트의 중요한 영역입니다. 지원 수준은 가격이 정기적으로 하락을 멈추고 다시 반등하는 곳입니다. 저항 수준은 가격이 일반적으로 상승을 멈추고 다시 하락하는 곳입니다. 지표 "지원 저항 수준"은 최근 수준을 보여줍니다. 저항 수준 - 빨간색 선. 지원 수준 - 파란색 선 계산에 사용되는 막대 수, 선 유형 및 색상은 설정에서 조정할 수 있습니다. 지표 "지원 저항 수준"은 가격 액션 패턴을 통해 이익 실현 목표, 가격 반전 및 재테스트를 계획하는 데 좋습니다. // 더 많은 훌륭한 전문가 고문 및 지표는 여기에서 확인할 수 있습니다. https://www.mql5.com/en/users/def1380/seller 이 MQL5 웹사이트에서만 제공되는 오리지널 제품입니다.
Dollar Mint Indicator
David Mwaniki Mbugua
Dollar mint indicator is a special workmanship with years of experience in forex.   Dollar mint ea is a fully non repaint indicator optimised with price action data such that once it gives you a signal t . The indicator   can be used to trade anything on the mt4 with much ease. Benefits ; Fully non repaint Use in any timeframe Use in all the available tradable assets on mt4 Best to use on h4. It generates fully analysed buy and sell signals based on trend and also filters out retracement
Trend PA
Mikhail Nazarenko
5 (3)
The Trend PA indicator uses   Price Action   and its own filtering algorithm to determine the trend. This approach helps to accurately determine entry points and the current trend on any timeframe. The indicator uses its own algorithm for analyzing price changes and Price Action. Which gives you the advantage of recognizing, without delay, a new nascent trend with fewer false positives. Trend filtering conditions can be selected in the settings individually for your trading style. The indicator
캔들의 종가를 예측하는 지표입니다. 지표는 주로 D1 차트에서 사용하기 위한 것이. 이 지표는 전통적인 외환 거래와 바이너리 옵션 거래 모두에 적합합니다. 지표는 독립형 거래 시스템으로 사용하거나 기존 거래 시스템에 추가로 사용할 수 있습니다. 이 표시기는 현재 양초를 분석하여 양초 본체 내부의 특정 강도 요인과 이전 양초의 매개변수를 계산합니다. 따라서 지표는 시장 움직임의 추가 방향과 현재 양초의 종가를 예측합니다. 이 방법 덕분에 지표는 단기 및 중장기 거래 모두에 적합합니다. 지표를 사용하면 시장 상황을 분석하는 동안 지표가 생성할 잠재적 신호의 수를 설정할 수 있습니다. 표시기 설정에는 이를 위한 특별한 매개변수가 있습니다. 또한 인디케이터는 새로운 신호에 대해 차트의 메시지 형태, 이메일 및 PUSH 알림 형태로 알릴 수 있습니다. 구매 후 저에게 꼭 써주세요! 나는 당신에게 지표와 거래에 대한 나의 추천을 줄 것입니다! 또한 보너스를 받으세요!
Matrixs
Andriy Sydoruk
Matrix is a Forex arrow indicator. Displays signals simply and clearly! The arrows show the direction of the transaction, and are colored accordingly, which can be seen in the screenshots. As you can see, trading with such an indicator is easy. I waited for an arrow to appear in the desired direction - I opened a deal. An arrow formed in the opposite direction - closed the deal. The indicator also displays the lines with the help of which the arrow signals are formed, taking into account the int
Koala Fibo Base Time
Ashkan Hazegh Nikrou
3 (1)
Welcome to Koala Fibo Base Time Welcome to Koala Fibo Time Zone Welcome to Koala Fibo Time Extention Welcome to Missed Tool For Meta Trade! Simple Introduction : Fibonacci Time Zones are vertical lines based on the Fibonacci Sequence. These lines extend along the X axis (date axis) as a mechanism to forecast reversals based on elapsed time. A major low or high is often chosen as the starting point. Distances start relatively small and grow as the Fibonacci Sequence extends. Chartists can exten
FREE
Title : Market Bias Indicator - Oscillator-Based Trading Tool Introduction : Discover the potential of the "Market Bias Indicator," a revolutionary oscillator-based trading tool designed for precise market analysis. If you're in search of a robust alternative to traditional bias indicators, your quest ends here. Market Bias Indicator offers unparalleled accuracy in identifying market sentiment and is your gateway to confident trading decisions. Recommended Trading Pairs : Market Bias Indicator i
Trend Ray
Andriy Sydoruk
The indicator shows the potential trend direction by cyclical-wave dependence. Thus, all the rays of the intersection will be optimal rays, in the direction of which the price is expected to move, taking into account the indicator period. Rays can be used as a direction for potential market movement. But we must not forget that the approach must be comprehensive, the indicator signals require additional information to enter the market.
In the stock market technical analysis, support and resistance is a concept that the movement of the price of a security will tend to stop and reverse at certain predetermined price levels. Support and resistance levels can be identified on any timeframe. However, the most significant ones are found on the higher time frames, such as daily, weekly, and monthly. This indicator using the weekly OHLC data to identify the relevant levels. This is a support and resistance indicator and providing majo
Diamond Trend
Segundo Calvo Munoz
Indicator which identifies Trend and also buy/sell opportunities. Use for entries aligned to the Trend.  Although Diamond Trend is very accurate identifying entry points, it is always recommended to use a support indicator in order to reconfirm the operation. Remind to look for those Assets and Timeframes which best fit to your trader behavior/need... Valid for Scalping and Long Term operations. Please, set up a Bars Chart to be able to visualize the indicator properly...  ...And remind to give
Trend Scanner
Vladimir Kalendzhyan
4.38 (8)
By purchasing this indicator, you have the right to receive a free copy of one of   my other indicator's or advisor’s!  (All future updates are included. No limits) . To get it , please contact me by  mql5 message ! The Trend Scanner trend line indicator displays the trend direction and its changes. The indicator works on all currency pairs and  timeframes. The indicator simultaneously displays multiple readings on the price chart: the support and resistance lines of the currency pair, the exist
New, more accurate version of the Xmaster indicator. More than 200 traders from around the world have conducted more than 15,000 tests of different combinations of this indicator on their PCs in order to get the most effective and accurate formula. And here we present to you the "Xmaster formula indicator forex no repaint" indicator, which shows accurate signals and does not repaint. This indicator also sends signals to the trader by email and push. With the arrival of each new tick, it constan
Fibonacci SR Indicator
Martin Eshleman
3 (2)
Fibonacci SR Indicator This indicator creates support and resistance lines. This indicator is based on Fibonacci Retracement and Extension levels. It will consider many combinations of the Fibonacci levels and draw support/resistance lines based on these. This indicator uses tops and bottoms drawn by the ZigZag indicator in its calculations. The ZigZag can also be drawn on the chart, if necessary. The indicator considers many combinations of past reversal points and Fibonacci ratio levels, and
FREE
Laguerre SuperTrend Clouds adds an Adaptive Laguerre averaging algorithm and alerts to the widely popular SuperTrend indicator. As the name suggests, Laguerre SuperTrend Clouds (LSC) is a trending indicator which works best in trendy (not choppy) markets. The SuperTrend is an extremely popular indicator for intraday and daily trading, and can be used on any timeframe. Incorporating Laguerre's equation to this can facilitate more robust trend detection and smoother filters. The LSC uses the impro
Quantum Heiken Ashi PRO MT4
Bogdan Ion Puscasu
4.43 (7)
소개       Quantum Heiken Ashi PRO   차트 시장 동향에 대한 명확한 통찰력을 제공하도록 설계된 Heiken Ashi 양초는 노이즈를 필터링하고 잘못된 신호를 제거하는 기능으로 유명합니다. 혼란스러운 가격 변동에 작별을 고하고 더 매끄럽고 신뢰할 수 있는 차트 표현을 만나보세요. Quantum Heiken Ashi PRO를 정말 독특하게 만드는 것은 전통적인 촛대 데이터를 읽기 쉬운 색상 막대로 변환하는 혁신적인 공식입니다. 빨간색과 녹색 막대는 각각 약세와 강세 추세를 우아하게 강조하여 잠재적 진입점과 퇴장점을 매우 정확하게 파악할 수 있습니다. Quantum EA 채널:       여기를 클릭하세요 MT5 버전:       여기를 클릭하세요 이 놀라운 지표는 다음과 같은 몇 가지 주요 이점을 제공합니다. 선명도 향상: Heiken Ashi 바는 가격 변동을 완화하여 시장 추세를 보다 명확하게 나타내므로 유리한 거래 기회를 쉽게 식별할 수 있
Owl smart levels
Sergey Ermolov
4.58 (55)
MT5 버전  |   FAQ Owl Smart Levels Indicator 는   Bill Williams 의 고급 프랙탈, 시장의 올바른 파동 구조를 구축하는 Valable ZigZag, 정확한 진입 수준을 표시하는 피보나치 수준과 같은 인기 있는 시장 분석 도구를 포함하는 하나의 지표 내에서 완전한 거래 시스템입니다. 시장과 이익을 취하는 장소로. 전략에 대한 자세한 설명 표시기 작업에 대한 지침 고문-거래 올빼미 도우미의 조수 개인 사용자 채팅 ->구입 후 나에게 쓰기,나는 개인 채팅에 당신을 추가하고 거기에 모든 보너스를 다운로드 할 수 있습니다 힘은 단순함에 있습니다! Owl Smart Levels   거래 시스템은 사용하기 매우 쉽기 때문에 전문가와 이제 막 시장을 연구하고 스스로 거래 전략을 선택하기 시작한 사람들 모두에게 적합합니다. 전략 및 지표에는 눈에 보이지 않는 비밀 공식 및 계산 방법이 없으며 모든 전략 지표는 공개되어 있습니다. Owl Smart Lev
Super Auto Fibonacci
Muhammed Emin Ugur
Discover the power of precision and efficiency in your trading with the " Super Auto Fibonacci " MT4 indicator. This cutting-edge tool is meticulously designed to enhance your technical analysis, providing you with invaluable insights to make informed trading decisions. Key Features: Automated Fibonacci Analysis: Say goodbye to the hassle of manual Fibonacci retracement and extension drawing. "Super Auto Fibonacci" instantly identifies and plots Fibonacci levels on your MT4 chart, saving you tim
FREE
이 제품의 구매자들이 또한 구매함
Atomic Analyst
Issam Kassas
5 (3)
우선적으로 언급할 점은이 거래 지표가 다시 그리지 않고 지연되지 않으며 이를 통해 수동 및 로봇 거래 모두에 이상적이라는 점입니다. 사용자 매뉴얼: 설정, 입력 및 전략. Atomic Analyst는 가격의 강도와 모멘텀을 활용하여 시장에서 더 나은 이점을 찾는 PA Price Action Indicator입니다. 고급 필터를 장착하여 잡음과 거짓 신호를 제거하고 거래 잠재력을 높이는 데 도움이 됩니다. 복잡한 지표의 다중 레이어를 사용하여 Atomic Analyst는 차트를 스캔하고 복잡한 수학적 계산을 간단한 신호와 색상으로 변환하여 초보 트레이더가 이해하고 일관된 거래 결정을 내릴 수 있도록합니다. "Atomic Analyst"는 새로운 및 경험이 풍부한 트레이더를위한 종합적인 거래 솔루션입니다. 프리미엄 지표와 최고 수준의 기능을 하나의 거래 전략에 결합하여 모든 종류의 트레이더에 대한 다재다능한 선택지가되었습니다. 인트라데이 거래 및 스캘핑 전략 : 빠르고 정확한
Scalper Inside PRO
Alexey Minkov
4.75 (60)
An exclusive indicator that utilizes an innovative algorithm to swiftly and accurately determine the market trend. The indicator automatically calculates opening, closing, and profit levels, providing detailed trading statistics. With these features, you can choose the most appropriate trading instrument for the current market conditions. Additionally, you can easily integrate your own arrow indicators into Scalper Inside Pro to quickly evaluate their statistics and profitability. Scalper Inside
Gold Stuff
Vasiliy Strukov
4.9 (269)
Gold Stuff는 금을 위해 특별히 설계된 추세 지표이며 모든 금융 상품에서도 사용할 수 있습니다. 표시기가 다시 그려지지 않고 지연되지 않습니다. 권장 기간 H1. 표시기에서 완전 자동 Expert Advisor EA Gold Stuff를 작동합니다. 내 프로필에서 찾을 수 있습니다. 설정 및 개인 보너스를 받으려면 구매 후 즉시 저에게 연락하십시오!   강력한 지원 및 트렌드 스캐너 표시기의 무료 사본을 받으실 수 있습니다. 메시지를 보내주세요. 나!   설정 화살표 그리기 - 켜기 끄기. 차트에 화살표 그리기. 경고 - 가청 경고를 끕니다. 이메일 알림 - 켜기 끄기. 이메일 알림. Puch-notification - 켜기 끄기. 푸시 알림. 다음으로 색 영역을 조정합니다. Gold Stuff는 금을 위해 특별히 설계된 추세 지표이며 모든 금융 상품에서도 사용할 수 있습니다. 표시기가 다시 그려지지 않고 지연되지 않습니다. 권장 기간 H1. 표시기에서 완
현재 20% 할인 ! 초보자 또는 전문가 트레이더를 위한 최고의 솔루션! 이 대시보드 소프트웨어는 28개의 통화 쌍에서 작동합니다. 2가지 주요 지표(Advanced Currency Strength 28 및 Advanced Currency Impulse)를 기반으로 합니다. 전체 Forex 시장에 대한 훌륭한 개요를 제공합니다. 고급 통화 강도 값, 통화 이동 속도 및 모든(9) 시간대의 28 Forex 쌍에 대한 신호를 보여줍니다. 추세 및/또는 스캘핑 기회를 정확히 파악하기 위해 차트의 단일 지표를 사용하여 전체 시장을 볼 수 있을 때 거래가 어떻게 개선될지 상상해 보십시오! 잠재적인 거래를 식별하고 확인하면서 강력한 통화와 약한 통화를 더욱 쉽게 식별할 수 있도록 이 지표에 기능을 내장했습니다. 이 표시기는 통화의 강세 또는 약세가 증가 또는 감소하는지 여부와 모든 시간대에서 수행되는 방식을 그래픽으로 보여줍니다. 추가된 새로운 기능은 현재 시장 조건 변화에 적
Enigmera
Ivan Stefanov
5 (4)
에니메라: 시장의 핵심 https://www.enigmera.com 소개 이 지표 및 트레이딩 시스템은 금융 시장에 대한 놀라운 접근 방식입니다. 에니메라는 프랙탈 주기를 사용하여 지지선과 저항선을 정확하게 계산합니다. 진정한 축적 단계를 보여주고 방향과 목표를 제시합니다.  추세에 있든 조정에 있든 작동하는 시스템입니다.  어떻게 작동하나요? 에니메라는 지지선/저항선, 목표선, 편차선의 세 가지 라인으로 구성됩니다. 이 시스템은 과거 데이터를 현재와 미래로 추정하는 일반적인 시장 지표와 달리 현재에 대한 완전한 그림을 제공합니다. 지지선 위에 있으면 실제 지지를 의미하고 저항선 위에 있으면 실제 저항을 의미합니다. 레벨이 깨지면 추세의 변화를 나타냅니다. 다시 그리지 않습니다. 시장이 지속적으로 진화함에 따라 에니메라는 평가 도구를 조정하여 전략을 정기적으로 수정합니다.   이를 통해 모든 시나리오를 철저히 평가할 수 있습니다. 이 시장 지표의 고유성은 분명하며 그 기
PZ Day Trading
PZ TRADING SLU
3.67 (3)
Effortless trading: non-repainting indicator for accurate price reversals Special Offer: Purchase now to receive free bonuses worth $189! (Read more for details) This indicator detects price reversals in a zig-zag fashion, using only price action analysis and a donchian channel. It has been specifically designed for short-term trading, without repainting or backpainting at all. It is a fantastic tool for shrewd traders aiming to increase the timing of their operations. [ Installation Guide | Up
Gold Channel XAUUSD
Paulo Rocha
5 (2)
Gold Channel is a volatility-based indicator, developed with a specific timing algorithm for the XAUUSD pair, which consists of finding possible corrections in the market. This indicator shows two outer lines, an inner line (retracement line) and an arrow sign, where the theory of the channel is to help identify overbought and oversold conditions in the market. The market price will generally fall between the boundaries of the channel. If prices touch or move outside the channel it is a tra
Apollo Pips PLUS SP
Oleg Rodin
5 (3)
제품을 구매하기 전에 아래 정보를 읽어보세요! Apollo Pips PLUS SP는 독특한 제품입니다! 모든 거래 지표에 액세스할 수 있는 새로운 "APOLLO PIPS" 지표와 "슈퍼 팩" 보너스를 받고 싶은 분들을 위한 것입니다! Apollo Pips PLUS SP 제품을 구매하면 실제로 Apollo Pips 표시기의 완전히 새로운 버전을 구매하게 됩니다. 이 버전의 지표에는 개선된 알고리즘과 사용하기 쉬운 매개변수가 있어 모든 시장 및 거래 스타일에서 지표를 사용할 수 있는 기회를 제공합니다. 이 제품의 구매자는 슈퍼 보너스로 다른 모든 표시기에 무료로 액세스할 수 있습니다! 내 모든 거래 도구에 액세스하고 싶었다면 이 제품이 당신에게 딱 맞습니다! :) 하지만 이것이 전부는 아닙니다! :) 이 제품의 모든 구매자는 또한 내 새로운 지표를 무료로 받을 자격이 있습니다! :) 새로운 거래 지표를 사용할 수 있게 되었는데, 귀하는 저의 특별한 "SUPER PACK" 평생 보너스
RelicusRoad Pro
Relicus LLC
4.73 (141)
이제 $ 147 (몇 가지 업데이트 후 $ 499 증가) - 무제한 계정 (PCS 또는 MACS) RelicusRoad 사용 설명서 + 교육 비디오 + 비공개 Discord 그룹 액세스 + VIP 상태 시장을 보는 새로운 방법 RelicusRoad는 외환, 선물, 암호화폐, 주식 및 지수에 대한 세계에서 가장 강력한 거래 지표로서 거래자에게 수익성을 유지하는 데 필요한 모든 정보와 도구를 제공합니다. 우리는 초보자부터 고급까지 모든 거래자가 성공할 수 있도록 기술적 분석 및 거래 계획을 제공합니다. 미래 시장을 예측할 수 있는 충분한 정보를 제공하는 핵심 거래 지표입니다. 우리는 차트에서 말이 안 되는 여러 지표 대신 완전한 솔루션을 믿습니다. 타의 추종을 불허하는 매우 정확한 신호, 화살표 + 가격 조치 정보를 표시하는 올인원 표시기입니다. 강력한 AI를 기반으로 하는 RelicusRoad는 누락된 정보와 도구를 제공하여 교육하고 성공적인 트레이더인 트레이딩 전문
XQ Indicator MetaTrader 4
Marzena Maria Szmit
3.67 (3)
Step into the realm of Forex trading with confidence and precision using XQ, a cutting-edge Forex indicator designed to elevate your trading game to unprecedented heights. Whether you're a seasoned trader or just stepping into the world of currency exchange,   XQ Forex Indicator   empowers you with the insights and signals needed to make informed trading decisions. The signal conditions are a combination of three indicators, and XQ Forex Indicator only display  medium and long-term trends . The
TPSpro RFI Levels
Roman Podpora
4.83 (24)
Reversal First Impulse levels (RFI)    INSTRUCTIONS        RUS       -       ENG              R ecommended to use with an indicator   -   TPSpro  TREND PRO -  Version MT5 A key element in trading is zones or levels from which decisions to buy or sell a trading instrument are made. Despite attempts by major players to conceal their presence in the market, they inevitably leave traces. Our task was to learn how to identify these traces and interpret them correctly. Main functions: Displaying activ
Best Currency Strength Indicator
Tumelo Patrick Rakotsoane
4.6 (48)
Advanced Currency Strength Indicator The Advanced Divergence Currency Strength Indicator. Not only it breaks down all 28 forex currency pairs and calculates the strength of individual currencies across all timeframes , but, You'll be analyzing the WHOLE forex market in 1 window (In just 1 minute) . This indicator is very powerful because it reveals the true movements of the market.  It is highly recommended to  analyze charts knowing the performance of individual currencies or the countries ec
GOLD Impulse with Alert
Bernhard Schweigert
4.56 (9)
이 지표는 Advanced Currency IMPULSE with ALERT  +   Currency Strength Exotics  의 2가지 제품의 슈퍼 조합입니다. 그것은 모든 시간 프레임에 대해 작동하며 8개의 주요 통화와 하나의 기호에 대한 강약의 충동을 그래픽으로 보여줍니다! 이 표시기는 금, 이국적인 쌍, 상품, 지수 또는 선물과 같은 기호에 대한 통화 강도 가속을 표시하는 데 특화되어 있습니다. 금, 은, 오일, DAX, US30, MXN, TRY, CNH 등의 진정한 통화 강도 가속(충동 또는 속도)을 표시하기 위해 9번째 줄에 모든 기호를 추가할 수 있습니다. 새로운 기본 알고리즘을 기반으로 구축되어 잠재적인 거래를 훨씬 더 쉽게 식별하고 확인할 수 있습니다. 이는 통화의 강세 또는 약세가 가속되는지 여부를 그래픽으로 표시하고 가속 속도를 측정하기 때문입니다. 자동차의 속도계처럼 생각하면 됩니다. 가속화할 때 Forex 시장에서 동일한 일이 분명히
TPSproTREND PrO
Roman Podpora
4.78 (18)
TPSpro TRENDPRO  - is a trend indicator that automatically analyzes the market and provides information about the trend and each of its changes, as well as giving signals for entering trades without redrawing! The indicator uses each candle, analyzing them separately. referring to different impulses - up or down impulse. Exact entry points into transactions for currencies, crypto, metals, stocks, indices!  Version MT5             DETAILED DESCRIPTION              R ecommended to use with an indi
Entry Points Pro
Yury Orlov
4.7 (226)
다시 색을 칠하지 않고 거래에 진입할 수 있는 정확한 신호를 제공하는 MT4용 지표입니다. 외환, 암호화폐, 금속, 주식, 지수 등 모든 금융 자산에 적용할 수 있습니다. 매우 정확한 추정값을 제공하고 매수와 매도의 가장 좋은 시점을 알려줍니다. 하나의 시그널로 수익을 내는 지표의 예와 함께 비디오 (6:22)시청하십시오! 대부분의 거래자는 Entry Points Pro 지표의 도움으로 첫 거래 주 동안 트레이딩 결과를 개선합니다. 저희의   Telegram Group 을 구독하세요! Entry Points Pro 지표의 좋은점. 재도색이 없는 진입 신호 신호가 나타나고 확인되면(시그널 캔들이 완성된 경우) 신호는 더 이상 사라지지 않습니다. 여타 보조지표의 경우 신호를 표시한 다음 제거되기 때문에 큰 재정적 손실로 이어집니다. 오류 없는 거래 게시 알고리즘을 통해 트레이드(진입 또는 청산)를 할 이상적인 순간을 찾을 수 있으며, 이를 통해 이를 사용하는 모든 거래자의
Max Paynex
Abdulkarim Karazon
Max Payne은 화살표 형태로 신호를 제공하는 반전/추세 신호 지표입니다. 이 지표는 동일한 막대 종가에 신호를 제공하며, 이 지표는 신호의 이중/삼중 확인을 위해 다양한 기간으로 차트에서 여러 번 떨어질 수 있습니다. 표시기는 다시 칠하거나 다시 칠하지 않는 동안 모든 거래 스타일에 맞게 고도로 조정 가능합니다. 사용된 템플릿과 함께 구매 후 스크린샷에 표시된 전체 시스템을 얻을 수 있습니다. ----------------- 거래 방법: 트렌드 필터(구매 후 얻을 수 있는 Payne 트렌드)가 방향에 동의하는 동안 동일한 바에서 세 번의 확인을 받을 때까지 기다리세요. 거래를 개시하고 매수 거래의 경우 황금색 화살표(템플릿) 아래에 정지 손실을 설정하고 매도 거래의 경우 황금색 화살표(템플릿) 위에 설정하면 종료 신호는 반대쪽 첫 번째 흰색 점 신호(템플릿)입니다. ----------------- 매개변수: 신호주기 : 화살표주기 필터: 신호 필터 거리 : 양초로부터의 화살표
Quantum Currency Array Indicator
QUANTUM TRADING SOFTWARE LIMITED
This indicator has been developed to identify and display these trends quickly and easily, allowing you to see instantly, those currency pairs which are trending, and those which are not – and in all timeframes, with just one click. The 28 currency pairs are displayed as a fan as they sweep from strong to weak and back again, and this is why we call it the ‘currency array’. All 28 pairs are arrayed before you, giving an instant visual description of those pairs that are trending strongly, those
Noise filtering: the key to mastering trends This indicator tracks the market trend with an unmatched reliability, by ignoring sudden fluctuations and market noise. It has been designed to trend-trade intraday charts and small timeframes. Its winning ratio is around 85%. [ Installation Guide | Update Guide | Troubleshooting | FAQ | All Products ] Amazingly easy to trade Find oversold/overbought situations Enjoy noise-free trading at all times Avoid being whipsawed in intraday charts The indicat
Market Swing Index MSI
Elias Mtwenge
5 (1)
JULY OFFER 80% OFF next price for unlimited version will be 17000$. This is the only time you can get this institutional and professional indicator at this price for unlimited version. Don't dare to miss this. The tool I am about to introduce to you you can't compare it with other tools due to its strategy and accuracy level in predicting the next price directional movement . This tool is designed for serious traders who have decided to make a difference through trading. Be the next person to wi
Quantum Trend Sniper Indicator MT4
Bogdan Ion Puscasu
4.61 (41)
소개       Quantum Trend Sniper Indicator는   추세 반전을 식별하고 거래하는 방식을 변화시키는 획기적인 MQL5 지표입니다! 13년 이상의 거래 경험을 가진 숙련된 트레이더 팀이 개발한       Quantum Trend Sniper 표시기       매우 높은 정확도로 추세 반전을 식별하는 혁신적인 방법으로 거래 여정을 새로운 차원으로 끌어올리도록 설계되었습니다. ***Quantum Trend Sniper Indicator를 구입하면 Quantum Breakout Indicator를 무료로 받을 수 있습니다!*** Quantum Trend Sniper Indicator는 추세 반전을 식별하고 세 가지 이익실현 수준을 제안할 때 경고, 신호 화살표를 제공합니다. 초보자 거래자와 전문 거래자 모두에게 적합합니다. Quantum EA 채널:       여기를 클릭하세요 MT5 버전:       여기를 클릭하세요
FX Volume
Daniel Stein
4.61 (36)
모닝 브리핑을 통해 세부 정보와 스크린샷으로 매일 시장 업데이트를 받으세요 여기 mql5 및 텔레그램에서 FX 거래량은 브로커의 관점에서 시장 심리에 대한 실제 통찰력을 제공하는 최초이자 유일한 거래량 지표입니다. 브로커와 같은 기관 시장 참여자가 외환 시장에서 어떤 포지션을 취하고 있는지에 대한 훌륭한 통찰력을 COT 보고서보다 훨씬 빠르게 제공합니다. 차트에서 이 정보를 직접 확인하는 것은 트레이딩의 진정한 판도를 바꾸고 획기적인 솔루션입니다. 다음과 같은 고유한 시장 데이터 인사이트의 이점 비율 는 통화의 매수/매도 포지션 비율을 백분율로 표시 비율 변화 는 선택한 기간 내 매수 비율과 비율 변화를 표시 총 거래량 는 해당 통화의 총 거래량(롱 및 숏)을 로트 단위로 보여줍니다 Volumes Long 는 해당 통화의 모든 롱 포지션의 거래량을 보여줍니다 Volumes Short 는 해당 통화의 모든 숏 포지션의 거래량을 보여줍니다 Net Long 는 순 롱 포지션의 거래량
Cycle Sniper
Elmira Memish
4.44 (39)
NEW YEAR SALE PRICE FOR LIMITED TIME!!! Please contact us after your purchase and we will send you the complimentary indicators to complete the system Cycle Sniper is not a holy grail but when you use it in a system which is explained in the videos, you will feel the difference. If you are not willing to focus on the charts designed with Cycle Sniper and other free tools we provide, we recommend not buying this indicator. We recommend watching the videos about the indiactor and system before pu
"The Squeeze indicator attempts to identify periods of consolidation in a market. In general the market is either in a period of quiet consolidation or vertical price discovery. By identifying these calm periods, we have a better opportunity of getting into trades with the potential for larger moves. Once a market enters into a "squeeze," we watch the overall market momentum to help forecast the market direction and await a release of market energy." Modified TTM Squeeze Indicator is a modifica
"MultiSymbol & TF Chart Integrated" 지표는 단일 차트(다중 모드)에서 최대 60개의 통화 쌍을 선호하는 시간대에 따라 모니터링하거나 모든 TF에서 거래 중인 통화 쌍을 볼 수 있도록 빠르게 포괄적인 시장 전망을 제공하도록 설계되었습니다(단순 모드). 주요 장점: 완전 모니터링: 단일 차트에서 모든 원하는 쌍을 한 눈에 실시간으로 모니터링할 수 있습니다. 시간 절약: 차트 간 전환 필요 없이 각 쌍의 행동을 실시간으로 확인할 수 있습니다. 추세 분석: 추세를 따르는 트레이더에게 적합하며, 결정하기 전에 추세를 확인하기 위해 상위 시간대를 볼 수 있습니다. 극한 사용자 정의: 지표의 모든 측면을 특정 요구에 맞게 조정합니다. 극한 사용자 정의: 높은 구성 가능성 지표 매개변수: 심볼 및 시간대: 최대 60개의 다른 심볼을 구성할 수 있습니다. 각 심볼은 고유한 시간대를 가질 수 있습니다(예: M1, M5, M15, M30, H1, H4, D1, W1
Pair Trading Station MT4
Young Ho Seo
3.67 (3)
How to use Pair Trading Station Pair Trading Station is recommended for H1 time frame and you can use it for any currency pairs. To generate buy and sell signal, follow few steps below to apply Pair Trading Station to your MetaTrader terminal. When you load Pair Trading Station on your chart, Pair Trading station will assess available historical data in your MetaTrader platforms for each currency pair. On your chart, the amount of historical data available will be displayed for each currency pai
AT Forex Indicator MT4
Marzena Maria Szmit
5 (3)
The AT Forex Indicator MT4 is a sophisticated trading tool designed to provide traders with a comprehensive analysis of multiple currency pairs. This   powerful indicator   simplifies the complex nature of the forex market, making it accessible for both novice and experienced traders. AT Forex Indicator uses   advanced algorithms   to detect trends, patterns and is an essential tool for traders aiming to enhance their forex trading performance. With its robust features, ease of use, and reliabl
Swing Master Indicator
Elias Mtwenge
5 (1)
Dear Traders this is my another tool called " Swing Master Indicator ". As the name above the indicator is designed to help you in swing trading by capturing the low and highs of the price. You may us this tool with any trading strategy and style from scalping to position trading. It is made for level of traders including newbies and advanced traders even prop-firms, hedge funds and banks to help them make sold market analysis. I create tools for serious traders who want to make a difference in
Ultimate Sniper Dashboard
Hispraise Chinedum Abraham
4.85 (27)
299달러로 할인! 추후 가격이 인상될 수 있습니다! 아래 설명을 읽어보세요! Ultimate Sniper Dashboard를 위한 최고의 엔트리 시스템: ULTIMATE DYNAMIC LEVELS. (내 제품을 확인하십시오) Ultimate Sniper Dashboard는 MT4 다중 통화 테스트 제한으로 인해 라이브 시장에서만 작동합니다. Ultimate-Sniper 대시보드를 소개합니다! HA-Sniper와 MA-Sniper를 모두 포함하는 최고의 제품입니다. 그리고 많은 특수 모드. Ultimate Sniper Dashboard는 절대 야수입니다! 초보자 또는 전문가 트레이더를 위한 최고의 솔루션! 다시 움직임을 놓치지 마세요! 단순함과 핍을 좋아하는 트레이더를 위해 특별한 제품을 준비했습니다. 본질적으로 단순한 대시보드는 여러 사용자 지정 알고리즘을 기반으로 28개의 통화 쌍을 살펴보는 모든 작업을 수행합니다. 단 하나의 차트로 전문가처럼 시장을 읽을 수 있습니다. 움직이기
ECM Channel MT4
Paulo Rocha
5 (1)
ECM Elite Channel is a volatility-based indicator, developed with a specific time algorithm, which consists of finding possible corrections in the market. This indicator shows two outer lines, an inner line (retracement line) and an arrow sign, where the channel theory is to help identify overbought and oversold conditions in the market. The market price will generally fall between the boundaries of the channel. If prices touch or move outside the channel, it's a trading opportunity. The
NAM Order Blocks
NAM TECH GROUP, CORP.
5 (1)
MT4 Multi-timeframe Order Blocks detection indicator. Features - Fully customizable on chart control panel, provides complete interaction. - Hide and show control panel wherever you want. - Detect OBs on multiple timeframes. - Select OBs quantity to display. - Different OBs user interface. - Different filters on OBs. - OB proximity alert. - ADR High and Low lines. - Notification service (Screen alerts | Push notifications). Summary Order block is a market behavior that indicates order collection
제작자의 제품 더 보기
ON Trade Optuma Astro
Abdullah Alrai
5 (4)
물론입니다. 아래는 제공해주신 텍스트의 한국어 번역입니다: MT4용 천문학 지표 소개: 귀하의 최상급 하늘 트레이딩 동반자 트레이딩 경험을 천체의 높이로 끌어올리기 준비가 되셨나요? MT4용 천문학 지표를 소개합니다. 이 혁신적인 도구는 복잡한 알고리즘의 힘을 활용하여 탁월한 천문학적 통찰과 정밀한 계산을 제공합니다. 정보의 우주를 손에 담다: 천문학적 데이터의 보물함을 드러내는 포괄적인 패널을 살펴보세요. 행성의 지오/헬리오센트릭 좌표, 태양/지구 거리, 크기, 길이, 별자리, 황도 좌표 및 적도 좌표, 심지어 수평 좌표 등 각각이 정밀하게 계산되고 아름답게 제시됩니다. 지표에 의해 생성된 수직선은 시간 값에 해당하여 트레이딩 여정에 우주적인 시각을 부여합니다. 행성 라인과 관계: 수정 가능한 스케일과 각도로 차트를 장식하는 행성 라인의 마법을 경험해보세요. 직관적인 컨트롤 패널을 통해 각 행성의 라인의 가시성을 손쉽게 전환할 수 있습니다. 쥰션이나 섹스타일, 사분각, 삼분각, 트
간 스퀘어 지표는 W.D. 간이 쓴 "시장 예측을 위한 수학적 공식" 기사에 기반한 강력한 시장 분석 도구입니다. 이 도구는 수학적 개념과 간 이론을 사용하여 정확한 시장 분석을 수행합니다. 144, 90, 52의 제곱과 9의 제곱을 사용합니다. 또한 의 9의 제곱근 및 해당 제곱의 채널 및 스타 패턴과의 관련성을 통합합니다. 사용자 메뉴얼 및 적용: 이 지표를 사용하기 전에 사용자 메뉴얼을 읽고 질문이 있을 경우 문의하시기 바랍니다. 전체 메뉴얼은 웹사이트에서 제공됩니다. MT5의 전체 버전을 구매하거나 MT4의 무료 버전을 테스트할 수 있습니다. 두 버전 모두 링크에서 확인하실 수 있습니다. 주요 기능 및 기능: 간 스퀘어 지표는 정확한 결정을 위해 기하학적 개념과 간 이론을 활용하는 시장 분석을 위한 포괄적인 도구 집합을 제공합니다. 주요 기능은 다음과 같습니다. 9의 제곱 분석: 이 지표는 9의 제곱에 대한 수평 선, 스타 패턴, 그리드 및 간 팬을 그릴 수 있습니다. 간 이
ON Trade Waves Patterns Harmonic Elliot Wolfe를 소개합니다. 이는 수동 및 자동 방법을 사용하여 다양한 시장 패턴을 감지하기 위해 개발된 고급 지표입니다. 다음은 그 작동 방식입니다: 조화적 패턴: 이 지표는 차트에 나타나는 조화적 패턴을 식별할 수 있습니다. 이러한 패턴은 Scott Carney의 "Harmonic Trading vol 1 및 2"에서 설명한 것처럼 조화적 거래 이론을 연습하는 트레이더에게 중요합니다. 수동으로 그리든 자동 감지를 사용하든 ON Trade Waves Patterns가 도움을 줄 것입니다. 컨트롤 패널: 이 지표에는 사용자 친화적인 컨트롤 패널이 있습니다. 차트 및 시간 프레임 설정을 저장하여 다양한 구성 간에 쉽게 전환할 수 있습니다. 차트 공간을 최대화하려면 최소화할 수도 있습니다. 다른 분석 도구를 사용하는 것을 선호하는 경우 닫기 버튼을 클릭하여 모든 지표 데이터를 숨길 수 있습니다. 템플릿 저장: 설정을 사
이 인디케이터는 엘리어트 파동 이론과 두 가지 방식으로 작동합니다: 자동 작동: 이 모드에서는 인디케이터가 엘리어트 파동 이론에 따라 차트 상의 모든 5개의 모티브 웨이브를 자동으로 감지하고 예측 및 잠재적인 반전 지역을 제공합니다. 또한 중요한 개발 사항을 트레이더에게 알릴 수 있는 경보 및 푸시 메시지를 생성할 수 있는 능력을 갖추고 있습니다. 이 자동 기능은 엘리어트 파동 패턴의 식별과 분석 프로세스를 간소화합니다. 수동 작동: 이 옵션은 엘리어트 파동 이론을 수동으로 다루고 싶은 트레이더를 위해 설계되었습니다. 이를 통해 사용자는 아홉 가지 다른 등급을 사용하여 웨이브를 그릴 수 있습니다. 각 등급은 나타난 후에 차트에 그려진 라인을 조정하여 개별적으로 정의할 수 있습니다. 이 기능은 웨이브를 수동으로 그리는 프로세스를 간소화하며 더 효율적으로 만들어 줍니다. 중요한 점으로 모든 그림 데이터가 미래 참조를 위해 플랫폼 데이터 폴더에 저장된다는 것을 기억해야 합니다. 파라미터:
ON Trade Pivoteer
Abdullah Alrai
4 (1)
Introducing the Pivot Point Selector Indicator: Your Ultimate Tool for Custom Pivot Levels Are you ready to take your trading to the next level? Say hello to the Pivot Point Selector Indicator, a game-changing tool that puts you in control of your pivot levels. This innovative indicator empowers you to choose three specific points that will determine the pivot level calculations, giving you unparalleled customization and precision in your trading strategy. Key Features and Benefits: Custom Pivo
FREE
Shepherd Harmonic Patterns Free
Abdullah Alrai
4.73 (26)
This indicator will detect harmonic patterns that are drawn on the chart by manual and automatic methods. You can see user manual from this link: https://www.mql5.com/en/blogs/post/719257 There is a free version (it detect only Gartley and Nenstar Patterns) to try this product. You can buy the full MT4 version from: https://www.mql5.com/en/market/product/104689 Notes When you use this indicator and change the settings, add indicators like Moving Average or Bollinger Bands, this indicator will
FREE
Shepherd Gann Squares Free
Abdullah Alrai
4.86 (37)
이 지표는 W.D. Gann이 작성한 "시장 예측을 위한 수학 공식" 기사를 기반으로 하는 시장 분석 방법으로 9의 제곱과 144의 제곱 방법에 따라 다릅니다. 사용자 매뉴얼: Add Your review And contact us to get it 다음에서 전체 MT5 버전을 구입할 수 있습니다. https://www.mql5.com/en/market/product/28669 MT4에서 무료로 테스트할 수 있습니다. https://www.mql5.com/en/market/product/15316 이 제품은 레벨/스타/그리드/간 팬/으로 9의 정사각형을 그릴 수 있습니다. Gann Squares: 52/90/144도 그릴 것입니다. Chart 에 이동 가능한 Free Gann Star 를 직접 그립니다 . 그것은 또한 Gann 다이아몬드를 그릴 것입니다. 그것은 당신이 당신의 항목에 대한 최고의 로트를 계산할 수 있도록 로트 계산기
FREE
Hikkake 일본 캔들 패턴 인디케이터는 차트에 형성되는 모든 Hikkake 가격 액션 패턴을 식별하고 감지하기 위해 특별히 설계된 전문 도구입니다. 이 패턴은 내부 바에서의 가짜 돌파 개념을 기반으로 합니다. 이 인디케이터는 차트의 마지막 다섯 개의 캔들을 분석하여 Hikkake 패턴의 특성이 충족되는지 여부를 결정합니다. 이 패턴이 확인되면 해당 패턴을 구성하는 캔들 주위에 사각형을 그려 트레이더가 패턴을 더 쉽게 식별하고 해석할 수 있도록 돕습니다. 인디케이터의 주요 기능: 패턴 감지: Hikkake 인디케이터는 특히 Hikkake 가격 액션 패턴을 감지하고 강조하는 데 특화되어 있습니다. 이러한 패턴은 내부 바 형성에서 가짜 돌파 개념을 중심으로 합니다. 마지막 다섯 개 캔들의 확인: Hikkake 패턴의 존재를 확인하기 위해 인디케이터는 차트의 마지막 다섯 개의 캔들을 연구합니다. 이 캔들의 배열과 관계를 평가하여 패턴의 기준을 충족하는지 여부를 판단합니다. 사각형 시각화
This indicator offers a comprehensive and efficient solution for traders seeking optimal entries in scalping strategies. Leveraging moving averages and stochastic indicators, it employs a systematic approach to identify favorable trade opportunities. The indicator goes beyond mere analysis, actively drawing clear and actionable entry points on your chart, denoted by arrows. Moreover, it provides the convenience of alerts to ensure you never miss these potential setups. Key Features and Benefits:
FREE
ON Trade 마루보즈 카들 패턴 인디케이터 마루보즈 캔들 패턴은 시장 감정 및 잠재적인 트렌드 반전에 대한 유용한 통찰력을 제공할 수 있는 강력하고 직관적인 캔들 패턴입니다. 이 패턴은 한쪽 방향의 주요 트렌드를 따라 길게 뻗은 본체와 한쪽 끝에 매우 작거나 없는 그림자(물개)를 가진 캔들로 특징지어집니다. 이 패턴은 매수자와 매도자 간의 강력한 불균형을 나타내며, 시장의 움직임이 강력하게 한쪽으로 치우쳐져 있다는 것을 시사합니다. 특징 및 장점: 명확한 시장 감정: 마루보즈 캔들은 시장의 주요 감정을 명확하게 나타냅니다. 상승(흰색) 마루보즈는 개장가에서 종가까지 강력한 매수 압력을 나타내며, 하락(검정색) 마루보즈는 강력한 매도 압력을 나타냅니다. 트렌드 지속 또는 반전: 맥락에 따라 마루보즈 패턴은 트렌드 지속 또는 잠재적인 트렌드 반전을 나타낼 수 있습니다. 장기적인 트렌드 이후에 나타날 경우 해당 트렌드의 지속을 나타낼 수 있습니다. 반대로, 서포트나 레지스턴스 영역 근
FREE
골드 그램 가격 계산기 인디케이터 소개 지역 통화에서의 금 가격을 항상 확인하고 싶으신가요? 더 이상 찾을 필요가 없습니다. 골드 그램 가격 계산기 인디케이터는 선호하는 지역 통화에서 그램 당 금 가격을 실시간으로 계산할 수 있는 혁신적인 도구를 제공합니다. 이 인디케이터를 통해 금융적인 통찰력을 활용하여 정보에 기반한 결정을 내릴 수 있습니다. 주요 특징: 지역화된 금 가격: 골드 그램 가격 계산기 인디케이터는 그램 당 금속 가격을 제공합니다. 구체적으로 그램 당 금 가격을 지역 통화에 맞게 조정한 것입니다. 이를 통해 익숙한 통화로 금 가치를 편리하게 추적할 수 있습니다. 사용자 친화적 설정: 우리의 인디케이터는 편의성을 고려하여 디자인되었습니다. 인디케이터 설정에서 직접 조정하거나 주요 차트에서 조정할 수 있어, 원활하고 맞춤화된 경험을 제공합니다. 매개변수 설명: Use_System_Theme (시스템 테마 사용): 선호하는 색상 스킴을 선택할 수 있는 옵션으로, 인디케이터의
FREE
ON Trade Pivots
Abdullah Alrai
ON Trade Pivots is A technical indicator that Draws all Pivot levels depending on time frame that defined in settings. Notes It will be good tool for all traders who use pivot levels in their trades. Let me inform you that this indicator draw this level as buffers not as objects then you can connect it easily to EA. This indicator allow you to find pivots levels for any time frame not only daily you are free to choose time frame from settings. Parameters Use_System_Visuals - Enable /Disable
FREE
이 인디케이터는 거래 차트에 돈치안 채널을 시각적으로 표시하는 목적으로 사용됩니다. 돈치안 채널은 특정 기간 동안의 최고점과 최저점 사이의 범위를 나타내는 간단한 기술 도구입니다. 이 인디케이터는 가격 움직임의 시각적 분석을 향상시키며 잠재적인 돌파 지점 및 추세 지속 포인트에 대한 통찰력을 제공합니다. 돈치안 채널은 현재 시간 프레임과 더 높은 시간 프레임 모두에 적용할 수 있으며 이 옵션을 활성화할 수 있습니다. 인디케이터 주요 기능: Use_System_Visuals: 이 매개변수를 활성화하면 시스템의 시각적 스타일 사용 또는 인디케이터의 외관을 사용자 정의할 수 있습니다. 활성화되면 인디케이터의 시각적 요소가 거래 플랫폼의 전반적인 테마에 일치하도록 조정됩니다. Signal_from_HT_Timeframe: 이 옵션을 활성화하면 더 높은 시간 프레임에서 신호를 수신할 수 있습니다. 다시 말해 더 긴 시간 프레임에서의 돈치안 채널 동작을 고려하여 현재 시간 프레임에서의 거래 결
FREE
ON Trade Angler
Abdullah Alrai
"이 지표는 간단한 트렌드 검출 도구입니다. 스캘핑 모드와 같은 전략과 함께 사용하여 좋은 진입점을 얻을 수 있습니다. 가격 주변에 채널을 그릴 것이며, 시간이 경과함에 따라 확장됩니다. 사용자 정의 기간에는 시간과 가격을 함께 고려하는 알고리즘에 따라 확장의 시작 지점으로 돌아갈 것입니다. 반전의 표시가 나타난 후 채널의 하한에서 매수할 수 있습니다. 그리고 반전의 표시를 본 후 채널의 상한에서 판매할 수 있습니다. 매개변수: 시스템 테마 사용: 여기서 테마를 선택할 수 있습니다. 계산 유형: 다음 세 가지 옵션 중에서 선택할 수 있습니다: 1- 원본 계산: 이 영역은 그 날의 트렌드를 정의하며, 이 영역 위에 열거나 아래에 열리면 됩니다. 2- 새로운 계산: 트렌드를 감지하는 데 의존할 채널을 그릴 것입니다. 3- Sheph: 새로운 계산 방법과 호환되지 않는 기호에 그려지는 수정된 채널입니다." 더 궁금한 사항이나 추가 지원이 필요하시면 언제든지 물어보세요!
Rsi Channel
Abdullah Alrai
5 (1)
This indicator displays the channel of Relative Strength Index. When you see that the price touches the red line and retreats from it many times, then you will know that the general trend is down. When it retreats from the blue line many times, that means that the general trend is up. This lines express the RSI values attributed to the price values on the main chart. You can add this indicator to your strategy, it will help you. This indicator will work best on 5 minutes and higher time frames.
이 인디케이터는 "회귀 채널 도구" 개념을 기반으로 한 강력한 시장 분석 방법을 제공합니다. 이 도구를 활용하여 트레이더는 차트의 회귀 채널을 탁월하게 제어하고 보다 근거 있는 거래 결정을 할 수 있습니다. 회귀 채널 도구는 트레이더 도구 상자 내에서 강력한 도구입니다. 가격 트렌드와 잠재적인 지지 및 저항 수준에 대한 유용한 통찰력을 제공하는 것을 목표로합니다. 이 도구는 특히 트렌드 내의 수정 웨이브를 시각화하는 데 효과적이며 가격 역학의 포괄적인 전망을 제공합니다. 이제 이 인디케이터의 주요 기능과 이점에 대해 더 자세히 살펴보겠습니다: 채널 수준 및 지지/저항: 이 인디케이터의 주요 장점 중 하나는 동적인 지지 및 저항 영역으로 작동하는 채널 수준을 생성할 수 있는 능력입니다. 이러한 수준은 잠재적인 진입 및 이탈 포인트를 식별하는 데 중요하며 거래 전략의 정밀도를 향상시킵니다. 수정 웨이브 수준: 수정 웨이브 수준을 활성화하여 트레이더는 큰 트렌드 내에서 잠재적인 수정을
"우리는 트레이딩 전략을 향상시키고 시장 트렌드에 대한 정확한 통찰력을 제공하기 위해 개발된 강력한 외환 인디케이터를 소개합니다. 이 혁신적인 도구는 세밀한 촛대 측정을 분석하고 최적의 정확도를 얻기 위해 조정을 수행하는 정교한 사용자 정의 알고리즘을 사용합니다. 결과는 차트에 정밀하게 배치된 화살표 세트로 전략적인 진입 지점을 표시합니다. 이 인디케이터의 창의력은 촛대 패턴의 힘을 활용하고 정밀하게 교정된 조정과 결합하는 능력에 있습니다. 이를 통해 시장 움직임에 대한 독특한 시각을 제공하며 거래 결정에 우위를 제공합니다. 이 인디케이터의 특출한 특징 중 하나는 H1 시간 프레임에서의 뛰어난 성능입니다. 이 시간 프레임에 특화된 트레이더들은 많은 정밀한 진입 기회를 제공한다는 것을 발견할 것입니다. 그러나 우리는 시너지의 힘을 믿습니다. 이 인디케이터 자체로도 강력한 도구이지만, 보다 포괄적인 트레이딩 전략에 통합될 때 그 성능은 더욱 높아집니다. 기존의 접근 방식과 결합함으로써
"이 인디케이터는 바이스트라 패턴 이론을 기반으로 한 입장을 감지하고 목표 및 중지 레벨을 갖춘 한정 주문을 놓을 수 있는 입장 가치를 제공합니다. 이를 통해 리스크 비율을 계산할 수 있습니다. 참고: 이 인디케이터에는 EA에서 사용할 수 있는 버퍼가 있습니다. 이 제품을 사용하는 동안 좋은 자금 관리를 실천하는 것이 중요합니다. 시간 프레임을 변경할 때, 인디케이터는 마지막 세션에서 사용한 템플릿을 저장합니다. 이 방법을 배우려면 구매 후 저희에게 연락하고 리뷰를 추가해주시기 바랍니다. 매개변수: 시스템 비주얼 사용 - 이 제품의 비주얼 테마를 활성화/비활성화합니다. 속도 관련 - 마지막 웨이브의 빠른 움직임 중에만 패턴을 감지하도록 활성화/비활성화합니다. 마지막 양식 카운터 표시 - 양식 타이머를 활성화/비활성화합니다. 양식 카운터 색상 - 양식 타이머 텍스트의 색상입니다. 상승 패턴 색상 - 상승 패턴의 색상입니다. 하락 패턴 색상 - 하락 패턴의 색상입니다. 알림 보내기 -
"Fibo Star" 지표는 별 모양으로 피보나치 팬을 차트에 표시하는 데 사용됩니다. 이 피보나치 팬은 가격 움직임을 분석하는 강력한 도구로, 잠재적인 지지 및 저항 레벨에 대한 통찰력을 제공할 수 있습니다. 이 지표는 그리기 및 설정 과정을 간편화하기 위한 사용자 친화적인 제어판을 제공하여 시간과 노력을 절약할 수 있도록 돕습니다. 사용 방법: 이 지표는 수동 사용을 위한 것입니다. 효과적으로 사용하려면 다음 단계를 따르세요: 피보나치 팬을 기반으로 할 고점과 저점을 차트에서 식별합니다. 이러한 고점과 저점에 보라색 선을 그립니다. 가격이 이러한 선과 상호 작용하면, 이 지표가 동적인 지지 및 저항 레벨로 작동하는 것을 관찰하세요. 매개변수: Use_System_Theme: 이 매개변수를 사용하여 지표의 외관을 거래 플랫폼의 전반적인 테마에 맞출지 또는 사용자 정의할지 선택할 수 있습니다. Levels_Color: 피보나치 팬의 레벨에 적용할 색상을 선택합니다. Levels_S
"통화 강도 인디케이터"는 외환 시장에서 서로 다른 통화의 상대적인 강도에 관한 정보를 제공하기 위해 개발된 강력한 도구입니다. 각 통화의 강도를 해당 시간 프레임을 기반으로 계산하고 표시함으로써 이 인디케이터는 특히 유의미한 발산이나 교차가 관찰될 때 잠재적인 거래 기회를 식별하는 기회를 제공합니다. 인디케이터의 주요 특징: 1. 통화 강도 계산: 이 인디케이터는 각 통화의 강도를 해당 시간 프레임을 기반으로 계산합니다. 이 계산에는 지정된 기간 동안 한 통화가 다른 통화들의 바구니에 대한 성과를 평가하는 과정이 포함됩니다. 이를 통해 트레이더는 각 통화의 상대적인 강도 또는 약함을 이해할 수 있습니다. 2. 수축과 발산: 두 통화의 강도 간에 수축 또는 발산 움직임이 있는 경우, 이는 잠재적인 거래 기회를 나타낼 수 있습니다. 예를 들어 한 통화가 상대적으로 강화되는 동안 다른 통화가 약화되는 경우, 가능한 진입 지점을 나타낼 수 있습니다. 3. 제로 레벨 교차: 이 인디케이터는
강력한 가격 행동 패턴을 감지하는 기술적 지표: 핀바, 인사이드 바, 아웃사이드 바 소개: 기술적 분석 분야에서 가격 행동 패턴은 잠재적인 시장 움직임의 중요한 지표로 기능합니다. 우리는 차트상의 견고한 가격 행동 패턴을 식별하는 데 도움을 주는 정교한 기술적 지표를 개발했습니다. 우리의 지표는 핀바, 인사이드 바, 아웃사이드 바라는 세 가지 중요한 패턴을 감지하는 데 특화되어 있습니다. 주요 감지 패턴: 핀바: 핀바 패턴은 시장 트렌드의 잠재적인 반전을 나타내는 단일 양초 형성입니다. 작은 몸체와 몸체 위나 아래로 튀어나온 긴 꼬리 또는 "위크"로 특징지어집니다. 상승 핀바는 가능한 상승 반전을 시사하며, 하락 핀바는 하락 반전을 시사합니다. 인사이드 바: 인사이드 바 패턴은 단일 양초의 전체 가격 범위가 이전 양초의 가격 범위 내에 들어가는 경우 발생합니다. 이 패턴은 임시적인 증시 합리화나 불확실성을 나타내며 종종 양방향으로의 돌파를 앞서는 신호로 작용합니다. 아웃사이드 바:
Unlock Hidden Insights with the Numerokh Indicator: Your Numerology-Based Support and Resistance Tool Introducing the Numerokh indicator, a revolutionary tool that brings the mystical world of numerology into the realm of trading. Imagine having the power to identify key support and resistance levels on your charts using the age-old wisdom of numerology. This indicator takes trading to a new dimension, offering you a unique way to analyze price movements and make informed trading decisions. Key
Shepherd Numerology Levels 인디케이터를 활용하여 혁신적인 거래 방식을 탐색해보세요. 이 혁신적인 도구는 고대의 숫자학 지식을 현대적인 거래 기술과 결합하여 차트에서 중요한 지지와 저항 수준을 식별할 수 있도록 돕습니다. 9의 제곱법(Square of Nine)을 사용하여 이 인디케이터는 시장 역학에 대한 독특한 관점을 제공하며 더욱 정보를 풍부하게 제공하여 거래 결정을 내리게 합니다. 주요 기능 및 이점: 숫자학과 9의 제곱법: Shepherd Numerology Levels 인디케이터는 9의 제곱법을 활용하여 가격 움직임의 숨겨진 패턴을 해석합니다. 이 방법은 시장에서 가능한 추세 반전 지점과 역전을 예측하는 데 정확성이 높다고 알려져 있습니다. 정확한 지지와 저항 수준: Shepherd Numerology Levels를 사용하면 전통적인 분석을 통해 명확하지 않을 수 있는 정확한 지지와 저항 수준을 식별할 수 있습니다. 이러한 수준은 숫자학의 원리에서 유래되
ON Trade Numerology Mirror 인디케이터 소개: 숫자학을 통한 숨겨진 반전 패턴 해석 ON Trade Numerology Mirror 인디케이터로 기술적 분석의 새로운 차원을 체험하세요. 이 혁신적인 도구는 고대 숫자학의 지식을 활용하여 차트에서 중요한 가격 반전 수준을 식별합니다. 숫자를 반전된 위치로 재배치하여 이 인디케이터는 숫자의 상징적 의미를 활용하여 가능한 가격 반전을 예측하는 능력을 제공하며 거래 결정에 독특한 이점을 제공합니다. 주요 기능과 장점: 숫자학 활용: ON Trade Numerology Mirror 인디케이터는 신비로운 숫자학의 힘을 결합하여 숨겨진 가격 반전 패턴을 해석합니다. 숫자를 반전된 위치로 재배치함으로써 숫자의 상징적 의미를 활용하여 가능한 가격 반전을 예측합니다. 반전된 숫자 패턴: 이 인디케이터는 숫자열의 반전 개념을 적용하여 차트에 가격 반전 수준을 그립니다. 이러한 수준은 반전된 숫자 패턴에서 유래되며 시장 역학에 대한 독
Maravilla Square 지표 소개: 예측 거래를 위한 도우미 Maravilla Square 지표를 소개합니다. 이 독특한 도구는 가격 반전에 대한 통찰력을 제공하며, 고점과 저점 사이에서 조정할 수 있는 트렌드 라인을 제공합니다. 트렌드 라인의 역학: Maravilla Square 지표는 고점과 저점에 맞게 조정할 수 있는 트렌드 라인을 소개합니다. 이 동적인 기능은 지표와 가격 움직임 사이에 직접적인 연결을 만들어 거래 정확도를 향상시킵니다. 두 개의 컬러 라인: 두 개의 컬러 라인이 수축되는 것을 주목하세요. 이는 잠재적인 가격 반전의 독특한 신호입니다. 이 라인들이 수렴되면 독특한 패턴이 나타나며, 지표가 시장 반전 지점을 예측할 수 있게 됩니다. 정확성이 중요합니다: Maravilla Square 지표를 1 대 1의 고정된 종횡비로 사용하여 정확한 예측을 수행하세요. 이렇게 하면 정확한 결과를 얻을 수 있으며 거래 결정을 지원합니다. Maravilla Square 패턴
Introducing the ON Trade Melad Pattern Indicator: Enhance Your Trading Strategy with Breakout Patterns Discover the power of the ON Trade Melad Pattern Indicator—an intuitive tool designed to elevate your trading decisions by detecting and highlighting breakout patterns on your charts. This indicator is your key to identifying crucial breakout points and potential trend shifts with simplicity and precision. Key Features: Breakout Pattern Detection: The ON Trade Melad Pattern Indicator foc
This indicator will give you entries as result of scalping strategy that will be applied on 14 symbols in same time and you are able to be notified with this entries  Note :   This indicator for scalping on 5 minutes timeframe only . How to use it : 1-Open chart and adjust settings (edit symbols names as your platform names , activate the alert system if you need it . 2-Wait for any signal you have it from this scanner you will have it as alert and as notification and you will see it on bo
This indicator gives you the signal of real cross on stochastic indicator. This indicator is easy to attach to an ea. This indicator will work best on All time frames. Arrow appears depending on many algorithms that study the cross parameters. Indicator properties Use_System_Visuals: enable/disable visual styles. Stochastic_K_Period. Stochastic_D_Period. Stochastic_Slowing. Use_Notifications: enable/disable Push Notifications. Use_Alert: enable/disable Alerts. Use_E_Mail: enable/disable Email
ON Trade Volaty
Abdullah Alrai
ON Trade Volaty 소개: 수익성 있는 변동성 돌파 솔루션 ON Trade Volaty 지표로 거래 기회를 발견하세요. 고급 변동성 분석을 활용하여 돌파 지역을 식별하며, 전략적인 진입 및 목표 지점을 활용하여 정확한 거래를 이끌어내세요. 거래 스타일에 맞게 조정된 전략적인 진입 및 목표 지점을 활용하여 가격 움직임을 포착하세요. 주요 특징: 고급 변동성 분석 전략적인 진입 지점 동적인 목표 설정 맞춤 가능한 매개 변수 전문가 어드바이저 (EA)와 호환 사용 방법: ON Trade Volaty 지표를 설치하세요. 차트에서 강조된 돌파 지역을 확인하세요. 돌파 지역에서 전략적으로 거래하세요. 동적인 목표를 활용하여 최적화된 이익을 실현하세요. 스톱 로스와 테이크 프로핏 수준을 활용하여 리스크 관리를 실행하세요. 결론: ON Trade Volaty는 정확한 돌파 지역을 지적함으로써 거래 포텐셜을 극대화합니다. 이 강력한 도구로 거래 전략과 리스크 관리를 향상시키세요. [주의:
ON Trade VSA
Abdullah Alrai
"ON Trade VSA"를 소개합니다 - 볼륨 및 분포 분석을 위한 궁극적인 도구! 우리의 고급 인디케이터 "ON Trade VSA"를 사용하여 볼륨 스프레드 분석(VSA)의 힘을 발휘해 보세요. VSA는 시장 강도를 평가하고 추세를 식별하며 정보에 근거한 결정을 내리는 트레이더에 의해 사용되는 강력한 방법론입니다. "ON Trade VSA"가 여러분의 트레이딩 아카이브에서 빠질 수 없는 도구가 되는 주요 기능을 살펴보겠습니다: 다색 볼륨 캔들 : 평균 움직임을 기반으로 서로 다른 색상을 볼륨 캔들에 할당하는 독특한 기능을 통해 시장 역학을 파악할 수 있습니다. 이 직관적인 시각화는 시장 감정 변화를 빠르게 파악하는 데 도움을 줍니다. 강력한 트렌드 감지 : 저희의 인디케이터는 기본적인 것을 넘어서 있습니다. 그래프 상에서 가장 강력한 트렌드를 정확하게 식별하고 표시하여 주류 시장 방향을 명확히 볼 수 있게 해줍니다. 볼륨-레인지 곱셈기 : 범위에 볼륨을 곱하는 능력을 사용하여 숨
필터:
Suleiman Alhawamdah
1018
Suleiman Alhawamdah 2023.06.04 18:49 
 

Thanks for the new update

trinh tien
49
trinh tien 2023.03.08 15:29 
 

This is best indicator that i ever bought.It worked well in forex and stock. The author is very kind.He is willing to support customer. I appriciate him. However should add scanner function . it will convinient . we will take less time to search the harmonic patter. Thank you for hard-working.

Abdullah Alrai
42098
개발자의 답변 Abdullah Alrai 2023.03.08 15:31
Tahank you mr
David Gakuya Kariuki
137
David Gakuya Kariuki 2023.03.01 16:23 
 

Two things I love about Shepherd Hamonic Indicator: 1:It works well combining Markets action, Harmonics, and Elliott Wave. 2: The developer, Mr. Abdullah Alrai is approachable. I have invested in the indicator. I suggest, to your life-term benefit that you also do.

Abdullah Alrai
42098
개발자의 답변 Abdullah Alrai 2023.03.01 16:25
Thanks mr david
elite luis
3331
elite luis 2023.02.25 09:05 
 

1 word is Profitable! Best Buy for 2023! and Author provide very good support, excellent!

Abdullah Alrai
42098
개발자의 답변 Abdullah Alrai 2023.02.25 09:31
Thank you mr dan
alattar
164
alattar 2023.01.17 16:17 
 

افضل موشر هارمونك ممكن تستخدمه

Abdullah Alrai
42098
개발자의 답변 Abdullah Alrai 2023.01.17 16:27
Thank you sir
Ibrahim Patel
225
Ibrahim Patel 2022.11.10 04:11 
 

hi, i messaged regarding instructions as i need them to use the software, i havnt used yet, but i have the paid version so if you can provide instructions on how to use the product that would be much appreciated wassalam

nabeel09
36
nabeel09 2022.08.30 03:18 
 

Its good but very slow

Simon Akubue
3317
Simon Akubue 2022.08.15 17:51 
 

This look good and awesome to use as trading tool.

Corneliu Raileanu
222
Corneliu Raileanu 2022.07.05 22:16 
 

I used the demo product for a number of months and I was satisfied with the product, even if it was lagging. But the paid version is great, it works faster and the panel makes it awesome. A big thanks to Abdullah for technical support. :)

Abdullah Alrai
42098
개발자의 답변 Abdullah Alrai 2022.07.05 22:17
Thank for your kind words you are most welcome
Malek Ammar Mohammad Alahmer
249
Malek Ammar Mohammad Alahmer 2022.06.27 04:04 
 

The indicator was amazing and helpful ,I use it with supply and demand strategy it increase my winning ratio ,the seller abdullah is kind and helpful as well ,he is well cooperative with answering questions, big thanks to abdullah

Abdullah Alrai
42098
개발자의 답변 Abdullah Alrai 2022.06.27 07:42
Thank you mr makek
Hugoberg888
112
Hugoberg888 2022.06.24 22:56 
 

Great interface, love the fact that all 3 indicators (Harmonics, Elliot and Wolfe Waves) can be added on the same chart.

Abdullah Alrai
42098
개발자의 답변 Abdullah Alrai 2022.06.24 22:57
Thank you sir we appreciate that
mikebills
41
mikebills 2022.06.17 23:55 
 

The author of this indicator is really caring and very responsive. Thanks bro for the good work

Abdullah Alrai
42098
개발자의 답변 Abdullah Alrai 2022.06.24 22:57
Thank you sir
ENOCK AKUWURE
128
ENOCK AKUWURE 2022.05.06 13:17 
 

Hi abdullah, I just bought the indicator.. What setting should I use for higher accuracy ?

Abdullah Alrai
42098
개발자의 답변 Abdullah Alrai 2022.05.06 14:23
Welcome sir Best settings is the default that what i am using in my personal work and if you want to change that relate to your trading type
Samuel Diseko
254
Samuel Diseko 2022.04.26 18:33 
 

Hi Abdullah Thank you for a quality product and I am also happy with the performance. Keep up the good work. 👍

Abdullah Alrai
42098
개발자의 답변 Abdullah Alrai 2022.04.26 18:39
Thank you sir for your kind words
Kevin Lemire
192
Kevin Lemire 2022.04.03 22:56 
 

Thanks Abdullah for this very nice update, can't wait to start using it. EA mode will certainly help a lot.

Abdullah Alrai
42098
개발자의 답변 Abdullah Alrai 2022.04.03 22:58
Welcome sir ..
And thanks for this kind words if you needed any help please contact us on telegram at
@forex_manager
Devonish
2992
Devonish 2022.03.29 17:28 
 

Another quality product.

MS-corp consulting
23
MS-corp consulting 2022.03.02 19:19 
 

Very very good indicator , the best I had for now. Interface very accurate and simple to understand.

Abdullah Alrai
42098
개발자의 답변 Abdullah Alrai 2022.03.02 19:25
Thank you sir for your trust
hungnq1992
1190
hungnq1992 2022.02.24 10:31 
 

I will learn how to use this indicator for better trading results

JEFE005
42
JEFE005 2022.01.22 21:06 
 

HI, its very good, ut i have a question; what function does the ray have? it does not appear in any graph.

Abdullah Alrai
42098
개발자의 답변 Abdullah Alrai 2022.01.22 21:26
Thanks sir for your kind words...
Ray activated after tick happen or after you make refresh.. it will extend ray of basic pattern trend
Corrado Bruni
379
Corrado Bruni 2022.01.19 13:59 
 

Accurate indicator. Optimize trading. The author is available and prepared.

Abdullah Alrai
42098
개발자의 답변 Abdullah Alrai 2022.01.19 23:30
Thanks mr bruni
리뷰 답변
버전 9.7 2024.07.26
- Improvements
버전 9.6 2023.06.04
- Add font size control
- Panel save adjustment
버전 9.5 2022.03.31
- New Panel
- Add Elliot Waves
- Add Wolfe Waves
- Add EA_MODE in settings for who use it in EA.
- Add buffer definitions for buffer 10 elliot >20 / wolfe >21
버전 9.4 2021.03.20
- Added Buffer 10 To Identify Pattern name By Value As Next :
//Gartley=1
//Bat=2
//Butterfly=3
//Crab=4
//Cypher=5
//Shark=6
//Gartley_Anti=7
//Bat_Anti=8
//Crab_Anti=9
//Butterfly_Anti=10
//Cypher_Anti=11
//Shark_Anti=12
//White_Swan=13
//Black_Swan=14
//NenStar=15
//Deep_Crab=16
//Dragon=17
//5_O=18
//ABCD=19
버전 9.3 2020.05.29
- Improving for Code .
- Add TP3 Buffer
- Improved Saved Data
버전 9.2 2018.08.18
- Improve Pattern detecting.
버전 9.1 2018.08.16
-Bug Fix in Pattern Detiction
버전 9.0 2018.07.02
1. Code rewritten and it is so faster now.
2. Added buffers to use within EAs.
3. Added Control Panel.
4. Added Indicator Template to save its settings automatically in it.
5. Added Predicted And Manual Patterns Functions.
6. Add Pivots and Camarilla Lines.
7. Added Alarm for price and time lines.
8. Improved Alert and Alarms Functions.
9. Add money management system to calculate every pattern risk size.
버전 8.9 2017.05.11
*Bug Fix change time frame error.
버전 8.8 2017.04.28

1 - Add new pattern 123 drives.
2 - Improve alert system
3 - Improve patterns drawing.
4 - Targets will appear only when pattern complete.
5 - Bug fixes.
버전 8.7 2016.07.14
* Bug Fix error.
버전 8.6 2016.07.06
1. update panel now it will show you more info .
2. improved money management system that will be shown on panel .
3. added divergence on RSI arrows with panel notify.(Because of many harmonic traders using it).
4. added last detected pattern notify on panel .
5. more accuracy to view patterns.
6. Edited potential reversal zone areas (prz) and added entry zone this is the strongest one and from it price is hard to reverse.