MTF Stochastic RSI
- 지표
- Leonid Basis
- 버전: 5.4
- 업데이트됨: 25 4월 2020
- 활성화: 5
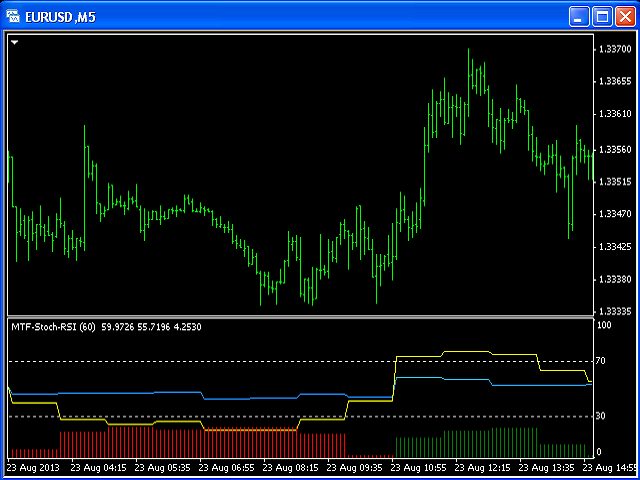
This is a Multi-Time indicator which allows to display RSI and Stochastic indicators from upper timeframes on a single chart.
As an example: a single chart EURUSD M5 and RSI (blue line) and Stochastic (yellow line) from H1.
Red Histogram is representing Lower trend and Green Histogram is representing Upper trend.