• 미리보기
  • 리뷰
  • 코멘트

Reversal Trend Indicator

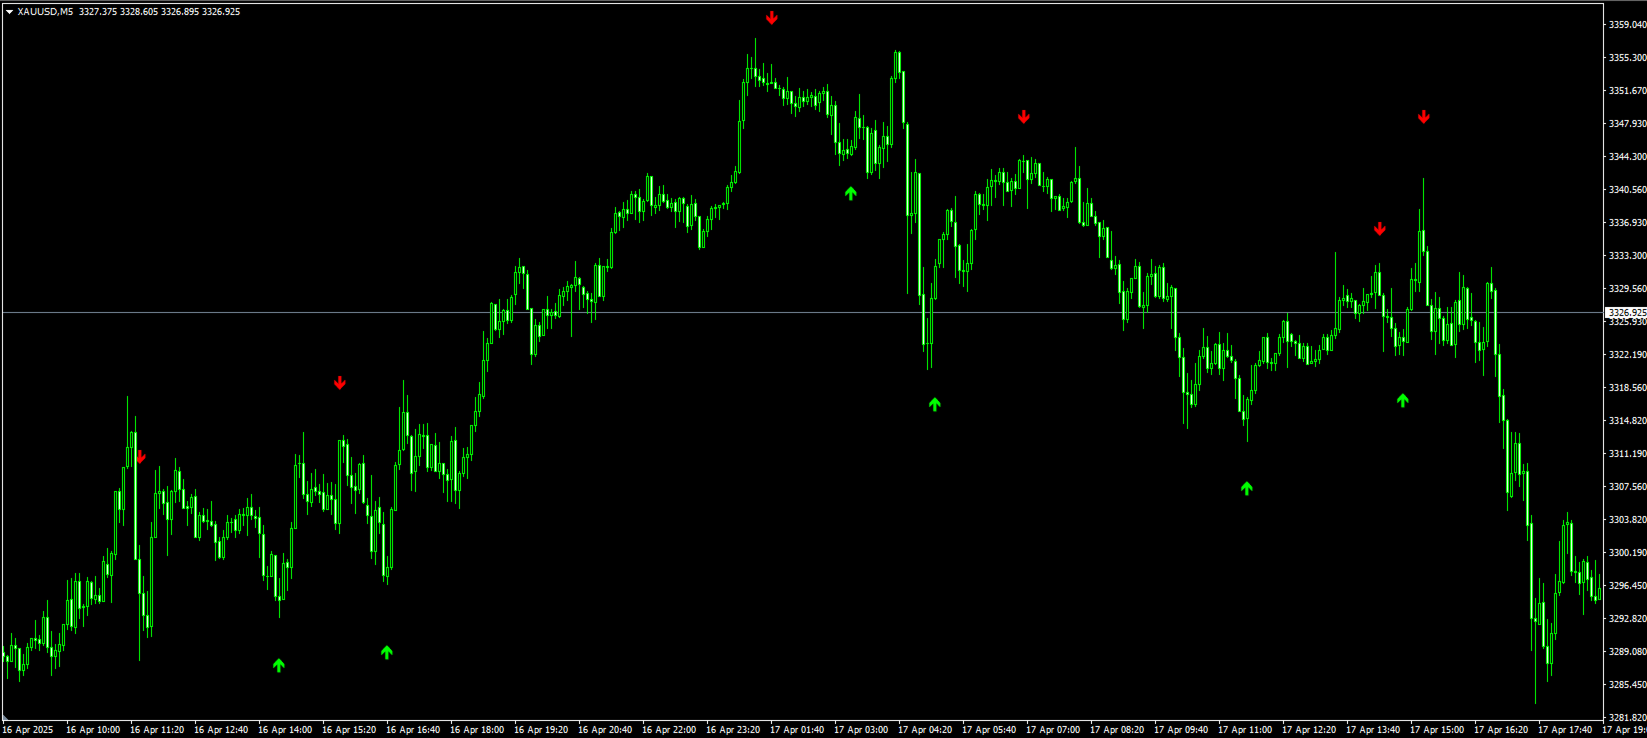
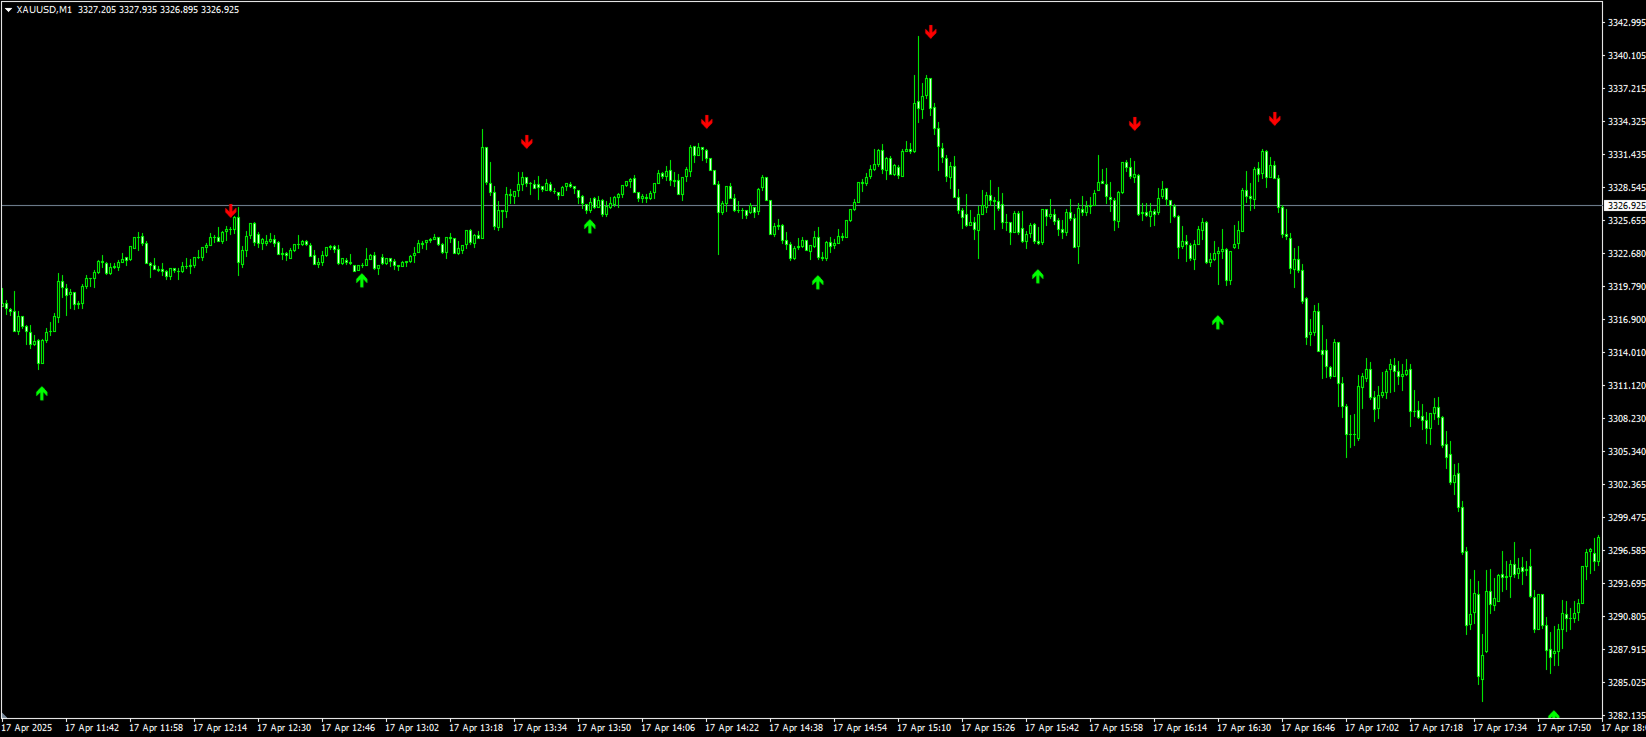
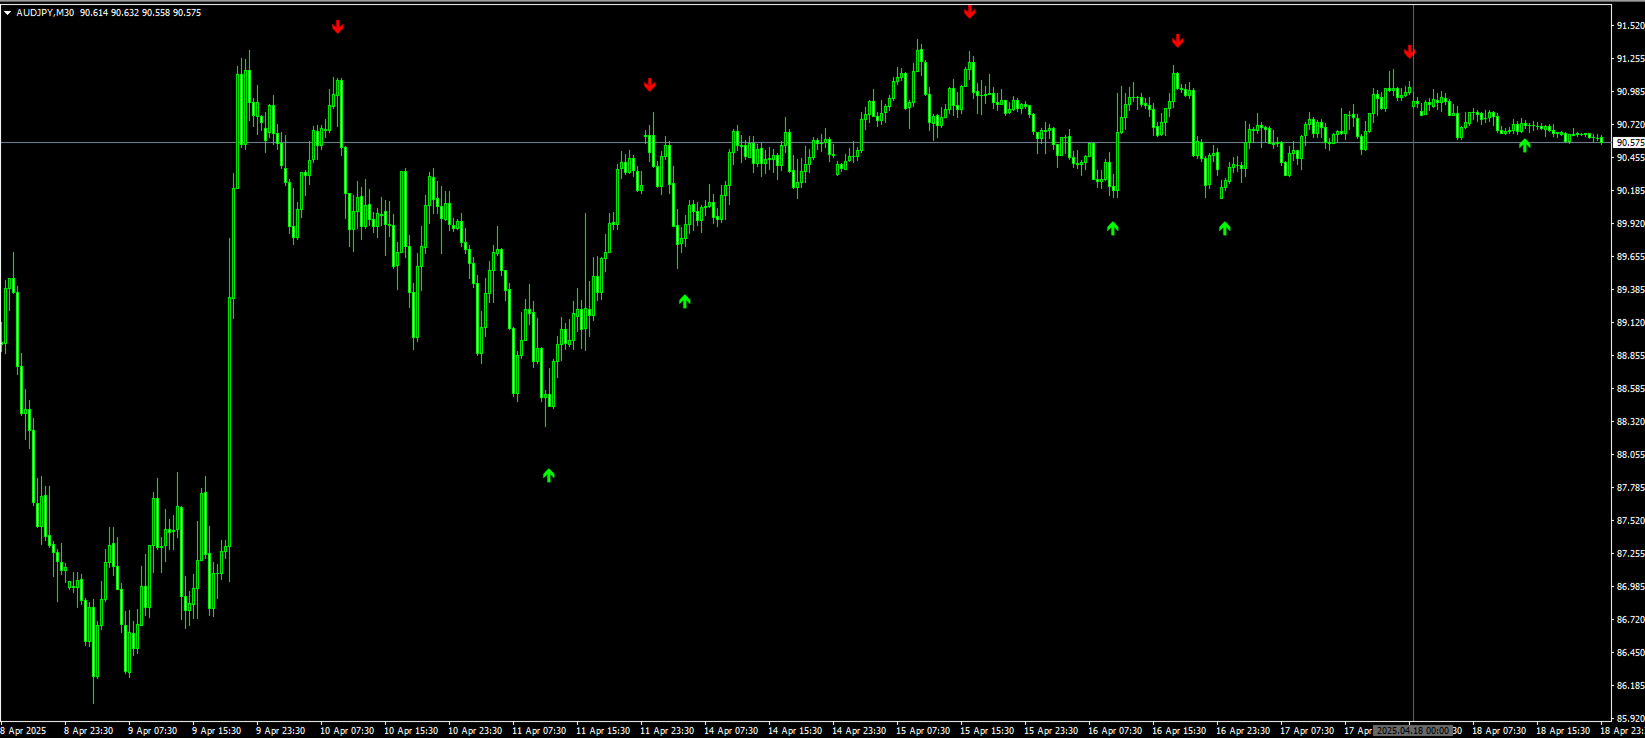
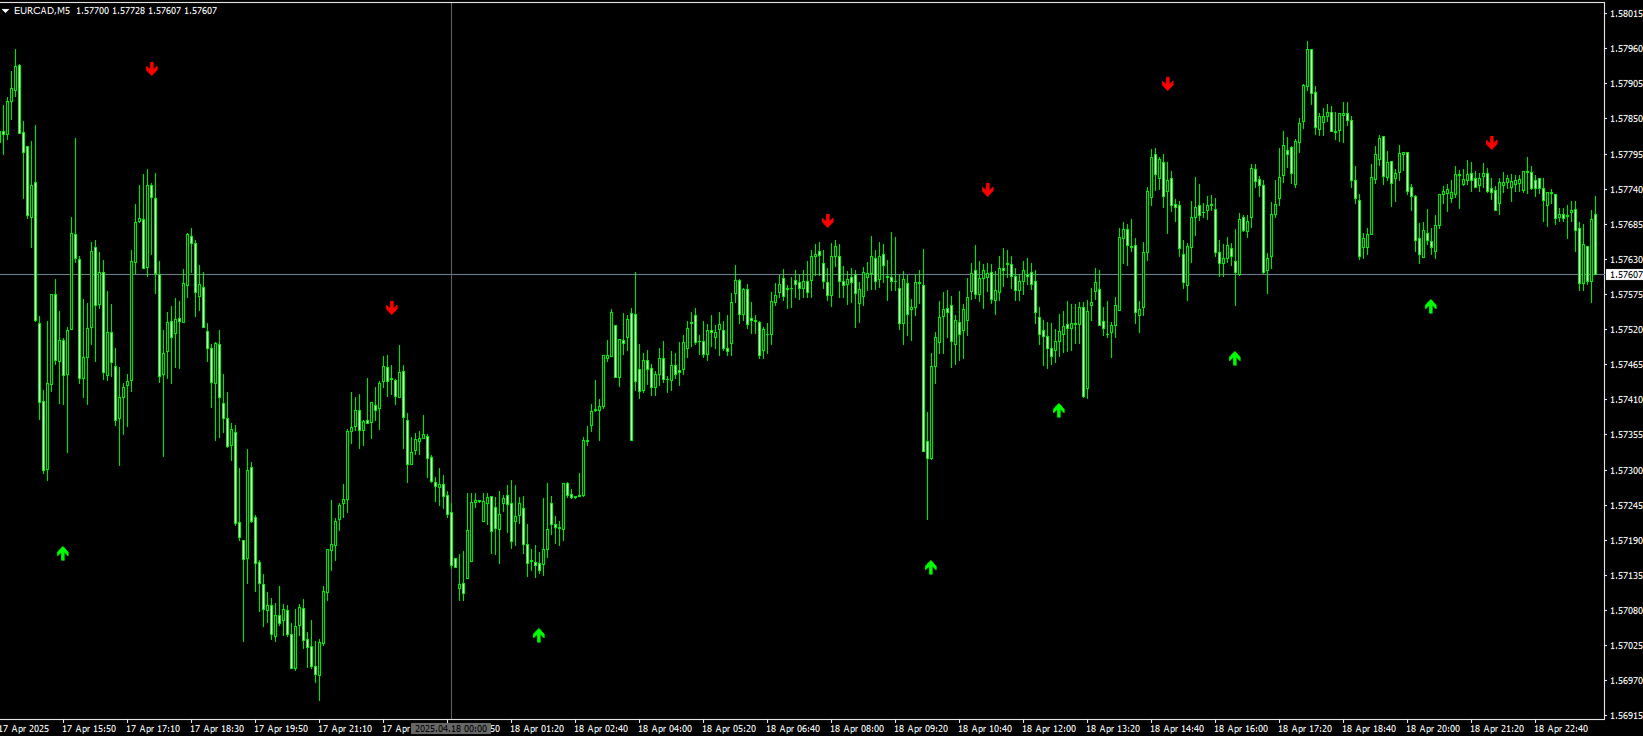
MetaTrader 4용 트렌드 리버설 인디케이터는 정적인 패턴이나 구식 규칙에 의존하지 않고 시장 전환점을 극도로 정확하게 식별하도록 설계된 차세대 전문가용 도구입니다. 정교한 알고리즘은 변동성과 유동성 변화에 동적으로 적응하여 금융 시장의 실제 움직임과 완벽히 일치하는 신뢰할 수 있는 신호를 제공합니다.

기존 예측 도구와 달리, 트렌드 리버설 인디케이터는 실시간으로 시장 상황에 맞춰 조정됩니다. 횡보장과 강한 추세장 모두에서 뛰어난 신뢰성을 보여주며, 오류 신호를 크게 줄여줍니다.

주요 특징:

  • 재표시 없음 - 안정적인 신호

  • 모든 시간대와 상품에 적용 가능

  • 스캘핑부터 스윙 트레이딩까지

  • 실시간 변동성 분석

적용 분야:

  • 시장 전환점 예측

  • 고변동성 시장에서의 안정적 운영

  • 숨겨진 다이버전스 패턴 식별

과학적인 접근 방식으로 시장을 분석하고 실시간으로 적응하는 이 도구는 어떤 시장 상황에서도 확신을 가지고 거래할 수 있도록 도와줍니다.

각 번역은 원문의 전문적인 뉘앙스와 기술적 정확성을 유지하면서도 해당 언어의 자연스러운 표현 방식을 따르도록 작성되었습니다. 특정 용어나 표현을 조정해야 할 부분이 있으면 알려주세요. 모든 버전은 일관된 메시지 전달을 위해 핵심 기능과 이점을 동일하게 강조하고 있습니다.


추천 제품
ZO Trend
Trung Le Hoang
4 (4)
Important!! ZO Trend can't work on MN timeframe. /*--------------------------------------------------------------------------------------------------------------------------------------------------------------------------------------------- ZO Trend an indicator used to search for entry point. With the session candle algorithm on many timeframe, ZO Trend creates an area for traders find good Entry Point. ZO SYSTEM BASIC SETUP :  https://www.youtube.com/watch?v=qdNOXHWozNw ZO TREND User guide : 
Before
Nadiya Mirosh
The Before indicator predicts the most likely short-term price movement based on complex mathematical calculations. Most of the standard indicators commonly used in trading strategies are based on fairly simple calculations. This does not mean that there were no outstanding mathematicians in the world at the time of their creation. It is just that computers did not yet exist in those days, or their power was not enough for the sequential implementation of complex mathematical operations. Nowad
PZ 123 Pattern
PZ TRADING SLU
1 (1)
Unlock powerful breakout opportunities The 123 Pattern is one of the most popular, powerful and flexible chart patterns. The pattern is made up of three price points: a bottom, a peak or valley, and a Fibonacci retracement between 38.2% and 71.8%. A pattern is considered valid when the price breaks beyond the last peak or valley, moment at which the indicator plots an arrow, rises an alert, and the trade can be placed. [ Installation Guide | Update Guide | Troubleshooting | FAQ | All Products ]
Gold Phoenix
Yaroslav Varankin
The perfect tool for Scalng in the Forex markets You can trade both from signal to signal and using take profit  The algorithm does not use Zigzag!  No redrawing!  This is a channel instrument that uses a moving average as a filter. Moving Average  There are 2 parameters for the settings Ma Period = 5 period Moving Average  Channel 1.0 distance of channel lines from the chart Price Signal Filter - calculation of signal opening and filter There is a complete set of Alert There is a multi-timefram
Trendiness Index
Libertas LLC
5 (3)
"The trend is your friend" is one of the best known sayings in investing, because capturing large trendy price movements can be extremely profitable. However, trading with the trend is often easier said than done, because many indicators are based on price reversals not trends. These aren't very effective at identifying trendy periods, or predicting whether trends will continue. We developed the Trendiness Index to help address this problem by indicating the strength and direction of price trend
CISD FVG and IFVG ICT Indicator MT4 The CISD – CSD + FVG – IFVG indicator is an advanced ICT-based tool designed to identify CISD levels using Fair Value Gap (FVG) and Inverse Fair Value Gap (IFVG) . Built for MetaTrader 4 , this liquidity indicator dynamically maps CISD zones with directional arrow signals. These Change in Delivery Price (CISD) levels help traders understand market shifts and trend developments in real time.   CISD – CSD + FVG – IFVG Indicator Specifications Below is a summary
FREE
Chart Patterns Detect 15 patterns (Ascending Triangle, Descending Triangle, Rising Wedge, Falling Wedge, Bullish Flag, Bearish Flag, Bullish Rectangle, Bearish Rectangle Symmetrical triangle, Head and Shoulders, Inverted Head and Shoulders, Triple top, Triple Bottom, Double Top, Double Bottom) Use historical data to calculate the probability of each pattern to succeed (possibility to filter notification according to the chance of success) gives graphic indication about the invalidation level and
This indicator uses support and resistance, volume and some special formula to calculate the volume to filter the candles. If the volume reaches a specific value, And at the same time, Candle breaks the support/resistance line, There would be a signal and we can enter the market. Signals appear when the current candle closes. then you can enter the trade when a new candle appears. Please don't forget to follow your money management plan. MT5 Version Support/Resistance Breakout MT5 :   https://
Owl smart levels
Sergey Ermolov
4.24 (37)
MT5 버전  |   FAQ Owl Smart Levels Indicator 는   Bill Williams 의 고급 프랙탈, 시장의 올바른 파동 구조를 구축하는 Valable ZigZag, 정확한 진입 수준을 표시하는 피보나치 수준과 같은 인기 있는 시장 분석 도구를 포함하는 하나의 지표 내에서 완전한 거래 시스템입니다. 시장과 이익을 취하는 장소로. 전략에 대한 자세한 설명 표시기 작업에 대한 지침 고문-거래 올빼미 도우미의 조수 개인 사용자 채팅 ->구입 후 나에게 쓰기,나는 개인 채팅에 당신을 추가하고 거기에 모든 보너스를 다운로드 할 수 있습니다 힘은 단순함에 있습니다! Owl Smart Levels   거래 시스템은 사용하기 매우 쉽기 때문에 전문가와 이제 막 시장을 연구하고 스스로 거래 전략을 선택하기 시작한 사람들 모두에게 적합합니다. 전략 및 지표에는 눈에 보이지 않는 비밀 공식 및 계산 방법이 없으며 모든 전략 지표는 공개되어 있습니다. Owl Smart Leve
For this set of indicators 1. General information     - Calculates with high performance mathematical algorithms.     - Calculated from the price of candles     - The entry point of this order is filtered by the train EMA and the oscillator.     - Calculate the integrity of the candle 2. How does it work?     - You can see two types of order entry points: the notification on the monitor and the arrow.     - You can trust 75-95 percent of this entry point. 3. Settings     - A complete candle i
Crypto_Forex 지표 "Morning Star pattern" for MT4. - 지표 "Morning Star pattern"은 가격 액션 거래에 매우 강력한 지표입니다. 다시 칠할 필요 없고 지연도 없습니다. - 지표는 차트에서 강세 Morning Star 패턴을 감지합니다. 차트에 파란색 화살표 신호가 있습니다(그림 참조). - PC, 모바일 및 이메일 알림이 있습니다. - 또한 형제인 약세 "Evening Star pattern" 지표도 사용할 수 있습니다(아래 링크를 따라가세요). - 지표 "Morning Star pattern"은 지지/저항 수준과 결합하기에 매우 좋습니다. // 훌륭한 거래 로봇과 지표는 여기에서 사용할 수 있습니다: https://www.mql5.com/en/users/def1380/seller 이것은 이 MQL5 웹사이트에서만 제공되는 오리지널 제품입니다.
ProTrading Arrow
Nedyalka Zhelyazkova
5 (1)
" A NEW TRADING METHOD… AN AMAZING TRADING INDICATOR! " Additional Bonus : You get the Forex Trend Commander indicator for FREE! It should not be forgotten that trading is not an event, but a process. This process has no end, i.e. it should never stop completely and completely. To lock in a profit from market movements you need to implement the strategy in practice, in most cases it takes much longer than planning it. ProTrading Arrow indicator is an advanced reversal system that can be played
Alpha Trend sign has been a very popular trading tool in our company for a long time. It can verify our trading system and clearly indicate trading signals, and the signals will not drift. Main functions: Based on the market display of active areas, indicators can be used to intuitively determine whether the current market trend belongs to a trend market or a volatile market. And enter the market according to the indicator arrows, with green arrows indicating buy and red arrows indicating se
Infinity Trend Pro
Yaroslav Varankin
1 (1)
This is a trend indicator without redrawing Developed instead of the binary options strategy (by the color of the Martingale candlestick) Also works well in forex trading When to open trades (binary options) A signal will appear in the place with a candle signaling the current candle It is recommended to open a deal for one candle of the current timeframe M1 and M5 When a blue dot appears, open a deal up When a red dot appears, open a trade down. How to open trades on Forex. When a signal is rec
VR Cub
Vladimir Pastushak
VR Cub 은 고품질 진입점을 얻는 지표입니다. 이 지표는 수학적 계산을 용이하게 하고 포지션 진입점 검색을 단순화하기 위해 개발되었습니다. 지표가 작성된 거래 전략은 수년 동안 그 효율성을 입증해 왔습니다. 거래 전략의 단순성은 초보 거래자라도 성공적으로 거래할 수 있다는 큰 장점입니다. VR Cub은 포지션 개시 지점과 이익 실현 및 손절매 목표 수준을 계산하여 효율성과 사용 편의성을 크게 높입니다. 간단한 거래 규칙을 이해하려면 아래 전략을 사용한 거래 스크린샷을 살펴보세요. 설정, 세트 파일, 데모 버전, 지침, 문제 해결 등은 다음에서 얻을 수 있습니다. [블로그] 다음에서 리뷰를 읽거나 작성할 수 있습니다. [링크] 버전 [MetaTrader 5] 진입점 계산 규칙 포지션 개설 진입점을 계산하려면 VR Cub 도구를 마지막 최고점에서 마지막 최저점까지 늘려야 합니다. 첫 번째 지점이 두 번째 지점보다 빠른 경우, 거래자는 막대가 중간선 위에서 마감될 때까지 기다립니다
Trend PA
Mikhail Nazarenko
5 (3)
The Trend PA indicator uses   Price Action   and its own filtering algorithm to determine the trend. This approach helps to accurately determine entry points and the current trend on any timeframe. The indicator uses its own algorithm for analyzing price changes and Price Action. Which gives you the advantage of recognizing, without delay, a new nascent trend with fewer false positives. Trend filtering conditions can be selected in the settings individually for your trading style. The indicator
Trade with super Support and Resistance Breakout system. are you looking for the most sophisticated tools for your daily trading ? this tools are perfect for you, it has a most comprehensive breakout identification spot on all market (Forex, CFD, indice, etc) Limited offer :  10 copy for 30$ Indicator parameter: Depth: to arrange how deep to calculates the support and resistance zone Deviation Back-step the demonstration result you can see on the media file below.
Reback
Yazhou Liu
This index can be traced back to historical transactions, and can clearly see the trading location, trading type, profit and loss situation, as well as statistical information. Showlabel is used to display statistics. Summy_from is the start time of order statistics. This parameter is based on the opening time of the order. Backtracking can help us to correct the wrong trading habits, which is very important for beginners to learn manual transactions. This index is suitable for each time per
Distinctive
Tatiana Savkevych
Distinctive is a forex trending arrow indicator for identifying potential entry points. I like it, first of all, because it has a simple mechanism of work, adaptation to all time periods and trading tactics. Created on the basis of a regression channel with filters. Plotting the Lawrence indicator signals on a price function chart using a mathematical approach. How it works - when the price breaks out in the overbought / oversold zone (channel levels), a buy or sell signal is generated. Everyt
Renko, Heiken Ashi, Ticks Bar, Range Bar.    Easy switching, easy setup, all in one window.        Place the Custom Chart indicator and view Renko, Heiken Ashi, Tick bar, Range bar charts in real time at real chart.    Position the offline chart window so that the indicator control panel is visible.    Switch the chart mode by click of a button.    Connect to the output chart any indicator, expert advisor without any restrictions.    No, it doesn't work in the tester.    Yes, you can use an
Forex Gump Trend is a universal indicator for highly effective determination of the trend direction. If you identify the trend correctly, this is 95% of trading success, because you will be able to open trades in the direction of the price movement and benefit from it. The Forex Gump Trend indicator helps traders with a high degree of efficiency to determine the current trend direction, as well as trend reversal points. The direction of the trend is shown by colored lines on the chart, and the
Cornucopia
Wen Huang
4.67 (3)
1. 공급과 수요는 거래에서 사용하는 핵심 전략 중의 하나이다.그것은 고대의 공급과 수요의 법칙과 가격이 자유롭게 유동하는 시장에서의 추세에 주목한다.이 전략의 기초는 사용 가능한 도구의 수와 구매자의 도구에 대한 수요가 가격을 결정한다는 것이다.이는 도표에 수요가 공급 (수요구역) 을 압도하고 가격상승을 추진하는 구역 또는 공급이 수요 (공급구역) 를 압도하고 가격하락을 추진하는 구역을 표시하였다.대다수 공급과 수요의 거래자들은 다두나 공매도에 진입하기전에 가격이 이런 주요매매활동이 발생한 구역에 진입하기를 기다리고있다. 2. 수요구역에서 구매하고 공급구역에서 판매하는 것은 의미가 있지만 신선구역은 재테스트를 거친 구역보다 더 효과적이라는 것을 명심하세요.이들은 지속적인 추세의 진입 영역이나 변화 추세의 역전 영역으로 사용할 수 있다.대담하게 거래를 할 수도 있고 보수적으로 할 수도 있으며 모든 거래는 자신의 진입과 퇴출 규칙이 있다.이러한 규칙에 따라 차트 도구를 그려 사용자가
FREE
PinBar Pattern mf
DMITRII GRIDASOV
Crypto_Forex 지표 MT4용 PINBAR 패턴. - 지표 "PINBAR 패턴"은 가격 액션 거래에 매우 강력한 지표입니다. 다시 칠하거나 지연하지 않습니다. - 지표는 차트에서 PinBars를 감지합니다. - 강세 PinBar - 차트에 파란색 화살표 신호(그림 참조). - 약세 PinBar - 차트에 빨간색 화살표 신호(그림 참조). - PC, 모바일 및 이메일 알림이 있습니다. - 지표 "PINBAR 패턴"은 지원/저항 수준과 결합하기에 매우 좋습니다. // 뛰어난 트레이딩 로봇과 지표는 여기에서 확인할 수 있습니다: https://www.mql5.com/en/users/def1380/seller 이 MQL5 웹사이트에서만 제공되는 오리지널 제품입니다.
Introduction to X3 Chart Pattern Scanner X3 Cherart Pattern Scanner is the non-repainting and non-lagging indicator detecting X3 chart patterns including Harmonic pattern, Elliott Wave pattern, X3 patterns, and Japanese Candlestick patterns. Historical patterns match with signal patterns. Hence, you can readily develop the solid trading strategy in your chart. More importantly, this superb pattern scanner can detect the optimal pattern of its kind. In addition, you can switch on and off individu
Gann Price Level
Kirill Borovskii
The indicator is designed to work on any trading platform. The program is based on proprietary algorithms and W.D.Ganna's mathematics, allowing you to calculate target levels of price movement based on three points with the highest degree of certainty. It is a great tool for stock trading. The indicator has three buttons: NEW - call up a triangle for calculation. DEL - delete the selected triangle. DELS - completely remove all constructions. The probability of achieving the goals is more than 80
Trend Scanner
Vladimir Kalendzhyan
4.33 (6)
By purchasing this indicator, you have the right to receive a free copy of one of   my other indicator's or advisor’s!  (All future updates are included. No limits) . To get it , please contact me by  mql5 message ! The Trend Scanner trend line indicator displays the trend direction and its changes. The indicator works on all currency pairs and  timeframes. The indicator simultaneously displays multiple readings on the price chart: the support and resistance lines of the currency pair, the exist
Crosskalp1
Mikhail Bilan
Добрый День уважаемые трейдеры!  Вашему вниманию индикатор созданный и работающий на базе трендовика ADX,  для торговли на смене направления движения который учитывает коррекцию и даёт возможность на ней заработать.  Применяю этот индикатор для скальпинга. Рекомендую таймфреймы от 15 ти минутного(М15) до часового (Н1) периодов.  Красный кружок сигнал на продажу- Sell) Зелёный кружок  сигнал на покупку Buy) Чем меньше ваш таймфрейм тем меньше пунктов вы зарабатываете.   Важно выставлять стопы! !В
PZ Trend Trading
PZ TRADING SLU
4.8 (5)
Capture every opportunity: your go-to indicator for profitable trend trading Trend Trading is an indicator designed to profit as much as possible from trends taking place in the market, by timing pullbacks and breakouts. It finds trading opportunities by analyzing what the price is doing during established trends. [ Installation Guide | Update Guide | Troubleshooting | FAQ | All Products ] Trade financial markets with confidence and efficiency Profit from established trends without getting whip
The Th3Eng PipFinite indicator is based on a very excellent analysis of the right trend direction with perfect custom algorithms. It show the true direction and the best point to start trading. With StopLoss point and Three Take Profit points. Also it show the right pivot of the price and small points to order to replace the dynamic support and resistance channel, Which surrounds the price. And Finally it draws a very helpful Box on the left side on the chart includes (take profits and Stop loss
Line Magnit
Aleksey Trenin
The LineMagnit Indicator for MT4 is a highly precise tool that builds support and resistance levels which magnetically attract prices. This feature allows traders to easily determine the most probable entry and exit points in the market, as well as identify the market's directional forces, as levels are based on capital inflows into the instrument. Equipped with an intuitively understandable graphical interface, the LineMagnit Indicator enables users to quickly locate and analyze support and res
이 제품의 구매자들이 또한 구매함
Cycle Maestro
Stefano Frisetti
NOTE: CYCLEMAESTRO is distributed only on this website, there are no other distributors. Demo version is for reference only and is not supported. Full versione is perfectly functional and it is supported CYCLEMAESTRO , the first and only indicator of Cyclic Analysis, useful for giving signals of TRADING, BUY, SELL, STOP LOSS, ADDING. Created on the logic of Serghei Istrati and programmed by Stefano Frisetti ; CYCLEMAESTRO is not an indicator like the others, the challenge was to interpret only t
TPSpro RFI Levels
Roman Podpora
4.85 (27)
주요 플레이어의 반전 구역 / 피크 볼륨 / 활성 구역 =       TS TPS프로시스템 지침 RUS       /       지침       영어       /     Version MT5   이 지표를 구매한 모든 구매자는 또한 다음을 무료로 받습니다. RFI SIGNALS 서비스의 거래 신호에 6개월 동안 액세스할 수 있습니다. TPSproSYSTEM 알고리즘에 따른 즉시 사용 가능한 진입 포인트입니다. 정기적으로 업데이트되는 교육 자료 - 전략에 푹 빠져서 전문가 수준을 높여보세요. 주중 24/5 지원 및 비공개 트레이더 채팅 이용 - 시장 상황에 대한 소통, 지원 및 분석. 저자가 설정한 파일 - 별도의 노력 없이 최대 결과를 얻을 수 있도록 지표를 자동으로 설정합니다. 주요 기능: 판매자와 구매자의 활동 영역을 표시합니다! 이 지표는 매수 및 매도에 대한 모든 올바른 첫 번째 임펄스 레벨/존을 표시합니다. 진입점 검색이 시작되는 이러한 레벨/존이 활성화되면 레벨의 색
현재 20% 할인 ! 초보자 또는 전문가 트레이더를 위한 최고의 솔루션! 이 대시보드 소프트웨어는 28개의 통화 쌍에서 작동합니다. 2가지 주요 지표(Advanced Currency Strength 28 및 Advanced Currency Impulse)를 기반으로 합니다. 전체 Forex 시장에 대한 훌륭한 개요를 제공합니다. 고급 통화 강도 값, 통화 이동 속도 및 모든(9) 시간대의 28 Forex 쌍에 대한 신호를 보여줍니다. 추세 및/또는 스캘핑 기회를 정확히 파악하기 위해 차트의 단일 지표를 사용하여 전체 시장을 볼 수 있을 때 거래가 어떻게 개선될지 상상해 보십시오! 잠재적인 거래를 식별하고 확인하면서 강력한 통화와 약한 통화를 더욱 쉽게 식별할 수 있도록 이 지표에 기능을 내장했습니다. 이 표시기는 통화의 강세 또는 약세가 증가 또는 감소하는지 여부와 모든 시간대에서 수행되는 방식을 그래픽으로 보여줍니다. 추가된 새로운 기능은 현재 시장 조건 변화에 적응하는
StalkeR Arrow
Abdulkarim Karazon
5 (3)
StalkeR Arrow는 바 오픈/인트라 바에서 매수 및 매도 신호를 제공하는 화살표 표시기입니다. 이 표시기는 가격 행동 패턴 및 프랙탈을 기반으로 합니다. 이 지표는 각 매수 및 매도 신호에 대해 tp와 sl을 제공하며, tp와 sl은 각 신호 위와 아래에 선 형태로 표시되며 새로운 신호가 형성될 때까지 연장됩니다. 이 표시기에는 기록 신호의 승/패 통계를 제공하는 백테스팅 패널/대시보드가 ​​있으며, 이 표시기는 다시 칠하거나 다시 칠하지 않습니다. 매개변수: StalkeR 기간: 화살표 기간, 숫자가 높을수록 더 적은 수의 신호가 제공됩니다. 스프레드: 포인트 단위의 스프레드 값을 사용하여 패널에서 승패를 계산합니다. 정지손실 ATR x : atr 곱셈의 SL 값 Takeprofit ATR x : atr 곱셈의 TP 값 ATR 기간 : tp 및 sl을 기반으로 계산하는 데 사용되는 atr 기간 TP/SL 라인 색상 및 너비 화살표 색상 및 너비 패널
Dynamic Forex28 Navigator
Bernhard Schweigert
5 (5)
Dynamic Forex28 Navigator - 차세대 외환 거래 도구. 현재 49% 할인. Dynamic Forex28 Navigator는 오랫동안 인기 있는 지표의 진화형으로, 세 가지의 힘을 하나로 결합했습니다. 고급 통화 Strength28 지표(695개 리뷰) + 고급 통화 IMPULSE with ALERT(520개 리뷰) + CS28 콤보 신호(보너스). 지표에 대한 자세한 정보 https://www.mql5.com/en/blogs/post/758844 차세대 Strength 지표는 무엇을 제공합니까?  원래 지표에서 좋아했던 모든 것이 새로운 기능과 더 높은 정확도로 강화되었습니다. 주요 기능: 독점적인 통화 Strength 공식.  모든 시간대에 걸쳐 부드럽고 정확한 강도선. 추세와 정확한 진입을 식별하는 데 이상적입니다. 역동적인 시장 피보나치 수준(시장 피보나치).  이 지표에만 있는 고유한 기능. 가격 차트가 아닌 통화 강도에 피보나치가 적용됩니다.
Hit Rate Top Bottom Signal
Martin Alejandro Bamonte
히트율 탑 바텀 신호 히트율 탑 바텀 신호 히트율 탑 바텀 신호 는 완전히 혁신적인 접근 방식을 제공합니다. 특정 TP-SL과 PAIR/TF에서 어떤 성과를 내는지 미리 평가하고자 하는 분들께 이상적입니다. 전략 히트율 탑 바텀 신호 는 모든 트레이더와 모든 거래 유형 에게 필수적인 도구입니다. 이 전략은 정확한 리페인트 없는 신호 를 제공하여 언제 어떤 방향으로 거래해야 할지를 명확하게 제시할 뿐만 아니라 각 페어와 TF에 대한 상세한 성공률 기록 을 제공합니다. 사전 정의된 테이크 프로핏(TP)과 스톱 로스(SL)을 통해 신호의 효율성을 미리 알 수 있습니다 , 이는 효과적인 리스크 관리와 정확한 거래에 매우 중요합니다. 이 전략의 특징은 전체 움직임이 아닌 임펄스 내의 반전 지점을 감지하는 데 중점을 두고 있어 전통적인 탑-바텀보다 신호 발생 빈도가 높고, 시장의 주요 변동에서 핵심 순간을 포착하는 데 집중합니다. 이 전략은 SL/TP 비율과 결합된 신호의 과거 성과를
System Trend Pro
Aleksandr Makarov
5 (2)
Special offer! https://www.mql5.com/ru/users/bossik2810 System Trend Pro - This is the best trend trading indicator!!! The indicator no repaint!!!  The indicator has   MTF   mode, which adds confidence to trading on the trend (   no repaint   ). How to trade? Everything is very simple, we wait for the first signal (big arrow), then wait for the second signal (small arrow) and enter the market in the direction of the arrow. (See screens 1 and 2.) Exit on the opposite signal or take 20-30 pips,
IQ Gold Gann Levels
INTRAQUOTES
5 (1)
IQ Gold Gann Levels a non-repainting, precision tool designed exclusively for XAUUSD/Gold intraday trading. It uses W.D. Gann’s square root method to plot real-time support and resistance levels, helping traders spot high-probability entries with confidence and clarity. William Delbert Gann (W.D. Gann) was an exceptional market analyst, whose trading technique was based on a complex blend of mathematics, geometry, astrology, and ancient mathematics which proved to be extremely accurate. Download
Introducing the Delta Volume Profile Indicator - Unleash the Power of Institutional Precision!  https://youtube.com/shorts/znUdz5PEBAY Technical Indicator: Are you ready to trade like the pros? The Delta Volume Profile Indicator is no ordinary tool. It’s a high-precision, cutting-edge indicator that puts the power of institutional-grade trading in your hands. This unique indicator analyses delta volume distribution in real-time, revealing the market's hidden buy/sell imbalances that the biggest
TrendMaestro
Stefano Frisetti
4 (4)
note: this indicator is for METATRADER4, if you want the version for METATRADER5 this is the link:  https://www.mql5.com/it/market/product/108106 TRENDMAESTRO ver 2.4 TRENDMAESTRO recognizes a new TREND in the bud, he never makes mistakes. The certainty of identifying a new TREND is priceless. DESCRIPTION TRENDMAESTRO identifies a new TREND in the bud, this indicator examines the volatility, volumes and momentum to identify the moment in which there is an explosion of one or more of these data a
Enigmera
Ivan Stefanov
5 (7)
ENIGMERA: 시장의 핵심 중요: MQL5.com의 데모는 Strategy Tester에서 실행되며 Enigmera의 기능을 완전히 반영하지 못할 수 있습니다. 설명, 스크린샷 및 비디오를 확인하여 자세한 내용을 확인하십시오. 질문이 있으면 언제든지 메시지를 보내주세요! 인디케이터의 코드는 완전히 다시 작성되었습니다. 버전 3.0은 새로운 기능을 추가하고 인디케이터가 처음 출시된 이후 누적된 버그를 수정했습니다. 소개 이 인디케이터 및 거래 시스템은 금융 시장에 대한 주목할 만한 접근 방식입니다. ENIGMERA는 프랙탈 주기를 사용하여 정확하게 지원 및 저항 수준을 계산합니다. 실제 축적 단계를 보여주고 방향과 목표를 제공합니다. 트렌드와 수정 모두에서 작동하는 시스템입니다. 작동 방식 인디케이터의 대부분의 기능은 차트 왼쪽에 있는 버튼을 통해 제어되며, 이를 통해 다양한 시장 상황에 빠르게 대응할 수 있습니다. 버튼 ON/OFF – 인디케이터 전체를 표시하거나 숨깁니다.
IQ FX Gann Levels
INTRAQUOTES
5 (2)
IQ FX Gann Levels a precision trading indicator based on W.D. Gann’s square root methods. It plots real-time, non-repainting support and resistance levels to help traders confidently spot intraday and scalping opportunities with high accuracy. William Delbert Gann (W.D. Gann) was an exceptional market analyst, whose trading technique was based on a complex blend of mathematics, geometry, astrology, and ancient mathematics which proved to be extremely accurate. Download the Metatrader 5 Version M
NAM Order Blocks
NAM TECH GROUP, CORP.
3 (2)
MT4 Multi-timeframe Order Blocks detection indicator. Features - Fully customizable on chart control panel, provides complete interaction. - Hide and show control panel wherever you want. - Detect OBs on multiple timeframes. - Select OBs quantity to display. - Different OBs user interface. - Different filters on OBs. - OB proximity alert. - ADR High and Low lines. - Notification service (Screen alerts | Push notifications). Summary Order block is a market behavior that indicates order collection
Linear Trend Predictor - 진입 지점과 방향성 지원선을 결합한 추세 지표입니다. 고가/저가 채널을 돌파하는 원칙에 따라 작동합니다. 지표 알고리즘은 시장 노이즈를 걸러내고 변동성과 시장 역학을 고려합니다. 표시기 기능  평활화 방법을 사용하여 시장 추세와 BUY 또는 SELL 주문을 시작하기 위한 진입 시점을 보여줍니다.  모든 기간의 차트를 분석하여 단기 및 장기 시장 움직임을 파악하는 데 적합합니다.  어떠한 시장과 시간대에도 적용할 수 있으며, 입력 매개변수를 통해 거래자는 자신에게 맞게 지표를 독립적으로 사용자 지정할 수 있습니다.  설정된 지표 신호는 사라지거나 다시 그려지지 않습니다. 이는 캔들 마감 시 결정됩니다.  여러 유형의 알림이 화살표와 결합되어 있습니다.  이 지표는 독립적인 거래 시스템으로 사용할 수도 있고, 다른 거래 시스템에 추가하는 용도로도 사용할 수 있습니다.  모든 수준의 경험을 가진 거래자가 사용할 수 있습니다. 주요 매
RelicusRoad Pro
Relicus LLC
4.63 (104)
이제 $ 147 (몇 가지 업데이트 후 $ 499 증가) - 무제한 계정 (PCS 또는 MACS) RelicusRoad 사용 설명서 + 교육 비디오 + 비공개 Discord 그룹 액세스 + VIP 상태 시장을 보는 새로운 방법 RelicusRoad는 외환, 선물, 암호화폐, 주식 및 지수에 대한 세계에서 가장 강력한 거래 지표로서 거래자에게 수익성을 유지하는 데 필요한 모든 정보와 도구를 제공합니다. 우리는 초보자부터 고급까지 모든 거래자가 성공할 수 있도록 기술적 분석 및 거래 계획을 제공합니다. 미래 시장을 예측할 수 있는 충분한 정보를 제공하는 핵심 거래 지표입니다. 우리는 차트에서 말이 안 되는 여러 지표 대신 완전한 솔루션을 믿습니다. 타의 추종을 불허하는 매우 정확한 신호, 화살표 + 가격 조치 정보를 표시하는 올인원 표시기입니다. 강력한 AI를 기반으로 하는 RelicusRoad는 누락된 정보와 도구를 제공하여 교육하고 성공적인 트레이더인 트레이딩 전문가가 되도
AT Forex Indicator MT4
Marzena Maria Szmit
5 (3)
The AT Forex Indicator MT4 is a sophisticated trading tool designed to provide traders with a comprehensive analysis of multiple currency pairs. This   powerful indicator   simplifies the complex nature of the forex market, making it accessible for both novice and experienced traders. AT Forex Indicator uses   advanced algorithms   to detect trends, patterns and is an essential tool for traders aiming to enhance their forex trading performance. With its robust features, ease of use, and reliabl
Beast Super Signal
Dustin Vlok
4.73 (89)
수익성 있는 거래 기회를 쉽게 식별하는 데 도움이 되는 강력한 외환 거래 지표를 찾고 계십니까? Beast Super Signal보다 더 이상 보지 마십시오. 사용하기 쉬운 이 추세 기반 지표는 시장 상황을 지속적으로 모니터링하여 새로운 개발 추세를 찾거나 기존 추세에 뛰어들 수 있습니다. Beast Super Signal은 모든 내부 전략이 정렬되고 서로 100% 합류할 때 매수 또는 매도 신호를 제공하므로 추가 확인이 필요하지 않습니다. 신호 화살표 알림을 받으면 구매 또는 판매하기만 하면 됩니다. 구매 후 비공개 VIP 그룹에 추가되도록 저에게 메시지를 보내주세요! (전체 제품 구매만 해당). 최신 최적화된 세트 파일을 구입한 후 저에게 메시지를 보내주세요. MT5 버전은   여기에서 사용할 수 있습니다. 여기에서   Beast Super Signal EA를 받으세요. 최신 결과를 보려면 댓글 섹션을 확인하세요! Beast Super Signal은 1:1, 1:2
PTS Precision Index Oscillator V2
PrecisionTradingSystems
5 (1)
프리시전 트레이딩 시스템의 로저 메드칼프에 의한 프리시전 인덱스 오실레이터 (Pi-Osc) 버전 2는 차트에 신속하게 로드되도록 주의 깊게 다시 코딩되었으며 경험을 향상시키기 위해 몇 가지 다른 기술적 개선 사항이 통합되었습니다. Pi-Osc는 정확한 거래 타이밍 신호를 제공하도록 개발되었으며 시장이 모든 사람의 스톱을 청산하기 위해 가야 하는 극도의 고갈 지점을 찾는 데 목적이 있습니다. 이 제품은 극단적인 지점이 어디에 있는지 알고 있는 고전적인 문제를 해결하며 트레이더로서의 삶을 훨씬 간단하게 만듭니다. 이것은 업계 표준 오실레이터와는 상당히 다른 강력한 차이점을 가지고 있는 고도로 복잡한 합의 지표입니다. 사용하는 기능 중 일부는 수요 지수, 자금 흐름, RSI, 스토캐스틱, 패턴 인식, 거래량 분석, 표준 편차 극단점 및 다양한 길이에서 위와 유사한 변형을 갖습니다. 미숙한 눈에는 다른 오실레이터와 비슷해 보일 수 있지만 RSI 또는 모멘텀과 같은 다른 오실레이
Max Min Cycle
Vitalyi Belyh
Cyclical indicator for trading and predicting the direction of the market. Shows the cyclical behavior of the price in the form of an oscillator. Gives signals for opening deals when rebounding from the upper and lower boundaries of the oscillator. In the form of a histogram, it shows the smoothed strength of the trend. Will complement any trading strategy, from scalping to intraday. The indicator does not redraw. Suitable for use on all symbols/instruments. Suitable time frames for short-term t
Order Blocks ICT Multi TF MT4
Diego Arribas Lopez
5 (2)
[ MT5 Version ]  [ Kill Zones ]  [ SMT Divergences ] How to trade using Order Blocks:  Click here User Interface Performance:  During testing in the strategy tester, the UI may experience lag. Rest assured, this issue is specific to the testing environment and does not affect the indicator's performance in live trading. Elevate your trading strategy with the  Order Blocks ICT Multi TF  indicator, a cutting-edge tool designed to enhance your trading decisions through advanced order block analys
PTS Divergence Sell Finder V2
PrecisionTradingSystems
로저 메드칼프 (Roger Medcalf)의 PTS 다이버전스 파인더 판매 인디케이터 - 프리시전 트레이딩 시스템. 이 인디케이터는 곰세 - 판매 신호만을 제공합니다. 먼저, 많은 해 동안 매수 신호 다이버전스 파인더를 제공하는 반면 판매 다이버전스 인디케이터를 제공하지 않았던 이유를 자주 묻는 질문을 받았습니다. 매도 다이버전스가 매수 다이버전스보다 신뢰성이 떨어진다고 답했으며, 이것은 여전히 사실입니다. 이를 변경하기 위한 몇 가지 솔루션이 발견되었으며, 이는 동료 압력에 따르거나 15년 전에 만든 이 인디케이터를 수정하는 것이 아니라 기본 설정을 보다 엄격하게 변경함으로써 이루어졌습니다. PTS 다이버전스 파인더 판매 인디케이터는 어떻게 작동합니까? PTS 다이버전스 파인더 판매 인디케이터는 거래량을 기반으로 한 Demand Index에서 발생한 다이버전스의 수를 정확하게 측정합니다. MT4는 거래량 대신 틱 거래량을 제공하므로 기본 Demand Index 인디케이터에서 발생하
PTS Divergence Buy Finder
PrecisionTradingSystems
PTS - Precision Trading Systems의 Divergence Buy Finder Precision Divergence Finder는 시장 바닥을 핀포인트 정확도로 찾아내도록 설계되었으며 이를 자주 수행합니다. 기술적 분석에서 바닥을 고르는 기술은 일반적으로 정상을 선택하는 것보다 훨씬 쉽습니다. 이 항목은 정확히 이 작업을 위해 설계되었습니다. 상승 Divergence가 식별되면 구매하기 전에 트렌드가 반등할 때 기다리는 것이 현명합니다. 10 또는 20 바 높음을 사용하거나 이전 바의 이동 평균 15-30이 상승하는 것을 식별하기 위해 사용할 수 있습니다. 복잡한 알고리즘은 실시간 바 단위로 활성 Demand Index(DI) Divergence 수를 찾아내고 계산합니다. 모델은 시장 가격이 새로운 최저점을 기록하고 Demand Index가 새로운 최저점을 기록하지 않을 때 Divergence를 발생시키는 것을 관찰합니다. 이 지표는 두 가지 설정을 사
POWR Rise Coming
Trade Indicators LLC
This indicator is SO SIMPLE… when the green Rise Coming arrow appears, a price drop may be on the way! Plain and easy profits! As you receive more than one 'Rise Coming' text signal in a downtrend, it means momentum is building larger for a bull run. HOW TO USE 1. When the green "Rise Coming" text appears, a price jump may be on the way! This indicator Never Repaints! To get the best setting it's a matter of tweaking the indicator until it gives you the best results. Our recommendation, and what
거래 수준 지표는 진입점을 결정하고 포지션을 유지하며 추세 방향을 유지하도록 설계된 거래 시스템입니다. 하나의 복합체에서 작동하는 여러 메커니즘, 추세 방향의 파동 분석, 신호 구성 시 레벨 분석을 포함하고 가능한 TP 및 SL 목표를 보여줍니다. 표시기 기능 신호 화살표는 현재 캔들에 표시되며 다시 칠해지지 않습니다. 가격이 반등하는 수준을 검색하기 위해 특별한 알고리즘을 사용합니다. 추세에 따라 작동합니다. 이 시스템은 보편적이며 다양한 거래 수단에 적용될 수 있습니다. 화살표 경고에는 여러 유형이 있습니다. 신호 화살표의 입력 매개변수는 자동 모드에서 구성되고 작동됩니다. 기간에 따라 "추세 파동 기간" 매개변수를 변경합니다. "목표 수준 SL TP" 매개변수는 주요 통화쌍에 대해 정의되어 있으며 다른 거래 상품에 사용하기 위해 10개 이상의 증가가 가능합니다. 표시기 작동 방식 추세를 결정하기 위해 지표에는 파동선이 있습니다. 가격보다 높으면 추세는 약세이고, 가격보다
MartingaleArrow
Abdulkarim Karazon
Martingale Arrow는 martingale 바이너리 옵션 거래를 위해 설계된 화살표 유형 mt4 표시기입니다. 이 화살표는 바 열기/인트라 바에 인쇄되고 경고를 제공합니다. 사용 방법: 화살표가 나타나는 순간 거래를 개시하세요. 거래가 성공했다면 다음 신호를 기다렸다가 동일한 로트를 거래하세요. 다음 신호에서 거래가 두 배의 로트를 잃고 신호가 승리할 때까지 계속 그렇게 하는 경우 재설정하고 첫 번째 거래 로트로 거래하세요. 권장 기간: 모두 최소 보증금 : 200 단위. 이 표시기 라이브는 다음을 수행하지 않습니다: 다시 칠하기/뒤로 칠하기 ------------------------------------- ------------- 매개변수: 표시 기간: 변경 시 다른 신호를 제공합니다. 지표 가격/유형 과매수/과매도 수준 경고 입력 화살표 스타일 ==========================================
Introduction to Fractal Pattern Scanner Fractal Indicator refers to the technical indicator that makes use of the fractal geometry found in the financial market. Fractal Pattern Scanner is the advanced Fractal Indicator that brings the latest trading technology after the extensive research and development work in the fractal geometry in the financial market. The most important feature in Fractal Pattern Scanner is the ability to measure the turning point probability as well as the trend probabi
이 지표는 실제 거래에 완벽한 자동 파동 분석 지표입니다! 사례... 참고:   웨이브 그레이딩에 서양식 이름을 사용하는 데 익숙하지 않습니다. Tang Lun(Tang Zhong Shuo Zen)의 명명 규칙의 영향으로 기본 웨이브를   펜   으로 명명하고 2차 웨이브 밴드를   세그먼트   로 명명했습니다. 동시에, 세그먼트에는 추세 방향이 있습니다.   주요 추세 세그먼트에는   이름이 지정되지만(이 이름 지정 방법은 향후 노트에서 사용됩니다. 먼저 말씀드리겠습니다.) 알고리즘은 굴곡 이론과 거의 관련이 없으므로 그렇게 해서는 안 됩니다. 이는 나의 시장 분석을   통해 요약된 끊임없이 변화하고 복잡한 운영 규칙을   반영합니다. 밴드는 더 이상 사람마다 다르지 않도록 표준화되고 정의되었습니다. 인위적인 간섭의 드로잉 방법은 시장 진입을 엄격하게 분석하는 데 핵심적인 역할을 합니다. 이 지표를 사용하는 것은 거래 인터페이스의 미학을 개선하고 원래의 K-line 거래를
ECM Elite Channel is a volatility-based indicator, developed with a specific time algorithm, which consists of finding possible corrections in the market. This indicator shows two outer lines, an inner line (retracement line) and an arrow sign, where the channel theory is to help identify overbought and oversold conditions in the market. The market price will generally fall between the boundaries of the channel. If prices touch or move outside the channel, it's a trading opportunity. The ind
Supply and Demand Dashboard PRO
Bernhard Schweigert
4.8 (20)
현재 20% 할인! 이 대시보드는 여러 기호와 최대 9개의 타임프레임에서 작동하는 매우 강력한 소프트웨어입니다. 주요 지표(최상의 리뷰: 고급 공급 수요)를 기반으로 합니다.   Advanced Supply Demand 대시보드는 훌륭한 개요를 제공합니다. 다음과 같이 표시됩니다.  영역 강도 등급을 포함하여 필터링된 공급 및 수요 값, 영역에 대한/및 영역 내 Pips 거리, 중첩된 영역을 강조 표시하고 모든 (9) 시간 프레임에서 선택한 기호에 대해 4가지 종류의 경고를 제공합니다. 그것은 당신의 개인적인 필요에 맞게 고도로 구성 가능합니다! 당신의 혜택! 모든 트레이더에게 가장 중요한 질문: 시장에 진입하기에 가장 좋은 수준은 무엇입니까? 최고의 성공 기회와 위험/보상을 얻으려면 강력한 공급/수요 영역 내 또는 그 근처에서 거래를 시작하십시오. 손절매를 위한 최적의 장소는 어디입니까? 가장 안전하려면 강력한 수요/공급 구역 아래/위에 정류장을 두십시오.
Trend Oscillator for MT4
Nicola Capatti
5 (1)
트렌드 오실레이터: 부드럽고 신뢰할 수 있는 시장 트렌드 식별 트렌드 오실레이터는 트레이더가 트렌드 방향과 잠재적 반전 포인트를 정확하게 식별하는 데 도움을 주기 위해 설계된 MT4의 고급 지표입니다. 직관적인 시각적 표현을 통해 시장이 상승 추세인지 하락 추세인지를 명확하게 보여주어 분석을 단순화하고 차트 가독성을 높입니다. 다양한 시장 및 시간 프레임에 적합하여 여러 트레이딩 요구에 유연하게 대응할 수 있습니다. 트렌드 오실레이터의 주요 특징과 장점 단순화된 트렌드 시각화 : 트렌드 오실레이터는 라인의 색상을 변경하여 트렌드 움직임을 그래픽으로 나타냅니다. 파란색은 상승 추세를, 노란색은 하락 추세를 나타내어 트렌드를 즉시 명확하게 파악할 수 있습니다. 신뢰할 수 있는 반전 신호 : 고급 알고리즘을 통해 지표는 잠재적인 반전 포인트를 나타내는 색상의 화살표를 생성합니다. 녹색 화살표는 매수 포인트를, 빨간색 화살표는 매도 포인트를 나타내어 트레이더가 진입 또는 청산을 평가할 수
제작자의 제품 더 보기
EA Gold Trader for Prop-Firms Prop Firm 챌린지를 정밀하고 신뢰성 있게 극복하기 위한 최고의 동반자! "EA Gold Trader for Prop-Firms"는 가장 널리 알려진 Prop Firm의 챌린지를 성공적으로 수행하고 이후 단계에서도 운영의 안정성을 유지하도록 설계된 Expert Advisor입니다. 유연한 설정과 최적화된 매개변수 덕분에, 이 EA는 Prop Firm의 요구 사항을 충족하며 신뢰할 수 있고 통제된 거래 경험을 제공합니다. 주요 특징 허용 최대 손실률 (Max DD Allowed) Prop Firm에서 허용하는 최대 손실률을 설정할 수 있습니다. EA는 이 한계를 지속적으로 모니터링하며 규정을 준수하기 위해 자동으로 거래를 중지합니다. 유연한 로트 관리 고정 로트(Fixed Lots): 위험을 수동으로 관리하기 위해 고정 로트를 설정할 수 있습니다. 자동 로트(Auto Lots): 잔고를 기반으로 로트를 자동 계산하며, 잔고/
Trend Oscillator for MT4
Nicola Capatti
5 (1)
트렌드 오실레이터: 부드럽고 신뢰할 수 있는 시장 트렌드 식별 트렌드 오실레이터는 트레이더가 트렌드 방향과 잠재적 반전 포인트를 정확하게 식별하는 데 도움을 주기 위해 설계된 MT4의 고급 지표입니다. 직관적인 시각적 표현을 통해 시장이 상승 추세인지 하락 추세인지를 명확하게 보여주어 분석을 단순화하고 차트 가독성을 높입니다. 다양한 시장 및 시간 프레임에 적합하여 여러 트레이딩 요구에 유연하게 대응할 수 있습니다. 트렌드 오실레이터의 주요 특징과 장점 단순화된 트렌드 시각화 : 트렌드 오실레이터는 라인의 색상을 변경하여 트렌드 움직임을 그래픽으로 나타냅니다. 파란색은 상승 추세를, 노란색은 하락 추세를 나타내어 트렌드를 즉시 명확하게 파악할 수 있습니다. 신뢰할 수 있는 반전 신호 : 고급 알고리즘을 통해 지표는 잠재적인 반전 포인트를 나타내는 색상의 화살표를 생성합니다. 녹색 화살표는 매수 포인트를, 빨간색 화살표는 매도 포인트를 나타내어 트레이더가 진입 또는 청산을 평가할 수
MetaTrader 5 무료 스프레드 지표 이 지표는 MetaTrader 5에서 스프레드에 대한 자세한 분석을 제공합니다. 스프레드는 자산의 매수 가격(Ask)과 매도 가격(Bid) 간의 차이를 나타내므로, 트레이더에게 중요한 매개변수 중 하나입니다. 지표에는 다음이 포함됩니다: 평균 스프레드 : 당일 관찰된 최고 스프레드와 최저 스프레드 간의 평균으로 계산됩니다. 현재 스프레드 : 현재 시장 스프레드를 표시합니다. 최저 스프레드 : 당일 기록된 최저 스프레드 값을 보여줍니다. 최대 스프레드 : 당일 기록된 최대 스프레드 값을 보여줍니다. 이 지표는 시장 상황에 대한 명확하고 즉각적인 뷰를 제공하도록 설계되었으며, 트레이더가 거래 비용을 보다 잘 평가하고 전략에 영향을 미칠 수 있는 스프레드 변동을 식별할 수 있도록 도와줍니다. 제 제품에 관심이 있으시면 다음 페이지를 방문해 보세요: 전문가 자문 : https://www.mql5.com/it/market/product/119456?
FREE
Volume Profile Indicator for MT4 Gain a trading edge with the "Volume Profile" indicator for MetaTrader 4 (MT4). This advanced technical analysis tool allows you to precisely identify key support and resistance levels based on transaction volume. Easily visualize market areas of high interest, where trading volumes are highest, and use this information to make more informed trading decisions. Key Features: Clear and detailed visualization : The indicator displays volume histograms directly on th
Ultimate Follow Line v3 트렌드를 정확하게 따라갈 수 있는 궁극적인 지표! Ultimate Follow Line v3를 만나보세요. MetaTrader 4용으로 설계된 이 지표는 시장 방향을 명확하게 식별할 수 있도록 도와줍니다. MQL4로 개발된 이 도구는 간단하고 효과적인 설계와 첨단 기술을 결합하여 트레이더에게 강력하고 직관적인 도구를 제공합니다. 주요 특징: 직관적인 시각화: 가격 움직임에 따라 동적으로 조정되며, 주요 반전 및 추세 지속 영역을 강조합니다. 사용자 지정 가능한 이중 색상: 방향 변화를 빠르게 표시하여 차트를 쉽게 읽고 해석할 수 있습니다. 트렌드 트레이더를 위한 최적화: 주요 트렌드에 집중할 수 있도록 지원하며, 횡보 시장의 "노이즈"를 제거합니다. 모든 시간 프레임과 호환: 단기부터 장기까지 Ultimate Follow Line v3는 모든 시간 프레임에서 작동하여 거래 스타일에 맞는 유연성을 제공합니다. 간단한 설정: 빠른 설치 및 사
FVG for MT5
Nicola Capatti
"Fair Value Gap" (FVG) 인디케이터 - 시장 불균형의 힘을 발견하세요 트레이딩 세계는 숨겨진 기회로 가득 차 있지만, 적절한 도구를 가진 사람만이 이를 효과적으로 식별하고 활용할 수 있습니다. 우리의 FVG 인디케이터 는 이를 돕기 위해 설계되었습니다. 시장을 읽는 능력을 향상시키고 최적의 진입 및 퇴출 포인트를 찾고자 하는 트레이더에게 FVG 인디케이터는 완벽한 동반자입니다. Fair Value Gap (FVG)이란 무엇인가요? Fair Value Gap의 개념은 가격 차트에 "갭"을 생성하는 공급과 수요 사이의 불균형을 나타냅니다. 이 갭은 가격이 이 불균형을 채우기 위해 다시 돌아올 수 있는 영역을 나타내며, 이 영역은 잠재적으로 가치 있는 트레이딩 기회입니다. 이러한 갭은 가격이 급격히 움직일 때 발생하며, 향후 시장 행동을 이해하는 열쇠가 될 수 있습니다. 왜 FVG 인디케이터가 중요한가요? FVG 인디케이터는 차트에서 이 불균형 영역을 쉽게 식별하고 가격이
9월 1일 일요일까지 77.90달러에서 37.90달러로 할인 "Forex Scanner"란 무엇입니까? "Forex Scanner"는 실시간으로 외환 시장에 대한 포괄적인 개요를 제공하도록 설계된 강력한 거래 도구입니다. 이 고급 지표는 여러 기술 지표와 시간 프레임에서 주요 데이터를 수집하여 거래 기회를 신속하게 식별할 수 있게 해줍니다. 여러 자산과 매개변수를 모니터링하면서 차트를 변경하지 않고자 한다면 "Forex Scanner"는 완벽한 솔루션입니다. "Forex Scanner"를 선택해야 하는 이유는 무엇입니까? 다중 시간대 스캔: "Forex Scanner"는 분 단위에서 시간 단위까지 다양한 시간대에서 시장을 모니터링할 수 있게 해줍니다. 이 도구는 여러 시간 레벨에서 추세 및 거래 신호를 즉시 식별할 수 있도록 도와주며, 완전하고 상세한 시장 뷰에 따라 조치를 취할 수 있게 해줍니다. 다중 지표 통합: 이 지표는 ATR, RSI, 스토캐스틱, ADX, 피벗 및 MA와
Maximize Your Trading Opportunities with the "Auto Trendlines" Indicator Discover the "Auto Trendlines" Indicator: "Auto Trendlines" is the essential tool for every technical trader. This indicator automatically plots trend lines, pinpointing support and resistance levels with surgical precision. It's ideal for those looking to capitalize on market breakouts and reversals. Key Features: Automatic Trendline Plotting: Identifies and draws crucial trend lines without manual intervention. Advanced C
FREE Spread indicator for MetaTrader 4 this indicator includes: -average spread -current spread -minimum spread -maximum spread If you are interested in my products I recommend you visit my page where you can find: Experts Advisors:  https://www.mql5.com/it/market/product/119456?source=Site+Profile indicators:  https://www.mql5.com/it/market/product/120038?source=Site+Profile I hope the spread indicator will be useful to you. https://www.mql5.com/it/users/kappa05
FREE
Presentation of the "Color Range Indicator" The "Color Range Indicator" is a powerful technical analysis tool designed for the MT4 platform, perfect for traders who want a clear and immediate view of market trends. This indicator draws a colored line based on the current trend, making it easier to interpret price movements. Indicator Description: Green line : Indicates an uptrend. Use this signal to consider buying opportunities. Red line : Indicates a downtrend. Use this signal to consider sell
Follow Line 지표는 시장 트렌드를 정확하게 식별하고 따라가는 트레이더에게 필수적인 도구입니다. 이 지표는 가격 변동에 따라 동적으로 조정되며, 가격 움직임을 매끄럽고 지속적으로 추적하는 선을 그립니다. 시각적으로 단순하고 트렌드 변화를 신호하는 데 효과적인 Follow Line은 모든 트레이더의 전략에 훌륭한 추가 요소가 됩니다. 주요 특징: 트렌드 추적: Follow Line은 가격을 면밀히 추적하여 트레이더가 진행 중인 시장 트렌드를 쉽게 식별할 수 있도록 합니다. 시각적 단순성: 명확하고 잘 정의된 선으로, 경험이 적은 트레이더도 시장 방향을 빠르게 이해할 수 있습니다. 적응성: 다양한 시간대와 도구에서 작동하여, 데이 트레이딩에서 스윙 트레이딩까지 다양한 거래 전략에 이상적입니다. 사용 방법: 설치: 분석하려는 금융 상품의 차트에 Follow Line 지표를 추가합니다. 설정: 거래 전략에 맞게 지표의 매개변수를 조정합니다. 트렌드 분석: Follow Line 선을
"Real Time MultiIndicator"란 무엇인가요? "Real Time MultiIndicator"는 기술 분석을 단순화하고 최적화하기 위해 설계된 고급 거래 도구입니다. 이 혁신적인 지표는 여러 시간 프레임과 기술 지표에서 신호를 수집하여 하나의 명확하고 읽기 쉬운 표로 표시합니다. 차트를 계속 변경하거나 각 지표를 수동으로 분석하지 않고도 시장에 대한 전체적이고 상세한 통찰을 원하신다면, "Real Time MultiIndicator"가 최적의 솔루션입니다. 왜 "Real Time MultiIndicator"를 선택해야 하나요? 다중 시간 프레임 분석: "Real Time MultiIndicator"는 다양한 시간 프레임에서 시장을 동시에 모니터링할 수 있게 해줍니다. M15에서 H4까지, 이 지표는 각 시간 프레임에서 추세가 상승 중인지 하락 중인지를 명확하게 보여주어 시장의 전체적인 모습을 바탕으로 정보를 기반으로 한 결정을 내릴 수 있도록 도와줍니다. 다양한 지표
Enhanced RSI는 트레이더에게 더 포괄적이고 정확한 시장 분석을 제공하기 위해 설계된 다재다능하고 맞춤화 가능한 기술 지표입니다. 이동 평균, RSI 및 MACD의 최고의 기능을 결합하여 이 지표는 모멘텀과 트렌드 강도에 대한 다차원적 관점을 제공합니다. 주요 특징: 완벽한 하이브리드화: Enhanced RSI는 이동 평균, RSI 및 MACD의 기능을 결합하여 가격 움직임에 대한 보다 완전한 그림을 제공합니다. 최대 유연성: 맞춤화 가능한 기간을 통해 이 지표는 모든 거래 스타일과 시간 프레임에 적응합니다. 다양한 활용: Forex부터 암호화폐, 주식, 지수에 이르기까지 모든 금융 자산에 대해 작동합니다. 분석 지원: Enhanced RSI는 자동 거래 시스템이 아니라 유용한 신호와 확인을 제공하여 기술 분석을 보완하는 도구입니다. 작동 방식: Enhanced RSI는 RSI의 지수 이동 평균을 계산하고 이를 MACD에서 나온 신호와 결합합니다. 그 결과는 과매수 및 과매도
Forex Scalper Indicator – 금융 시장에서 수익을 창출하는 정밀 도구 MT4용 Forex Scalper Indicator는 시장에서 최대한의 정밀도로 스캘핑하려는 모든 트레이더에게 완벽한 동반자입니다. 정확한 데이터에 기반한 분석 덕분에 이 지표는 빠른 의사 결정을 내리는 데 이상적인 적시의 정확한 신호를 제공합니다. 맞춤형 정밀도 차트에 표시되는 각 화살표는 신중한 계산을 기반으로 하며 최고의 진입 및 종료 기회를 제공합니다. 이들은 임의의 신호가 아닌 실시간으로 시장을 분석하는 정확한 지침입니다. 전환점의 정확한 감지 이 지표는 가격의 잠재적인 전환점을 높은 정확도로 식별하여 트레이딩에 필수적인 도구가 됩니다. 신뢰할 수 있는 데이터를 기반으로 생성된 신호 덕분에 시장의 가장 변동성이 큰 시기에도 수익을 극대화할 수 있습니다. 깨끗하고 읽기 쉬운 인터페이스 스크린샷에서 볼 수 있듯이 Forex Scalper Indicator는 차트에 명확하고 깔끔한 화살
AI Trading Consultant 는 시장을 분석하고 이해하는 데 있어 신뢰할 수 있는 기술 기반 도구를 찾는 트레이더를 위해 설계된 고급 지표입니다. 장·단기 기억을 갖춘 순환 신경망( RNN LSTM )을 기반으로 한 AI Trading Consultant는 매수 및 매도 신호를 명확하게 제공하여 잠재적인 시장 움직임을 파악하고 거래 결정을 지원합니다. 주요 특징: 고급 인공지능 (RNN LSTM) 이 지표는 장기 메모리가 있는 순환 신경망을 사용하여 과거 시장 데이터의 복잡한 패턴을 분석할 수 있습니다. RNN LSTM 기술은 과거 데이터 시퀀스를 "기억"하도록 설계되어 다양한 시장 상황에서 유용한 패턴 분석에 기반한 신호를 생성합니다. 다양한 시장 및 시간 프레임에 적응 가능 AI Trading Consultant는 주식, 외환, 암호화폐, 상품을 포함한 다양한 시장에 적응하도록 설계되었습니다. 여러 시간 프레임에서 효과적으로 작동하며, 특히 15분 시간 프레임 이
BTC Follow Line - 비트코인 거래 가이드 BTC Follow Line은 암호화폐 시장, 특히 비트코인에 중점을 두고 설계된 고급 지표입니다. 중장기적 매수 및 매도 신호를 찾는 트레이더에게 적합하며, 모든 시간 프레임에서 작동하여 거래 요구 사항에 맞게 조정됩니다. 왜 BTC Follow Line을 선택해야 할까요? 간단하고 직관적임 : 깔끔하고 읽기 쉬운 인터페이스로, 손쉽게 정보를 바탕으로 한 결정을 내릴 수 있습니다. 다재다능함 : 빠른 분석부터 장기 평가까지 모든 시간 프레임에서 작동합니다. 비트코인에 최적화됨 : BTC 시장의 고유한 동적 특성을 포착하도록 특별히 설계되어 더 일관된 신호를 보장합니다. BTC Follow Line은 어떻게 작동합니까? 이 지표는 비트코인 트렌드를 분석하고 주요 시장 변화에 따라 시각적 신호를 생성합니다. 명확히 정의된 녹색 및 빨간색 선은 잠재적 진입 또는 종료 지점을 나타내어 명확하고 정확한 지침을 제공합니다. 주요 장점: 불
AI Indicator: 스마트 트레이딩의 미래가 여기에 있습니다 새로운 트레이딩 시대에 오신 것을 환영합니다. AI Indicator 는 모든 수준의 트레이더에게 완벽한 동반자로, 신뢰할 수 있는 데이터와 고급 분석을 기반으로 결정을 내리는 데 도움을 주도록 설계되었습니다. 인공지능(AI)의 힘을 활용한 이 도구는 모든 시장 및 모든 시간 프레임 에 적응할 수 있는 능력으로 두드러지며 명확하고 정밀한 트레이딩 신호를 제공합니다. 인공지능(AI)란 무엇이며, 트레이딩에서 왜 중요한가요? 인공지능(AI)은 학습, 적응, 분석과 같은 인간의 인지 과정을 모방하는 첨단 기술입니다. 트레이딩에서 AI는 강력한 알고리즘을 사용하여 방대한 데이터를 신속하게 분석하고, 인간의 눈으로는 놓치기 쉬운 패턴을 식별합니다. 이를 통해 시장을 이해하는 새로운 차원이 열리고, 복잡하고 역동적인 환경에서도 더 자신감 있게 대처할 수 있습니다. AI Indicator의 핵심: 지능형 회귀선 AI Indicat
궁극의 화살표 지표 - 트레이딩 성공을 위한 당신의 도구! 많은 것을 약속하지만 제공하는 것이 적은 도구에 지치셨나요? 우리의 Ultimate Arrow Indicator for MT4는 당신의 트레이딩을 한 단계 높은 수준으로 끌어올릴 궁극적인 솔루션입니다. 이 지표는 명확하고 신뢰할 수 있는, 타협 없는 신호를 제공하기 위해 정밀하게 설계되었습니다. 이렇기 때문에 Ultimate Arrow Indicator는 경험이 풍부한 트레이더와 초보자 모두에게 이상적인 선택입니다: 탁월한 성능 - 검증된 결과 1년간의 상세한 백테스트: 승률 90%로 이 지표는 수익을 창출하는 데 매우 신뢰할 수 있는 것으로 입증되었습니다. 7,006개의 생성된 신호 중 6,242개가 승리였으며, 신호당 평균 29핍의 이익을 얻었습니다. 손실 비율 최소화: 생성된 신호 중 10%만이 부정적인 결과였으며, 이는 알고리즘의 정확도와 품질을 증명합니다. 주요 기능 리페인트 없음 : 신호가 생성된 후에는 변경되지
Just Trade Indicator – 정밀하고 스트레스 없는 트레이딩을 위한 최고의 도구! Just Trade Indicator는 MetaTrader 5를 위한 궁극적인 지표로, 명확한 진입 및 종료 지점을 쉽게 식별할 수 있도록 도와줍니다. 고급 알고리즘을 활용하여 직관적인 시각적 신호를 제공하므로 트레이딩을 간편하게 할 수 있습니다. Just Trade Indicator를 선택해야 하는 이유 명확하고 정확한 신호 – 차트에서 직관적인 화살표로 매수 및 매도 신호를 제공하여 해석의 혼동을 방지합니다. 다중 시간 프레임 및 자산 지원 – 외환, 주식, 지수, 암호화폐 등 모든 시장에서 작동하며, M1부터 월간 차트까지 지원합니다. 재도색 없음 – 생성된 신호가 변경되거나 사라지지 않아 신뢰성이 유지됩니다. 모든 트레이딩 스타일에 적합 – 스캘핑, 데이 트레이딩, 스윙 트레이딩 등 다양한 전략에 활용 가능. 내장 통계 기능 – 차트에서 직접 성공률을 확인
MetaTrader 4용   Cycle Trend Indicator 는 강세 또는 약세 추세 내에서 시장 주기와 주요 전환점을 정밀하게 분석, 인식 및 식별하기 위해 특별히 설계된 고급 기술 도구입니다. 차트에서 명확하게 볼 수 있듯이, 이 지표는 가격의 전반적인 움직임을 부드럽고 조화롭게 따라가는 매끄러운 곡선과 빨간색 및 녹색 화살표로 표시되는 명확하고 즉시 인식 가능한 시각적 신호를 결합하여 새로운 상승 또는 하락 주기의 시작 가능성을 강조하며 매우 가치 있는 트레이딩 지원을 제공합니다. 기존의 기술적 오실레이터와 달리,   Cycle Trend Indicator 는 가격 차트에서 직접 작동하여 가격 변동을 더 즉각적이고 자연스럽며 통합적으로 볼 수 있도록 합니다. 이는 시기적절하고 직관적이며 시각적으로 해석하기 쉬운 신호를 찾는 트레이더에게 특히 적합합니다. 지표의 색상 곡선은 지배적인 추세 방향에 따라 동적으로 변화합니다: 상승 단계에서는 밝은 녹색, 하락 단계에서는 진한
트렌드 파인더 오실레이터(Trend Finder Oscillator) 는   메타트레이더 4(MT4)   플랫폼을 위해 특별히 개발된 고급 기술 지표로, 트레이더들에게 진행 중인 트렌드의 시작뿐만 아니라 강도와 성숙도까지 식별할 수 있는 신뢰할 수 있고 정밀한 도구를 제공합니다. 이 지표는 시장의 두 가지 기본 구성 요소인   변동성 과   모멘텀 에 대한 종합적이고 심층적인 분석을 기반으로 합니다. 고정된 임계값과 반복적인 패턴을 통해 과매수 또는 과매도 상태만을 표시하는 전통적인 오실레이터와 달리, 이 도구는 훨씬 더 발전하여 시장의 더 깊은 내부 역학을 실시간으로 해석하고, 상황에 맞는 관련성 높은 실용적인 신호를 제공합니다. 중심 균형선을 기준으로 진동하지만,   트렌드 파인더 오실레이터 는 단순한 숫자 임계값보다 훨씬 더 정교한 내부 논리로 구성되어 있습니다. 이 지표는   변동성 확장 과   모멘텀 압축 의 고급 알고리즘을 통합하여, 시장이 명확하고 정의된 방향으로 상당히
IMPORTANT: The indicator will remain at the price of $34.90 until the release of the update scheduled for July 16, 2024. The New Price will be $49.90 (taxes excluded) FVG indicator. If you are an SMC trader this indicator will be very useful to you, it automatically identifies the FVGs on the graph distinguishing them into 2 types: bearish FVGs and bullish FVGs (see the photos to understand better). This indicator works on any Timeframe and on any market you want to use it. If you are interested
Expert Advisor for scalping; This EA was built for monthly profitability. Works on any asset: Forex, Indices, Crypto and Stocks. Perfectly usable in MT5 tester and usable on any TimeFrame. The EA has various inputs available to customize operations: -Lots -Risk% (0 = Fix) -OrderDist (the distance between one order and another, the distance is calculated in points not pips) -TP (in points) -Sl (in points) -TrailingStopTrigger(the trailing stop trigger point in points) -TrailingStop(distance from
Highs, Lows and Bos Indicator for MT5; The indicator works on any type of market and on all TimeFrames. It also works on the MetaTrader5 Tester. the main function of the indicator is to identify the highs and lows by marking them with a point above/below the candle, then with a horizontal line it marks the Bos. It is very simple and intuitive, there are only 2 inputs: -the color of the maximums -the color of the minima For any other information do not hesitate to contact me.
Panel Info Trade For MT5; The indicator has 2 main objects: -An icon chart that you can change Timeframe, zoom, Forex Pair, crypto....the position of the graph can be modified via the (x;y) inputs. The chart is perfectly usable in the MT5 tester. If the graph isn't for you and doesn't help you with anything, you can press the button on the top right to make it smaller. -the second object is a dynamic control panel where you can change plots, place sl and tp, BE, close partial... (if you watch th
통화 강도 지수 (Currency Strength Index - CSI) 지표 지표를 활성화하기 전에 "TRUE"로 설정하여 페어를 표시하도록 하십시오 통화 강도 지수 (Currency Strength Index - CSI) 지표는 주요 통화의 상대 강도를 측정하는 데 사용되는 강력한 도구입니다. 이 지표는 거래자가 특정 시점에서 가장 강한 통화와 가장 약한 통화를 식별하는 데 도움을 주어 더 정보에 기반한 거래 결정을 내릴 수 있게 합니다. 주요 특징: 비교 분석: 역사적 및 현재 데이터를 기반으로 다양한 통화의 강도를 비교합니다. 거래 신호: 상대적인 강도를 기준으로 최적의 통화 쌍을 식별하는 데 도움이 됩니다. 사용자 정의: 사용자는 계산 기간 및 기타 매개변수를 구성하여 자신의 거래 전략에 맞출 수 있습니다. 직관적인 시각화: 정보를 명확하고 시각적으로 제시하여 데이터 해석을 용이하게 합니다. 사용 방법: 설치: 원하는 통화 쌍의 차트에 CSI 지표를 추가하십시오. 설정: 계
In the world of trading, the key to success lies in having the right tools at the right time. Our innovative Volume Profile indicator was developed with one goal in mind: to provide traders with unprecedented access to vital market activity information. This cutting-edge tool allows you to not only see where and when volumes are traded but also to understand market depth with clarity never seen before. Main Features: Temporal Flexibility: Set the analysis range up to 1800 minutes to perfectly ma
AutoFibo for MT5
Nicola Capatti
Optimize Your Trading Decisions with the "autoFibo" Indicator Discover the "autoFibo" Indicator: "autoFibo" is the essential analysis tool for traders who want to fully leverage Fibonacci levels without the hassle of manual plotting. This indicator automates the Fibonacci retracement process, providing instant visual access to key support and resistance zones. Key Features: Automatic Fibonacci Retracement: Automatically plots Fibonacci levels, making it easy to identify support and resistance zo
Enhance Your Trading Performance with the "Better Volume" Indicator Discover the "Better Volume" Indicator: The "Better Volume" is the essential market volume analysis tool for traders aiming to stand out. It analyzes tick volumes with unprecedented accuracy, featuring an advanced moving average function (PERIOD_MA) and customizable buy and sell alerts. Key Features: Advanced Volume Analysis: Recognize volume peaks signaling crucial price movements. Intuitive Buy and Sell Alerts: Stay one step a
Enhance Your Trading Strategies with the "Order Block" Indicator for MT4 Discover the "Order Block" Indicator: The "Order Block" Indicator for MT4 is designed to help you precisely identify order blocks in the market by marking the highs and lows of the order block candles. This powerful tool enables you to understand where large institutions place their orders, improving your ability to predict market movements. Key Features: Precise Order Block Detection: Automatically highlights the highs and
필터:
리뷰 없음
리뷰 답변