• 미리보기
  • 리뷰 (39)
  • 코멘트 (375)
  • 새 소식

Blahtech Supply Demand

4.61

Was: $299  Now: $99  

Supply Demand uses previous price action to identify potential imbalances between buyers and sellers. The key is to identify the better odds zones, not just the untouched ones.

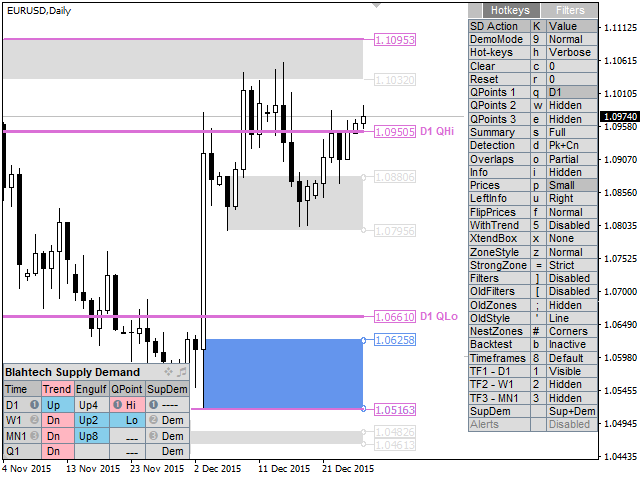
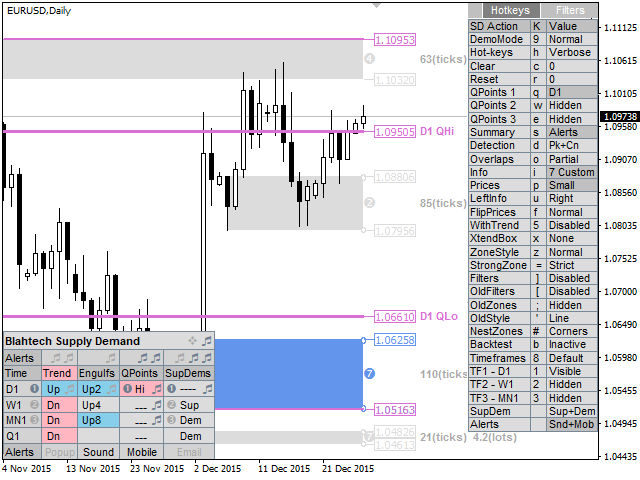
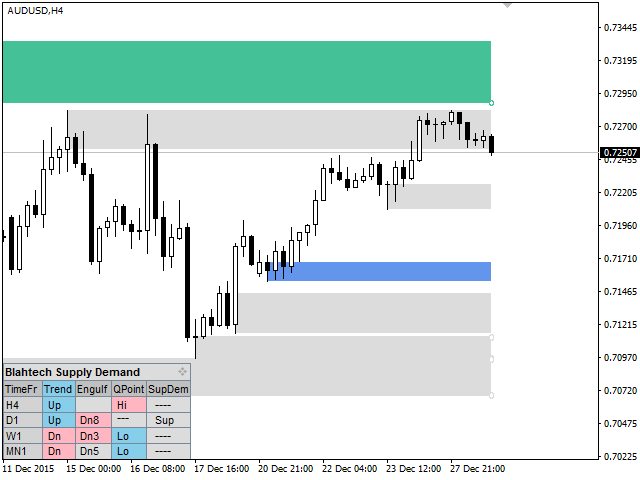
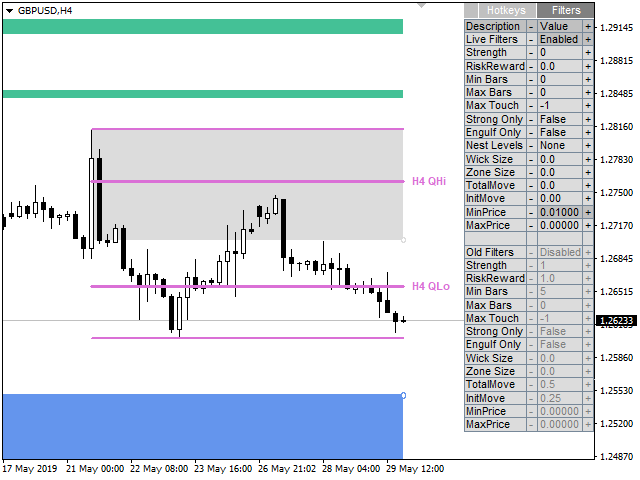
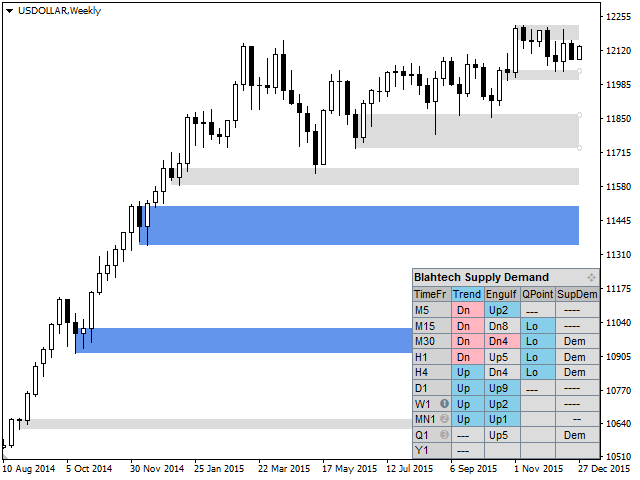
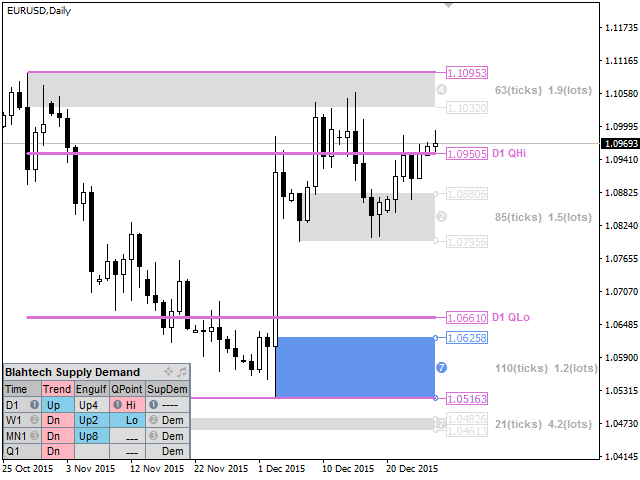
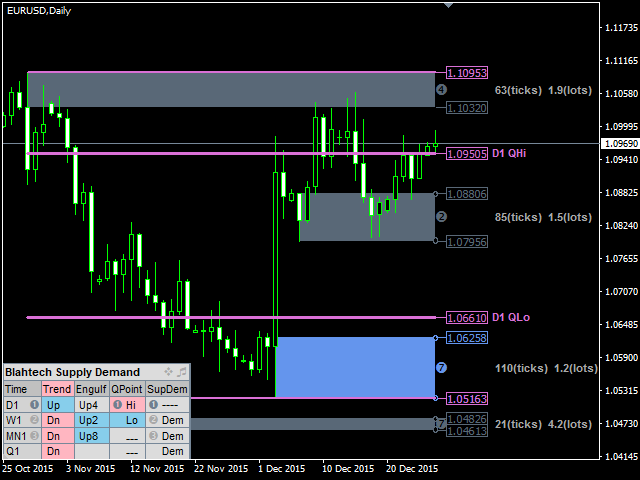
Blahtech Supply Demand indicator delivers functionality previously unavailable on any trading platform. This 4-in-1 indicator not only highlights the higher probability zones using a multi-criteria strength engine, but also combines it with multi-timeframe trend analysis, previously confirmed swings and engulfing detectors. Driven by an easy to use interface and innovative backtest mode this indicator is a must-have for all supply demand traders.

Links [ Install | Update | Documentation & Training ]


Feature Highlights

  • Multi-timeframe display
  • Backtest directly on the chart
  • Summary panel
  • Multi-timeframe trend analysis
  • Confirmed swings (High and Low QPoints)
  • Zone strength engine (seven criteria)

Feature Highlights continued...

  • Advanced level detection (peaks, consolidations, drop-base-drops)
  • Fast access hot-keys
  • Alerts
  • Engulfing detector
  • Visibility Filters
  • Old zones (broken levels or trend changes)
  • Highlight of Nested zones

Input Parameters

 - Download documentation using link above for details


    리뷰 20
    Zakarias
    48
    Zakarias 2021.11.03 13:05 
     

    Awesome, i like the idea and its running very very good

    David Cooper
    38
    David Cooper 2021.08.03 03:32 
     

    A leading indicator very well done. Remember to wait for price to come to you.

    YHW1022221880
    170
    YHW1022221880 2021.07.27 12:19 
     

    Good supply and demand indicators

    추천 제품
    BoxChart MT4
    Evgeny Shevtsov
    4.5 (6)
    The market is unfair if only because 10% of participants manage 90% of funds. An ordinary trader has slim changes to stand against these "vultures". This problem can be solved. You just need to be among these 10%, learn to predict their intentions and move with them. Volume is the only preemptive factor that faultlessly works on any timeframe and symbol. First, the volume appears and is accumulated, and only then the price moves. The price moves from one volume to another. Areas of volume accumu
    Blahtech Market Profile
    Blahtech Limited
    4.56 (16)
    Was: $249  Now: $99   Market Profile defines a number of day types that can help the trader to determine market behaviour. A key feature is the Value Area, representing the range of price action where 70% of trading took place. Understanding the Value Area can give traders valuable insight into market direction and establish the higher odds trade. It is an excellent addition to any system you may be using. Blahtech Limited presents their Market Profile indicator for the MetaTrader community. Ins
    MarketProfile EForex
    Veridiana Adorno Kendrick
    Market Profile Shows where the price has spent more time, highlighting important levels that can be used in trading. It is a powerful tool which is designed to take the fundamental components which comprise every market; price/volume/time, and visually display their relationship in real-time as the market develops for a pre-determined time period. Very powerful tool!
    History Pattern Search
    Yevhenii Levchenko
    표시기는 현재 시세를 작성하여 과거 시세와 비교할 수 있으며 이를 바탕으로 가격 변동을 예측합니다. 표시기에는 원하는 날짜로 빠르게 이동할 수 있는 텍스트 필드가 있습니다. 옵션: 기호 - 표시기가 표시할 기호 선택. SymbolPeriod - 지표가 데이터를 가져올 기간 선택. IndicatorColor - 표시기 색상. HorisontalShift - 지시자가 그린 따옴표를 지정된 막대 수만큼 이동합니다. Inverse - true는 인용 부호를 반대로, false - 원래 보기를 반전합니다. ChartVerticalShiftStep - 차트를 수직으로 이동합니다(키보드의 위/아래 화살표). 다음은 날짜를 입력할 수 있는 텍스트 필드의 설정으로, '엔터'를 누르면 즉시 이동할 수 있습니다.
    VolumeProfile
    Robert Hess
    3.8 (5)
    Descption: The Volume Profile displays detailed informations of historical trading activities at certain price levels (Market Profile). So you can locate the areas with the best prices in the market and get an advantage about other market participants. Features: Customizable Volume Profile / Market Profile Shows the "fair" Value Area with 70% of all Volume Shows critical low volume zones Shows VPOC, VAL and VAH Points Works on all timeframes Also available for MT5 ( https://www.mql5.com/en/m
    Volume by Price MT4
    Brian Collard
    4.64 (11)
    The Volume by Price Indicator for MetaTrader 4 features Volume Profile and Market Profile TPO (Time Price Opportunity). Volume and TPO histogram bar and line charts. Volume Footprint charts. TPO letter and block marker collapsed and split structure charts. Static, dynamic and flexible range segmentation and compositing methods with relative and absolute visualizations. Session hours filtering and segment concatenation with Market Watch and custom user specifications. Graphical layering, positio
    Market Profile 3
    Hussien Abdeltwab Hussien Ryad
    3 (2)
    Market Profile 3 MetaTrader 4 indicator  — is a classic Market Profile implementation that can show the price density over time, outlining the most important price levels, value area, and control value of a given trading session. This indicator can be attached to timeframes between M1 and D1 and will show the Market Profile for daily, weekly, monthly, or even intraday sessions. Lower timeframes offer higher precision. Higher timeframes are recommended for better visibility. It is also possible t
    FREE
    The Chaikin Oscillator is a technical indicator developed by Marc Chaikin that combines price and volume data to measure the accumulation and distribution of a financial instrument. It aims to identify potential buying and selling opportunities in the market. The Chaikin Oscillator is calculated by subtracting a 10-day exponential moving average of the Accumulation Distribution Line (ADL) from a 3-day exponential moving average of the ADL. Here's how to use the Chaikin Oscillator indicator in tr
    VR Grid
    Vladimir Pastushak
    5 (2)
    VR 그리드 표시기는 사용자 정의 설정으로 그래픽 그리드를 생성하도록 설계 되었습니다. 표준 그리드 와 달리 VR 그리드는 원형 레벨 을 구축하는 데 사용됩니다. 사용자의 선택에 따라 라운드 수준 사이의 단계는 임의적일 수 있습니다. 또한 VR Grid는 다른 인디케이터나 유틸리티와는 달리 기간이 바뀌거나 단말기를 재부팅해도 그리드의 위치 를 유지합니다. 설정, 세트 파일, 데모 버전, 지침, 문제 해결 등은 다음에서 얻을 수 있습니다. [블로그] 다음에서 리뷰를 읽거나 작성할 수 있습니다. [링크] 버전 [MetaTrader 5] 수직 수준 은 실제 시간 간격을 기준으로 하며 누락 또는 존재하지 않는 기간은 무시 합니다. 따라서 레벨 사이의 단계는 사용자가 선택한 값과 엄격하게 일치합니다. VR 그리드 표시기를 사용할 때 트레이더는 모든 수준에서 스타일 , 수직선 및 수평선의 색상 및 두께를 변경할 수 있습니다. 이를 통해 금융 상품의 라운드 수준 을 제어할 수 있습니다.
    FREE
    Simply The Best Pro
    Szymon Palczynski
    5 (1)
    This indicator displays the histogram and arrows on chart. When Simple The Best Pro are placed on a chart, they identify the trend.  The color of may be blue or red. The blue color stands for upside moves and the red color stands for downside trends. The indicator offers to set Stop Loss (SL) and  Take Profit (TP)  setting. The default value is ATR. Indicator has automatic optimization. The STB is a unique indicator that shows the tendency (button Bars) of a particular signals. The STB tells us
    Volume Profile Indicator for MT4 Gain a trading edge with the "Volume Profile" indicator for MetaTrader 4 (MT4). This advanced technical analysis tool allows you to precisely identify key support and resistance levels based on transaction volume. Easily visualize market areas of high interest, where trading volumes are highest, and use this information to make more informed trading decisions. Key Features: Clear and detailed visualization : The indicator displays volume histograms directly on th
    캔들의 종가를 예측하는 지표입니다. 지표는 주로 D1 차트에서 사용하기 위한 것이. 이 지표는 전통적인 외환 거래와 바이너리 옵션 거래 모두에 적합합니다. 지표는 독립형 거래 시스템으로 사용하거나 기존 거래 시스템에 추가로 사용할 수 있습니다. 이 표시기는 현재 양초를 분석하여 양초 본체 내부의 특정 강도 요인과 이전 양초의 매개변수를 계산합니다. 따라서 지표는 시장 움직임의 추가 방향과 현재 양초의 종가를 예측합니다. 이 방법 덕분에 지표는 단기 및 중장기 거래 모두에 적합합니다. 지표를 사용하면 시장 상황을 분석하는 동안 지표가 생성할 잠재적 신호의 수를 설정할 수 있습니다. 표시기 설정에는 이를 위한 특별한 매개변수가 있습니다. 또한 인디케이터는 새로운 신호에 대해 차트의 메시지 형태, 이메일 및 PUSH 알림 형태로 알릴 수 있습니다. 구매 후 저에게 꼭 써주세요! 나는 당신에게 지표와 거래에 대한 나의 추천을 줄 것입니다! 또한 보너스를 받으세요!
    A technical indicator that calculates its readings on trading volumes. In the form of a histogram, it shows the accumulation of the strength of the movement of the trading instrument. It has independent calculation systems for bullish and bearish directions. Works on any trading instruments and time frames. Can complement any trading system. The indicator does not redraw its values, the signals appear on the current candle. It is easy to use and does not load the chart, does not require additi
    BoxInside MT4
    Evgeny Shevtsov
    4.86 (7)
    This indicator calculates the volume profile and places labels that correspond to the VAH, VAL and POC levels, for each candle individually. Indicator operation features The indicator works on the timeframes from M5 to MN, but it uses the history data of smaller periods: M1 - for periods from M5 to H1, M5 - for the H4 period, M30 - for the D1 period, H4 - for the W1 period, D1 - for the MN period. The color and location of the VAL, VAH and POC labels on the current candle are considered to be
    FREE
    Forex Market Profile and Vwap
    Lorentzos Roussos
    4.83 (6)
    외환 시장 프로필(줄여서 FMP) 설명을 읽는 대신 라이브 차트에서 이것을 보고 싶다면 여기에서 무료 데모를 즉시 다운로드할 수 있습니다. 이것이 아닌 것 : FMP는 일반적인 문자 코드 TPO 표시가 아니며 전체 차트 데이터 프로필 계산을 표시하지 않으며 차트를 기간으로 분할하여 계산하지도 않습니다. 그것이 하는 일: 가장 중요한 것은 FMP 표시기가 사용자 정의 스펙트럼의 왼쪽 가장자리와 사용자 정의 스펙트럼의 오른쪽 가장자리 사이에 있는 데이터를 처리한다는 것입니다. 사용자는 마우스로 표시기의 양쪽 끝을 당기기만 하면 스펙트럼을 정의할 수 있습니다. 표시기 오른쪽 가장자리가 라이브 막대로 당겨지고 더 멀리(미래로) 표시되면 표시기가 "라이브"로 간주됩니다(새 막대로 업데이트됨). 표시기는 첨부된 차트에 "앵커" 개체를 놓은 다음 해당 앵커를 하드 드라이브의 파일과 연결합니다. 이렇게 하면 차트 또는 지표가 닫힐 때까지 다시 시작해도 설정이 유지되어 차트에서 계속
    FREE
    The indicator allows you to trade binary options. The recommended time frame is М1 and the expiration time is 1,2,3 minutes. The indicator suitable for auto and manual trading. A possible signal is specified as a arrows above/under a candle. You should wait until the candle closes! Arrows are not re-painted Trade sessions: TOKYO section (Half-end) Currency pairs: USD/JPY Working time frame: M1 Expiration time: 1,2,3 minutes. The indicator also shows good results when using the martingale strateg
    FREE
    The indicator analyzes the change in the minimum and maximum prices of the previous bars fixing the entrance of the big players. If the change (delta) increases, a signal is displayed on the graph in the form of an arrow. At the same time, virtual trade on history is carried out. In case of a repeat of the signal, the positions are increased (refilling). Thus the lot of positions can differ. The results of virtual trading in the form of losses / losses, profitability, drawdown and transaction li
    PZ Penta O MT4
    PZ TRADING SLU
    The Penta-O is a 6-point retracement harmonacci pattern which usually precedes big market movements. Penta-O patterns can expand and repaint quite a bit. To make things easier this indicator implements a twist: it waits for a donchian breakout in the right direction before signaling the trade. The end result is an otherwise repainting indicator with a very reliable trading signal. The donchian breakout period is entered as an input. [ Installation Guide | Update Guide | Troubleshooting | FAQ | A
    Dollar Mint Indicator
    David Mwaniki Mbugua
    Dollar mint indicator is a special workmanship with years of experience in forex.   Dollar mint ea is a fully non repaint indicator optimised with price action data such that once it gives you a signal t . The indicator   can be used to trade anything on the mt4 with much ease. Benefits ; Fully non repaint Use in any timeframe Use in all the available tradable assets on mt4 Best to use on h4. It generates fully analysed buy and sell signals based on trend and also filters out retracement
    The Magneto Volume Trigger indicator is designed for determining the volume confirmed by the candlestick pattern and predicting the trend tendency. Indicator setup and use The calculation of values is affected by two parameters - Period and Gate . The lower the value of Gate , the higher the sensitivity of the indicator. Period allows making a sample of data for the specified number of candles. The lower the value of Period , the more the indicator is adapted to the current market conditions.
    UPD1 Volume Pixel
    Vitaliy Kuznetsov
    5 (3)
    이 표시기는 지정된 계수를 기반으로 낮은,높은,극단적 인 볼륨을 찾아 지정된 색상으로 페인트합니다. 그것은 메타 트레이더 터미널의 표준 볼륨 그리기 기능을 대체합니다. 양초는 또한 볼륨의 색상으로 착색 될 수 있습니다. 극단적 인 볼륨을 가진 촛대에서는 최대 수평 볼륨(클러스터/포치)이 결정됩니다. 위치(밀기,중립,정지)에 따라 클러스터는 자체 색상을 갖습니다. 클러스터가 그림자에,그리고 촛불 극단적 인 볼륨을 가지고 있다면,우리는 반전에 대한 화살표를 얻을. 당신은 설정에서 경고를 활성화 할 수 있습니다. 또한 표시기에는 클러스터를 그림자로 표시하는 별도의 옵션이 있습니다. 입력 매개 변수. (색상 및 시각적 설정과 관련된 일부는 건너 뜁니다). 기본 설정. Bars Count – 표시기가 작동하는 기록 막대의 수. Data Source - 견적 기간 선택. 이 응용 프로그램은 당신이 당신의 자신의 음악을 만들 수 있습니다. Vertical Step - 밀도 및 수직 정확
    VolumeDeltaM1
    Stanislav Korotky
    3.25 (4)
    This indicator provides tick volume delta analysis on M1 timeframe. It monitors up and down ticks and sums them up as separate volumes for buys and sells, as well as their delta volumes, and volume clusters on price scale within a specified number of bars. This indicator complements VolumeDelta , which uses similar algorithms but does not process ticks and therefore cannot work on M1. VolumeDelta can show its signals on entire history because it reads M1 volumes for calculations on higher timefr
    Moving VVC mt4
    Andriy Sydoruk
    The   Visual Volatility Clustering   indicator clusters the market based on volatility. The indicator does not redraw and gives accurate data, does not use closing prices. Uses the opening prices or the highs or lows of the previous completed bar. Therefore, all information will be clear and unambiguous. The essence of the indicator is to divide the price market into certain areas according to a similar type of volatility. This can be done in any way. In this example, the indicator is configure
    Max LotSize
    Luis Alberto Atuncar Sanchez
    5 (2)
    LotSize Indicator Discover the appropriate lot size to use in your trades based on the available margin. This indicator provides valuable information for risk management. If the indicator shows a value of 0, it means that your balance or available margin is insufficient for trading. It is important to maintain adequate margin levels for safe trading practices. This indicator is exclusively designed for the MT4 platform, a popular and reliable trading platform in the market. With the LotSize Indi
    FREE
    Master scalping M1
    Nataliia Marchuk
    Master Scalping M1 is an innovative indicator that uses an algorithm to quickly and accurately determine the trend.The indicator calculates the time of opening and closing positions, the indicator's algorithms allow you to find the ideal moments to enter a deal (buy or sell an asset), which increase the success of transactions for most traders. Benefits of the indicator: Easy to assemble, does not overload the chart with unnecessary information. Can be used as a filter for any strategy. Works on
    VN Trade Panel II
    Vyacheslav Nekipelov
    4 (1)
    The new version of the trading panel, which now has the ability to separately close Buy and Sell orders, display targets for all orders on the chart, as well as the ability to use the panel to trade with brokers working on the FIFO rule. Also, the new version adds option buttons for separate management of open orders. It has a convenient visualized interface and intuitive control without a lot of additional tabs to which traders have to be distracted and switch their attention. Thanks to this
    Cumulative Delta MT4
    Evgeny Shevtsov
    4.93 (27)
    The indicator analyzes the volume scale and splits it into two components - seller volumes and buyer volumes, and also calculates the delta and cumulative delta. The indicator does not flicker or redraw, its calculation and plotting are performed fairly quickly, while using the data from the smaller (relative to the current) periods. The indicator operation modes can be switched using the Mode input variable: Buy - display only the buyer volumes. Sell - display only the seller volumes. BuySell -
    FREE
    This panel is a part of the SupDem-Pro trading system and is used to search for the best opportunities for any available instruments. Which can be selected manually in the Market Watch (open it with CTRL + M). Using this trading panel in combination with ShvedSupDem-Pro_Zone allows to analyze multiple currency pairs with a single click. The panel allows to load any instruments from the Market Watch, from 6 major currency pairs up to all instruments (480). The indicator parameters Button Width
    The Market Profile Indicator for MT4 displays the price levels and zones where increased trading activity happens. These zones with substantial forex trading activity provide the forex traders with the best entry levels, support, and resistance levels. Moreover, price levels indicate the best reversal zones. As a result, forex traders can identify BULLISH and BEARISH market trends and BUY and SELL entry points as well as the best reversal points. The indicator works well in all intraday timefram
    CumulativeDeltaBars
    Stanislav Korotky
    This indicator is a conventional analytical tool for tick volumes changes. It calculates tick volumes for buys and sells separately, and their delta on every bar, and displays volumes by price clusters (cells) within a specified bar (usually the latest one). The algorithm used internally is the same as in the indicator VolumeDelta , but results are shown as cumulative volume delta bars (candlesticks). Analogous indicator for MetaTrader 5 exists - VolumeDeltaBars . This is a limited substitution
    이 제품의 구매자들이 또한 구매함
    TrendMaestro
    Stefano Frisetti
    5 (3)
    note: this indicator is for METATRADER4, if you want the version for METATRADER5 this is the link:  https://www.mql5.com/it/market/product/108106 TRENDMAESTRO ver 2.4 TRENDMAESTRO recognizes a new TREND in the bud, he never makes mistakes. The certainty of identifying a new TREND is priceless. DESCRIPTION TRENDMAESTRO identifies a new TREND in the bud, this indicator examines the volatility, volumes and momentum to identify the moment in which there is an explosion of one or more of these data a
    TPSproTREND PrO
    Roman Podpora
    4.79 (19)
    TPSpro TREND PRO는   시장을 자동으로 분석하여 추세와 각 변화에 대한 정보를 제공할 뿐만 아니라 다시 그리지 않고도 거래에 진입할 수 있는 신호를 제공하는 추세 지표입니다! 지표는 각 양초를 사용하여 개별적으로 분석합니다. 다른 임펄스를 언급합니다 - 업 또는 다운 임펄스. 통화, 암호화폐, 금속, 주식, 지수 거래의 정확한 진입점! 버전 MT5                   표시기에 대한 전체 설명       표시기   와 함께 사용하는 것이 좋습니다   -   RFI LEVELS 주요 기능: 렌더링 없이 정확한 입력 신호! 신호가 나타나면 관련성은 유지됩니다! 이는 신호를 제공한 후 변경하여 예금 자금 손실을 초래할 수 있는 다시 그리기 지표와의 중요한 차이점입니다. 이제 더 큰 확률과 정확도로 시장에 진입할 수 있습니다. 화살표가 나타난 후 목표에 도달(이익실현)하거나 반전 신호가 나타날 때까지 캔들을 색칠하는 기능도 있습니다. STOP LOSS / TAK
    FX Volume
    Daniel Stein
    4.58 (33)
    FX 거래량은 브로커의 관점에서 시장 심리에 대한 진정한 통찰력을 제공하는 최초이자 유일한 거래량 지표입니다. 외환 시장에서 브로커와 같은 기관 시장 참여자의 포지션에 대한 놀라운 인사이트를 COT 보고서보다 훨씬 빠르게 제공합니다. 차트에서 이 정보를 직접 볼 수 있다는 것은 트레이딩 성공을 위한 획기적이고 혁신적인 솔루션입니다. 다음과 같은 고유한 시장 데이터 인사이트를 활용하세요: 비율은 통화에 대한 롱 포지션과 숏 포지션의 백분율 비율을 표시합니다. 비율 변화는 선택한 기간 내 매수 비율의 백분율 변화를 나타냅니다. 총 거래량은 해당 통화의 총 거래량(매수 및 매도)을 로트 단위로 표시합니다. 롱 거래량은 해당 통화에 대한 모든 롱 포지션의 거래량을 나타냅니다. 숏 거래량은 해당 통화에 대한 모든 숏 포지션의 거래량을 나타냅니다. 순매수 거래량은 모든 롱 포지션에서 모든 숏 포지션을 뺀 순매수 거래량을 나타냅니다. 순매수 비율은 해당 통화에 대한 순매수 거래량의 백분율
    PZ Day Trading
    PZ TRADING SLU
    3.67 (3)
    Effortless trading: non-repainting indicator for accurate price reversals Special Offer: Purchase now to receive free bonuses worth $90! (Read more for details) This indicator detects price reversals in a zig-zag fashion, using only price action analysis and a donchian channel. It has been specifically designed for short-term trading, without repainting or backpainting at all. It is a fantastic tool for shrewd traders aiming to increase the timing of their operations. [ Installation Guide | Upd
    Dynamic Forex28 Navigator
    Bernhard Schweigert
    5 (2)
    Dynamic Forex28 Navigator - 차세대 외환 거래 도구. 현재 49% 할인. Dynamic Forex28 Navigator는 오랫동안 인기 있는 지표의 진화형으로, 세 가지의 힘을 하나로 결합했습니다. 고급 통화 Strength28 지표(695개 리뷰) + 고급 통화 IMPULSE with ALERT(520개 리뷰) + CS28 콤보 신호(보너스). 지표에 대한 자세한 정보 https://www.mql5.com/en/blogs/post/758844 차세대 Strength 지표는 무엇을 제공합니까?  원래 지표에서 좋아했던 모든 것이 새로운 기능과 더 높은 정확도로 강화되었습니다. 주요 기능: 독점적인 통화 Strength 공식.  모든 시간대에 걸쳐 부드럽고 정확한 강도선. 추세와 정확한 진입을 식별하는 데 이상적입니다. 역동적인 시장 피보나치 수준(시장 피보나치).  이 지표에만 있는 고유한 기능. 가격 차트가 아닌 통화 강도에 피보나치가 적용
    TPSpro RFI Levels
    Roman Podpora
    4.82 (22)
    지침         러시아   -        영어       표시기와 함께 사용하는 것이 좋습니다   .       -       TPSpro   트렌드 프로 -   MT4 버전         거래에서 핵심 요소는 거래 상품을 매수 또는 매도하기로 결정하는 구역 또는 수준입니다. 주요 업체가 시장에서 자신의 존재를 숨기려는 시도에도 불구하고, 그들은 필연적으로 흔적을 남깁니다. 우리의 과제는 이러한 흔적을 식별하고 올바르게 해석하는 방법을 배우는 것이었습니다. 주요 기능:: 판매자와 구매자를 위한 활성 영역을 표시합니다! 이 지표는 매수 및 매도를 위한 모든 올바른 초기 임펄스 레벨/존을 보여줍니다. 진입점 검색이 시작되는 이러한 레벨/존이 활성화되면 레벨의 색상이 바뀌고 특정 음영으로 채워집니다. 또한 상황을 보다 직관적으로 이해하기 위해 화살표가 나타납니다. 더 높은 시간대의 레벨/존 표시(MTF 모드) 더 높은 시간 간격을 사용하여 레벨/존을 표시하는 기능을 추가했습니다.
    Scalper Inside PRO
    Alexey Minkov
    4.73 (56)
    An exclusive indicator that utilizes an innovative algorithm to swiftly and accurately determine the market trend. The indicator automatically calculates opening, closing, and profit levels, providing detailed trading statistics. With these features, you can choose the most appropriate trading instrument for the current market conditions. Additionally, you can easily integrate your own arrow indicators into Scalper Inside Pro to quickly evaluate their statistics and profitability. Scalper Inside
    Apollo Pips PLUS SP
    Oleg Rodin
    5 (4)
    제품을 구매하기 전에 아래 정보를 읽어보세요! Apollo Pips PLUS SP는 독특한 제품입니다! 모든 거래 지표에 액세스할 수 있는 새로운 "APOLLO PIPS" 지표와 "슈퍼 팩" 보너스를 받고 싶은 분들을 위한 것입니다! Apollo Pips PLUS SP 제품을 구매하면 실제로 Apollo Pips 표시기의 완전히 새로운 버전을 구매하게 됩니다. 이 버전의 지표에는 개선된 알고리즘과 사용하기 쉬운 매개변수가 있어 모든 시장 및 거래 스타일에서 지표를 사용할 수 있는 기회를 제공합니다. 이 제품의 구매자는 슈퍼 보너스로 다른 모든 표시기에 무료로 액세스할 수 있습니다! 내 모든 거래 도구에 액세스하고 싶었다면 이 제품이 당신에게 딱 맞습니다! :) 하지만 이것이 전부는 아닙니다! :) 이 제품의 모든 구매자는 또한 내 새로운 지표를 무료로 받을 자격이 있습니다! :) 새로운 거래 지표를 사용할 수 있게 되었는데, 귀하는 저의 특별한 "SUPER PACK" 평생 보너스
    Ultimate Index Advisor는 시장 움직임을 정확하게 분석하고 거래 기회를 동적으로 식별하도록 설계된 고급 도구입니다. 이 지표는 트렌드, 조정 및 반전을 최적화한 전략 조합을 기반으로 신호를 제공하여 다양한 거래 스타일에 적합합니다. 직관적인 인터페이스를 갖춘 Ultimate Index Advisor는 차트에서 보이는 화살표로 명확한 진입 및 이탈 지점을 강조하여 거래 결정에서 모호함을 제거합니다. 고급 기술 분석 전략을 활용하여 이 도구는 모든 시간대에 적합하며, 단기 또는 장기 거래를 선호하는 트레이더에게 유연성을 제공합니다. 주요 기능: 트렌드 및 반전의 자동 식별. 명확하고 읽기 쉬운 시각적 신호. 다양한 금융 시장 및 시간대에 적합. 사용자 거래 전략에 맞게 설정 가능. Ultimate Index Advisor가 명확한 신호와 고급 분석으로 거래 결정을 어떻게 지원하는지 직접 확인해보세요.
    Currency Strength Exotics
    Bernhard Schweigert
    4.87 (31)
    현재 20% 할인! 초보자 또는 전문가 트레이더를 위한 최고의 솔루션! 이 표시기는 Exotic Pairs Commodities, Indexes 또는 Futures와 같은 기호에 대한 통화 강도를 표시하는 데 특화되어 있습니다. 금, 은, 석유, DAX, US30, MXN, TRY, CNH 등의 진정한 통화 강도를 보여주기 위해 9번째 줄에 모든 기호를 추가할 수 있습니다. 이것은 독특하고 고품질이며 저렴한 거래 도구입니다. 우리는 많은 독점 기능과 새로운 공식을 통합했습니다. 새로운 추세 또는 스캘핑 기회의 정확한 트리거 포인트를 정확히 찾아낼 수 있기 때문에 거래가 어떻게 개선될지 상상해 보십시오. 사용 설명서: 여기를 클릭 https://www.mql5.com/en/blogs/post/708876 모든 시간대에 작동합니다. TREND를 빠르게 확인할 수 있습니다! 새로운 기본 알고리즘을 기반으로 설계되어 잠재적인 거래를 더욱 쉽게 식별하고 확인할 수 있습니다.
    Quantum Breakout Indicator PRO
    Bogdan Ion Puscasu
    4.96 (25)
    소개       Quantum Breakout PRO   , 브레이크아웃 존 거래 방식을 변화시키는 획기적인 MQL5 지표! 13년 이상의 거래 경험을 가진 숙련된 트레이더 팀이 개발한   Quantum Breakout PRO는   혁신적이고 역동적인 브레이크아웃 영역 전략으로 거래 여정을 새로운 차원으로 끌어올리도록 설계되었습니다. Quantum Breakout Indicator는 5개의 이익 목표 영역이 있는 브레이크아웃 영역의 신호 화살표와 브레이크아웃 상자를 기반으로 한 손절 제안을 제공합니다. 초보자 거래자와 전문 거래자 모두에게 적합합니다. Quantum EA 채널:       여기를 클릭하세요 MT5 버전 :   여기를 클릭하세요 중요한! 구매 후 설치 매뉴얼을 받으려면 개인 메시지를 보내주십시오. 추천: 기간: M15 통화쌍: GBPJPY, EURJPY, USDJPY,NZDUSD, XAUUSD 계정 유형: 스프레드가 매우 낮은 ECN, Ra
    트렌드 오실레이터: 부드럽고 신뢰할 수 있는 시장 트렌드 식별 트렌드 오실레이터는 트레이더가 트렌드 방향과 잠재적 반전 포인트를 정확하게 식별하는 데 도움을 주기 위해 설계된 MT4의 고급 지표입니다. 직관적인 시각적 표현을 통해 시장이 상승 추세인지 하락 추세인지를 명확하게 보여주어 분석을 단순화하고 차트 가독성을 높입니다. 다양한 시장 및 시간 프레임에 적합하여 여러 트레이딩 요구에 유연하게 대응할 수 있습니다. 트렌드 오실레이터의 주요 특징과 장점 단순화된 트렌드 시각화 : 트렌드 오실레이터는 라인의 색상을 변경하여 트렌드 움직임을 그래픽으로 나타냅니다. 파란색은 상승 추세를, 노란색은 하락 추세를 나타내어 트렌드를 즉시 명확하게 파악할 수 있습니다. 신뢰할 수 있는 반전 신호 : 고급 알고리즘을 통해 지표는 잠재적인 반전 포인트를 나타내는 색상의 화살표를 생성합니다. 녹색 화살표는 매수 포인트를, 빨간색 화살표는 매도 포인트를 나타내어 트레이더가 진입 또는 청산을 평가할 수
    Enigmera
    Ivan Stefanov
    5 (3)
    에니메라: 시장의 핵심 https://www.enigmera.com 소개 이 지표 및 트레이딩 시스템은 금융 시장에 대한 놀라운 접근 방식입니다. 에니메라는 프랙탈 주기를 사용하여 지지선과 저항선을 정확하게 계산합니다. 진정한 축적 단계를 보여주고 방향과 목표를 제시합니다.  추세에 있든 조정에 있든 작동하는 시스템입니다.  어떻게 작동하나요? 에니메라는 지지선/저항선, 목표선, 편차선의 세 가지 라인으로 구성됩니다. 이 시스템은 과거 데이터를 현재와 미래로 추정하는 일반적인 시장 지표와 달리 현재에 대한 완전한 그림을 제공합니다. 지지선 위에 있으면 실제 지지를 의미하고 저항선 위에 있으면 실제 저항을 의미합니다. 레벨이 깨지면 추세의 변화를 나타냅니다. 다시 그리지 않습니다. 시장이 지속적으로 진화함에 따라 에니메라는 평가 도구를 조정하여 전략을 정기적으로 수정합니다.   이를 통해 모든 시나리오를 철저히 평가할 수 있습니다. 이 시장 지표의 고유성은 분명하며 그 기
    All in One Trade
    Alexey Minkov
    4.48 (27)
    The All-in-One Trade Indicator (AOTI) determines daily targets for EURUSD, EURJPY, GBPUSD, USDCHF, EURGBP, EURCAD, EURAUD, AUDJPY, GBPAUD, GBPCAD, GBPCHF, GBPJPY, AUDUSD, and USDJPY. All other modules work with any trading instruments. The indicator includes various features, such as Double Channel trend direction, Price channel, MA Bands, Fibo levels, Climax Bar detection, and others. The AOTI indicator is based on several trading strategies, and created to simplify market analysis. All-in-One
    MetaBands M4
    Vahidreza Heidar Gholami
    5 (2)
    MetaBands uses powerful and unique algorithms to draw channels and detect trends so that it can provide traders with potential points for entering and exiting trades. It’s a channel indicator plus a powerful trend indicator. It includes different types of channels which can be merged to create new channels simply by using the input parameters. MetaBands uses all types of alerts to notify users about market events. Features Supports most of the channel algorithms Powerful trend detection algorith
    Prometheus Trade Engine is an indicator that combines price action, ratio based indicator with custom indicators& other lagging indicators to create this leading indicator that has a multi-timeframe approach to trading so that you are able to see what other timeframes are doing all in one chart and give you high probability trade setups to assist you to make a prediction on what is MOST likely to happen in the market going foward Chart Features 1. Reversal Zone It is the rectangular box on
    현재 20% 할인 ! 초보자 또는 전문가 트레이더를 위한 최고의 솔루션! 이 대시보드 소프트웨어는 28개의 통화 쌍에서 작동합니다. 2가지 주요 지표(Advanced Currency Strength 28 및 Advanced Currency Impulse)를 기반으로 합니다. 전체 Forex 시장에 대한 훌륭한 개요를 제공합니다. 고급 통화 강도 값, 통화 이동 속도 및 모든(9) 시간대의 28 Forex 쌍에 대한 신호를 보여줍니다. 추세 및/또는 스캘핑 기회를 정확히 파악하기 위해 차트의 단일 지표를 사용하여 전체 시장을 볼 수 있을 때 거래가 어떻게 개선될지 상상해 보십시오! 잠재적인 거래를 식별하고 확인하면서 강력한 통화와 약한 통화를 더욱 쉽게 식별할 수 있도록 이 지표에 기능을 내장했습니다. 이 표시기는 통화의 강세 또는 약세가 증가 또는 감소하는지 여부와 모든 시간대에서 수행되는 방식을 그래픽으로 보여줍니다. 추가된 새로운 기능은 현재 시장 조건 변화에 적
    거래 속도는 시장에서 대량 주문이 언제 어디서 누적되는지, 그리고 이로 인한 이점을 보여주는 최고 품질의 지표입니다. 매우 초기 단계에서 추세 변화를 감지합니다. 이는 지표이자 동시에 트레이딩 시스템입니다. 이 개념은 독특하고 수익성이 매우 높습니다. 외환에서 틱 볼륨은 거래량이라고 오해의 소지가 있습니다. 실제로는 단위 시간당 가격 변동으로, 사실상 거래 속도입니다. 이 지표는 외환에서 볼륨에 대한 개념을 완전히 수정하여 올바른 방식으로 논리적으로 정의하고이 논리를 적용하면 독특하고 정확한 최상위 수익성 도구가됩니다. 속도가 증가하면 더 큰 관심과 그에 상응하는 진입 및 출구의 신호입니다. 사용 방법: 이 지표는 시장에서 거래 속도를 측정하고 비교하기 때문에 가장 먼저해야 할 일은 다음과 같습니다.  이러한 비교를 할 기간을 선택합니다.  일반적으로 15일 전이 비교를 위한 좋은 출발점입니다.  인디케이터에 날짜를 입력하고 실행합니다.  30분 또는 1시간의 기간에서
    CyberZingFx Volume Plus
    Afsal Meerankutty
    4.93 (15)
    Advanced version of CyberZingFx Volume Plus, the ultimate MT4 indicator for traders seeking highly accurate buy and sell signals. With an additional strategy and price action dot signals that enhances its effectiveness, this indicator offers a superior trading experience for professionals and beginners alike. The CyberZingFx Volume Plus Advanced version combines the power of volume analysis and historical price data with an additional strategy, resulting in even more precise and reliable signals
    Up down v6T
    Guner Koca
    5 (2)
    Thise indicator is up down v6  comes with tradingwiev pinescript. purchased people, after installed on terminal ,contact me on mql5  to get BONUS  TradingView pinescript. up-down indicator is no repaint and works all pairs and lower than weekly time frames charts. it is suitable also 1 m charts for all pairs. and hold long way to signal. dont gives too many signals. when red histogram cross trigger line that is up signal.and price probably will down when blue histogram cross trigger line that
    이 지표는 실제 거래에 완벽한 자동 파동 분석 지표입니다! 사례... 참고:   웨이브 그레이딩에 서양식 이름을 사용하는 데 익숙하지 않습니다. Tang Lun(Tang Zhong Shuo Zen)의 명명 규칙의 영향으로 기본 웨이브를   펜   으로 명명하고 2차 웨이브 밴드를   세그먼트   로 명명했습니다. 동시에, 세그먼트에는 추세 방향이 있습니다.   주요 추세 세그먼트에는   이름이 지정되지만(이 이름 지정 방법은 향후 노트에서 사용됩니다. 먼저 말씀드리겠습니다.) 알고리즘은 굴곡 이론과 거의 관련이 없으므로 그렇게 해서는 안 됩니다. 이는 나의 시장 분석을   통해 요약된 끊임없이 변화하고 복잡한 운영 규칙을   반영합니다. 밴드는 더 이상 사람마다 다르지 않도록 표준화되고 정의되었습니다. 인위적인 간섭의 드로잉 방법은 시장 진입을 엄격하게 분석하는 데 핵심적인 역할을 합니다. 이 지표를 사용하는 것은 거래 인터페이스의 미학을 개선하고 원래의 K-line 거
    Gold Channel XAUUSD
    Paulo Rocha
    5 (4)
    Gold Channel is a volatility-based indicator, developed with a specific timing algorithm for the XAUUSD pair, which consists of finding possible corrections in the market. This indicator shows two outer lines, an inner line (retracement line) and an arrow sign, where the theory of the channel is to help identify overbought and oversold conditions in the market. The market price will generally fall between the boundaries of the channel. If prices touch or move outside the channel it is a tra
    The Stochastic Basket Currency Strenght  brings the Stochastic indicator to a new level.  Expanding the boundaries of TimeFrames and mono-currency analysis, the SBCS take the movements of each currency that composes the cross and confront them in the whole basket of 7 crosses.  The indicator works with any combination of AUD, CAD, CHF, EUR, GBP, JPY, NZD, USD pairs and with full automation takes in account every stochastic value (main line) for the selected Time Frame.  After that, the indicator
    ON Trade Waves Patterns Harmonic Elliot Wolfe를 소개합니다. 이는 수동 및 자동 방법을 사용하여 다양한 시장 패턴을 감지하기 위해 개발된 고급 지표입니다. 다음은 그 작동 방식입니다: 조화적 패턴: 이 지표는 차트에 나타나는 조화적 패턴을 식별할 수 있습니다. 이러한 패턴은 Scott Carney의 "Harmonic Trading vol 1 및 2"에서 설명한 것처럼 조화적 거래 이론을 연습하는 트레이더에게 중요합니다. 수동으로 그리든 자동 감지를 사용하든 ON Trade Waves Patterns가 도움을 줄 것입니다. 컨트롤 패널: 이 지표에는 사용자 친화적인 컨트롤 패널이 있습니다. 차트 및 시간 프레임 설정을 저장하여 다양한 구성 간에 쉽게 전환할 수 있습니다. 차트 공간을 최대화하려면 최소화할 수도 있습니다. 다른 분석 도구를 사용하는 것을 선호하는 경우 닫기 버튼을 클릭하여 모든 지표 데이터를 숨길 수 있습니다. 템플릿 저장: 설정을 사
    ACB Breakout Arrows
    KEENBASE SOFTWARE SOLUTIONS
    4.15 (34)
    The ACB Breakout Arrows indicator provides a crucial entry signal in the market by detecting a special breakout pattern. The indicator constantly scans the chart for a settling momentum in one direction and provide the accurate entry signal right before the major move.  Get multi-symbol and multi-timeframe scanner from here - Scanner for ACB Breakout Arrows MT4 Key features Stoploss and Take Profit levels are provided by the indicator. Comes with a MTF Scanner dashboard which tracks the brea
    Quantum Trend Sniper Indicator MT4
    Bogdan Ion Puscasu
    4.65 (37)
    소개       Quantum Trend Sniper Indicator는   추세 반전을 식별하고 거래하는 방식을 변화시키는 획기적인 MQL5 지표입니다! 13년 이상의 거래 경험을 가진 숙련된 트레이더 팀이 개발한       Quantum Trend Sniper 표시기       매우 높은 정확도로 추세 반전을 식별하는 혁신적인 방법으로 거래 여정을 새로운 차원으로 끌어올리도록 설계되었습니다. ***Quantum Trend Sniper Indicator를 구입하면 Quantum Breakout Indicator를 무료로 받을 수 있습니다!*** Quantum Trend Sniper Indicator는 추세 반전을 식별하고 세 가지 이익실현 수준을 제안할 때 경고, 신호 화살표를 제공합니다. 초보자 거래자와 전문 거래자 모두에게 적합합니다. Quantum EA 채널:       여기를 클릭하세요 MT5 버전:       여기를 클릭하세요
    (Currently 30% OFF) Before reading the description of this indicator, I just want to introduce to you following concept Moving Average Line - Typical moving average which is based on one chart alone.  Currency Strength Line - The moving average of a certain pair in which the strength is based on 28 pairs. Can be said as the real moving average line. Moving Average indeed is one of the most popular indicator which almost every trader use. Currency Strength Meter is also a trend indicator whic
    Best Currency Strength Indicator
    Tumelo Patrick Rakotsoane
    4.59 (46)
    Advanced Currency Strength Indicator The Advanced Divergence Currency Strength Indicator. Not only it breaks down all 28 forex currency pairs and calculates the strength of individual currencies across all timeframes , but, You'll be analyzing the WHOLE forex market in 1 window (In just 1 minute) . This indicator is very powerful because it reveals the true movements of the market.  It is highly recommended to  analyze charts knowing the performance of individual currencies or the countries ec
    Pair Trading Station MT4
    Young Ho Seo
    3.67 (3)
    How to use Pair Trading Station Pair Trading Station is recommended for H1 time frame and you can use it for any currency pairs. To generate buy and sell signal, follow few steps below to apply Pair Trading Station to your MetaTrader terminal. When you load Pair Trading Station on your chart, Pair Trading station will assess available historical data in your MetaTrader platforms for each currency pair. On your chart, the amount of historical data available will be displayed for each currency pai
    Bomb Bank Signal
    Igor Pereira Calil
    5 (1)
    폭탄 은행 신호: MetaTrader 4의 신뢰도 지표 Bomb Bank Signal은 금융 시장에서 가장 관련성이 높은 추세를 식별하도록 설계된 MetaTrader 4의 강력한 지표입니다. 움직임을 정확하게 예측하는 도구를 찾고 있다면 Bomb Bank가 바로 여러분에게 필요한 동맹입니다. 작동 방식: 이 지표는 거래량 분석, 양초 종가, 대칭 추세 등 세 가지 방법을 결합하여 매수 및 매도 기회를 감지하고 신호를 보냅니다. Bomb Bank는 매수 기회를 포착할 때는 '폭탄'과 같고, 매도 신호를 감지할 때에는 '해골'과 같습니다. 폭탄 은행은 왜 다른가요? 완전한 신뢰성: 폭탄 은행 신호는 신호를 제거하지 않습니다. 일단 신호가 발행되면 그 신호는 계속 유지되므로 기회를 절대 놓치지 않습니다. 극도의 정확성: Bomb Bank는 잘못된 신호를 보내지 않습니다. 시장이 발전함에 따라 조정하면서 실시간으로 업데이트하지만 이전 신호의 투명성은 유지합니다. 실시간
    제작자의 제품 더 보기
    Blahtech Candle Timer MT5
    Blahtech Limited
    4.82 (107)
    Over 100,000 users on MT4 and MT5 Blahtech Candle Timer displays the remaining time before the current bar closes and a new bar forms. It can be used for time management Links [  Install  |  Update  |  Training  ] Feature Highlights The only candle timer on MT5 with no stutter and no lag S electable Location Tracks server time not local time Multiple colour Schemes Configurable Text Customisable alerts and messages Optimised to reduce CPU usage Input Parameters Text Location - Beside / Upper L
    FREE
    Blahtech Market Profile MT5
    Blahtech Limited
    5 (9)
    Was: $249  Now: $99   Market Profile defines a number of day types that can help the trader to determine market behaviour. A key feature is the Value Area, representing the range of price action where 70% of trading took place. Understanding the Value Area can give traders valuable insight into market direction and establish the higher odds trade. It is an excellent addition to any system you may be using. Inspired by Jim Dalton’s book “Mind Over Markets”, this indicator is designed to suit the
    Blahtech Daily Range MT5
    Blahtech Limited
    5 (1)
    Was: $99  Now: $34   Blahtech Daily Range indicator displays the average daily range alongside the individual session ranges. Using the daily open price as a reference the indicator shows fixed range and dynamic range targets as lines on the charts. These lines clearly show when the average range has been exhausted. Daily and session ranges can be useful for confirming entries or setting targets and is an excellent odds enhancer for many trading systems. Links [  Documentation   |   Install  | 
    Blahtech Supply Demand MT5
    Blahtech Limited
    4.54 (13)
    Was: $299  Now: $99   Supply Demand uses previous price action to identify potential imbalances between buyers and sellers. The key is to identify the better odds zones, not just the untouched ones. Blahtech Supply Demand indicator delivers functionality previously unavailable on any trading platform. This 4-in-1 indicator not only highlights the higher probability zones using a multi-criteria strength engine, but also combines it with multi-timeframe trend analysis, previously confirmed swings
    Blahtech Candle Timer
    Blahtech Limited
    4.84 (93)
    Over 100,000 users on MT4 and MT5 Blahtech Candle Timer displays the remaining time before the current bar closes and a new bar forms. It can be used for time management Links [  Install  |  Update  |  Training  ] Feature Highlights The only candle timer on MT4 with no stutter and no lag S electable Location Tracks server time not local time Multiple colour Schemes Configurable Text Customisable alerts and messages Optimised to reduce CPU usage Input Parameters Text Location   - Beside / Upper
    FREE
    Was: $49    Now: $34  Blahtech Better Volume provides an enhanced version of the vertical volume bars. Each bar is compared to the previous 20 bars. Depending on its volume, range and volume density it will be assigned a state and colour. Low Volume – Minimum volume High Churn   – Significant volume with limited movement Climax Neutral –   High volume with unclear direction Climax Up   – High volume with bullish direction Climax Dn   – High volume with bearish direction Climax Churn – High vol
    Blahtech VWAP MT5
    Blahtech Limited
    5 (1)
    Was: $69  Now: $34   Blahtech VWAP - Volume Weighted Average Price (VWAP) is the ratio of price to total volume. It provides an average price over a specified time interval.  Links [  Install  |  Update  |  Documentation   ] Feature Highlights Configurable VWAP Line Sessions, intervals, anchored or continuous Previous day settlement line Standard Deviation bands Alerts at bar close or real time Automatic Broker or Tick volumes Significantly reduced CPU usage Input Parameters Expert Advisor
    Blahtech Market Profile
    Blahtech Limited
    4.56 (16)
    Was: $249  Now: $99   Market Profile defines a number of day types that can help the trader to determine market behaviour. A key feature is the Value Area, representing the range of price action where 70% of trading took place. Understanding the Value Area can give traders valuable insight into market direction and establish the higher odds trade. It is an excellent addition to any system you may be using. Blahtech Limited presents their Market Profile indicator for the MetaTrader community. Ins
    Blahtech Moving Average MT5
    Blahtech Limited
    5 (3)
    Blahtech Moving Average indicator is a multitimeframe version of the standard Moving Average indicator. It is also enhanced with customisable alerts, period breaks and other configuration options. The 50 day and 200 day moving averages are widely followed by investors and traders, with breaks above and below the MA lines considered to be signals of interest. Links [  Install  |  Update  |   Training   |   All Products  ] Feature Highlights Up to three timeframes Configurable calculation variab
    FREE
    Blahtech Moving Average
    Blahtech Limited
    5 (5)
    Blahtech Moving Average indicator is a multitimeframe version of the standard Moving Average indicator. It is also enhanced with customisable alerts, period breaks and other configuration options. The 50 day and 200 day moving averages are widely followed by investors and traders, with breaks above and below the MA lines considered to be signals of interest. Links [  Install  |  Update  |   Training   |   All Products  ] Feature Highlights Up to three timeframes Configurable calculation variab
    FREE
    Blahtech VWAP
    Blahtech Limited
    5 (2)
    Was: $69    Now: $34   Blahtech VWAP - Volume Weighted Average Price (VWAP) is the ratio of price to total volume. It provides an average price over a specified time interval.  Links [  Install  |  Update  |  Documentation   ] Feature Highlights Configurable VWAP Line Sessions, intervals, anchored or continuous Previous day settlement line Standard Deviation bands Alerts at bar close or real time Automatic Broker or Tick volumes Significantly reduced CPU usage Input Parameters Expert Advis
    Blahtech Fisher Transform indicator is an oscillator that displays overbought and oversold locations on the chart. The Fisher Transform algorithm transforms prices with any distribution shape into a normal distribution. The end result is a curve with sharp turning points that may help to identify bullish or bearish trends. Fisher Transform values exceeding 1.66 on the daily chart are considered to be good areas for reversal trades. Links [  Install  |  Update  |  Training   |  All Products  ]
    Blahtech Fisher Transform
    Blahtech Limited
    5 (1)
    Blahtech Fisher Transform indicator is an oscillator that displays overbought and oversold locations on the chart. The Fisher Transform algorithm transforms prices with any distribution shape into a normal distribution. The end result is a curve with sharp turning points that may help to identify bullish or bearish trends. Fisher Transform values exceeding 1.66 on the daily chart are considered to be good areas for reversal trades. Links [  Install  |  Update  |  Training   |  All Products  ]
    Blahtech Daily Range
    Blahtech Limited
    4.8 (5)
    Was: $99  Now: $34   Blahtech Daily Range indicator displays the average daily range alongside the individual session ranges. Using the daily open price as a reference the indicator shows fixed range and dynamic range targets as lines on the charts. These lines clearly show when the average range has been exhausted. Daily and session ranges can be useful for confirming entries or setting targets and is an excellent odds enhancer for many trading systems. Links [  Documentation   |   Install  |
    Blahtech Better Volume
    Blahtech Limited
    3 (2)
    Was: $49    Now: $34  Blahtech Better Volume provides an enhanced version of the vertical volume bars. Each bar is compared to the previous 20 bars. Depending on its volume, range and volume density it will be assigned a state and colour. Low Volume – Minimum volume High Churn   – Significant volume with limited movement Climax Neutral –   High volume with unclear direction Climax Up   – High volume with bullish direction Climax Dn   – High volume with bearish direction Climax Churn – High vol
    필터:
    Man xola Man xola
    77
    Man xola Man xola 2023.03.23 05:04 
     

    One the best

    Nerijus1982
    428
    Nerijus1982 2022.08.08 15:58 
     

    On backtesting looks good.But in real conditions levels repainting and disappears even when they’re not broken.You just can’t trust them.

    Blahtech Limited
    143811
    개발자의 답변 James Cater 2022.09.27 14:38
    To reduce clutter, narrow levels formed from just two candles don't get displayed as old zones. If you want to display these levels set the parameter "Other Parameters / Min Bars For Old Levels" => 2
    Zakarias
    48
    Zakarias 2021.11.03 13:05 
     

    Awesome, i like the idea and its running very very good

    David Cooper
    38
    David Cooper 2021.08.03 03:32 
     

    A leading indicator very well done. Remember to wait for price to come to you.

    YHW1022221880
    170
    YHW1022221880 2021.07.27 12:19 
     

    Good supply and demand indicators

    efecetinel
    111
    efecetinel 2021.05.05 20:16 
     

    Perfect indicator, perfect owner. Thank you James

    Nicolas Dobrovsky
    814
    Nicolas Dobrovsky 2021.03.07 10:55 
     

    The best SR indicator on the market. It is necessary to set the indicator according to the trading style. I spent a lot of time testing different variants and settings. Everyone has to find what suits them.

    Edit: Backtest mode does not work properly, sometimes repaint. You always need to use the previous candle, otherwise you will have very different results in the real account.

    Frank Paetsch
    7274
    Frank Paetsch 2021.03.03 12:47 
     

    Good! thank you

    Kavindran Elangoven
    641
    Kavindran Elangoven 2021.03.01 02:55 
     

    for a person who doesnt know how to trade, this indicator wont be helpful at all, but if you are a experience trader in the markets but sometimes are unconfident about the levels you are watching, and with the knowledge you already have about the markets to develop a bias on your trading day. this can be a game changer

    DilliBab
    19
    DilliBab 2021.02.23 15:05 
     

    Hi Friends this indicator am using last one day ,can you tell me how to use this, where we go short and long.please explain me anybody friends...+91 9952104997 my whatsapp number

    njs7891
    124
    njs7891 2021.01.04 16:30 
     

    The levels this indicator shows are very good and make it easy to see where price is likely to react from. I like the hotkey features to cycle between higher timeframe levels as you can quickly spot levels you may have missed when zoomed into a lower timeframe. The backtesting feature is also great and very useful. Good support also. Great indicator.

    Ng Choong Huan
    229
    Ng Choong Huan 2020.12.09 07:04 
     

    This is perfect indicator S/D which auto calculate a lot of data (score or those complicate manual job). Well done. Love it so much

    finisheroffaith
    24
    finisheroffaith 2020.10.27 20:43 
     

    For those who say a free Supply and Demand indicator is just as good as this one. My first response would be have you bought this one, because there is no free supply and demand indicator that even comes remotely close to this indicator that I know of. This indicator is absolutely awesome. The features are outstanding. It is not' your standard free supply and demand indicator.I fill it is money well spent. If you are not educated with the supply and demand method that may change your perception of the worth of the indicator. I say don't buy something you are not educated on.I also say don't let someone make an evaluation for you they are not educated on.

    T3chAddict
    64
    T3chAddict 2020.09.17 15:11 
     

    Fast and reliable indicator. Not 'heavy' on the system. Apart from not wasting time to plot my own SD zones the back-test mode is super handy.

    Martin Freiherr Von Mirbach Doring
    513
     

    Unfortunately not a good indicator. Too bad about the money. My free indicator, which I used for a long time, is much better and more reliable.

    hashmi007
    100
    hashmi007 2020.06.10 19:11 
     

    Excellent indicator.I use it with my Bollinger/MA crossover strategy and blahtech provides me with accurate Target zones.great tool.

    Bradley Bosworth
    335
    Bradley Bosworth 2020.01.14 06:32 
     

    Awesome Indicator, but I'm trying to install on my computer (same one I originally installed) and it claims I've used all my "activations" when I've had to reinstall mt4 multiple times. I guess that counts as an activation even though it's the same PC?

    hkarram
    288
    hkarram 2019.10.20 15:29 
     

    Excellent indicator ..... a must for any supply demand trader ...... the backtest mode is a great tool ...... thanks for the developers

    Trader mql5
    1265
    Trader mql5 2019.10.11 02:01 
     

    The free S/D indicators are good enough for amateur traders. But for fine-tuning to my professional needs this is a good start (lol - always give space for future improvements). Love it!!

    anonymouse73
    24
    anonymouse73 2019.04.29 20:34 
     

    사용자가 평가에 대한 코멘트를 남기지 않았습니다

    12
    리뷰 답변
    버전 4.3 2024.07.02
    - Keyboard - Fix Ctrl Click issue
    버전 4.2 2024.04.09
    - Keyboard - Fix Ctrl and Shift Click mappings on MT5
    버전 4.1 2024.01.11
    - Solo Zones - Use "Zone Line Width 1" when setting SoloZone Line Width
    - Keyboard - Fix Ctrl and Shift Click mappings on MT5
    - Alerts - Add "Reverse Candle From Zone" alerts
    - Alerts - Update parameter names
    버전 4.0 2022.05.12
    - Overall Trend - Add "Three In A Row" option to highlight trend when all three timeframe trends align
    - Hotkeys - Zone Visibility - With Trend - Hide zones with unknown trend status
    - Alerts - Zone Visibility - Alow user to filter visibility independent of the display hotkey setting
    버전 3.9 2022.04.11
    - New Alerts - Stop excessive alerts being generated when multiple timeframes are active
    버전 3.8 2022.02.07
    - Block invalid alerts that were triggered when broker resets data feed
    - Improve level tooltip texts to always include nested info
    - Summary Panel - Add parameter Trend Show Consolidation Dots
    - Summary Panel - Rename parameter Engulfings - Stop Loss to Engulfings - Viable Size
    버전 3.7 2021.05.05
    Enhancements
    - Timeframes - Add new timeframe options - Current Plus One / Two / Three
    - Profiles - Add parameter "Clear Hotkeys On Terminal Close" to improve profile switching on MT5
    - Offline Charts - Add support for offline charts and backtest tools with missing market data and unsynced current time

    Fixes
    - Summary Panel - Q Points - Improve accuracy of real time updates
    - Summary Panel - Q Points - Ensure text is positioned correctly in the center of the box
    - Trend Change - Incremental - Check that BarNum >= MinBarsOldZones
    - Mouse Events - Keep CHART_EVENT_MOUSE_MOVE enabled if other indicators are waiting on mouse events
    버전 3.6 2021.04.20
    Enhancements
    - MT5 - Add support for extended timeframes
    - Trend Worm - Add option to display Trend Worm and/or Consolidation Worm on the chart
    (Due to a platform issue, MT5 users may need to re-attach the indicator to see the Trend Worm)

    Performance
    - Clear Hotkey - Improve performance of clear chart calls
    - Redraw - Remove ObjectsDeleteAll calls that slow other indicators with many objects
    버전 3.5 2021.04.02
    Fixes
    - Summary SupDem - Apply Filters to SupDem column
    - iCustom - Apply Filters to iCustom buffers
    - iCustom - Improve Blahtech Expert Advisor Examples
    - Alerts - Add MinBarsLevel and PriceAway filters to alerts
    - Overall Move - Fix edge case where Overall Move wasn't being calculated correctly
    버전 3.4 2021.03.24
    Enhancements
    - Enable filters whenever an individual filter is changed in the GUI
    - iCustom - Refactor EA code examples into class to support cleaner multiple instances

    Fixes
    - Summary SupDem - Improve highlighting of overlapped zones
    - Consolidations - Fix edge case when near MaxBars
    - Allow user to configure Timeframes 1-4 in any order
    - Allow experts to operate on higher timeframes than the current chart period
    - Change format of diff files to support iCustom development
    - Only populate iCustom buffers if they are enabled and used
    - Change position of Overall Move filter to the top half of the GUI
    버전 3.3 2021.03.08
    Enhancements
    - Summary Trend - Display dot next to the trend direction when recent bars are consolidating
    - Filters - Add Max Levels filter to allow the user to restrict the number of levels on the chart
    - Zone Highlight - Add parameter to change highlighting mode (None/Strength/Untouched)
    - Parameters - Write simple list of changed parameters to experts log when Ctrl+Q keys are pressed
    - Parameters - Create detailed report of changed parameters in Files/Blahtech directory to assist users and support

    Fixes
    - Q Points - Add Min Risk Reward parameter
    - Trend Change - Add Min Range and rename Min Risk Reward parameters
    - Overall Trend Alerts - Print all three timeframe directions in alert message
    - Summary SupDem - Improve highlighting accuracy with overlapped zones
    - Old Zones - Enable detection of old zones with just two bars
    - Consolidation - Fix edge case in consolidation zones detection
    - Hotkeys - Revert regression from 3.1 release where [ and ] were swapped round
    - Expert Advisor Mode - Change to a single option named "Reserved For iCustom Calls"
    버전 3.2 2021.01.20
    Enhancements
    - Alerts - Add parameter "Filter Nested (Levels)" to control raising alerts for nested zones only
    - Alerts - Add parameter "Trigger Alerts Early" to trigger touch/break alerts N points before the level
    - Hotkey Panel - Add "Alerts Nest" button to allow user to modify the nested zone filter from the GUI
    - Summary - Alerts panel - Add icon next to title to show "Trigger Early Alerts" points value
    - Summary - Alerts panel - Improve alerts icon tooltips
    - Touches - Increase accuracy of Touches and add optional Touch/Untouch points parameters
    - Info - Add parameter to control the precision of the {lots1} substitution string
    - Info - Add a second user custom format string

    Fixes
    - Alerts - Fix edge case where duplicate alerts could be raised
    - Alerts - Remove overlaps from Retouch alerts and apply filters to New alerts
    - Alerts - Don't raise alerts for levels hidden from display by the "Zone Visibility" parameter
    - Alerts - Improve text format, add bid price and number of touches
    - Trend Change - Modify trend change parameter to OVERLAP_ALL to improve consistency of trend reversals
    - Summary Panel - Improve accuracy of summary panel when price retraces from touched levels
    - Summary Panel - Optimise summary panel redraw to compensate for increased accuracy
    - HotKey Panel - Adjust panel Y location when position changed to Bottom left/right
    버전 3.1 2019.10.17
    - Enable left mouse click actions on Hotkey panel when keys have been reserved
    버전 3.0 2019.10.09
    Enhancements
    - Add a third mode to the Summary panel GUI to control all alerts
    - Alow user to set individual alert timeframes for Trend, Engulfings, QPoints and Levels
    - Allow M30,H4,D1 as well as 1,2,3 when setting alerts timeframe parameters
    - Enable Summary Timeframe Bubble Numbers by default
    - Add bubble numbers to QPoints and SupDem columns in the Summary panel
    - Add option to adjust the zone start bar of a level to the begining of a consolidation
    - Add Timeframe hints to the TF section of the Hotkey panel
    - Add {lots3} option to Info format

    Fixes
    - Change default colour of QPoint 2 from MediumOrchid to PaleVoiletRed
    - Change Invert Style and colour parameters to be more intuitive
    - Change text colour of oversized Q Points on the chart to Gray
    - Change Summary heading from TimeF to Time
    - Improve the behaviour of the Q Points hotkeys
    - Modify all lines drawn by the indicator to be unselectable
    - Include first bar in search for max move away of zones and Q Points
    - Reset hotkey settings when indicator is removed from chart or chart is closed
    - Only call TerminalInfoInteger to get ctrl status when key pressed or object clicked
    버전 2.9 2019.07.18
    Fix issue when backtesting beyond Max Bars
    버전 2.8 2019.06.19
    Enhancements
    - Add options to draw multi timeframe Q Points on the chart
    - Add GUI tab within HUD panel for control of filter parameters
    - Add extra filters for Nested Levels, Zone Size and Min Price Away
    - Change default values for live filters to disabled
    - Add option to choose method for Zone Height calculation - Default/Whole Body/Entire Candle
    - Add parameters to limit zone height "Zone Height Min" and "Zone Height Max"
    - Add iCustom Buffers for QPoint 1 Top Bar and QPoint 1 Bot Bar
    - Add option to display Total Move in custom format
    - Left clicking any description in the Hud Panel now resets the value back to its input parameter version

    Fixes
    - Change defaults to display more features on chart at startup
    - Check UserTickSize to stop divide by zero error
    - Check for empty iCustom buffer
    버전 2.7 2018.05.30
    Enhancements
    - Option to disable highlighting of Strong Zones
    - Option to use Current Timeframe only for Overall Trend
    - Parameter to change corner anchor of Summary Display
    - Added Sup/Dem button to show only supplies or demands
    - Added filter for number of retouches
    - Added filter for levels that were formed by engulfing pattern
    - Added filter for max price away
    - Added filter for age of old zones in bars
    - Support alerts for trend changes
    - Support alerts for overall trend changes
    버전 2.5 2017.08.29
    Enhancements
    - Support alerts for QPoint touches and breaks
    - Support alerts for up to 3 timeframes
    - Support inverted zone styles for the multi timeframe display
    - Remember hotkey states when restarting terminal
    - Support iCustom calls with 64+ parameters by using a set file

    Changes
    - Add tooltips to nested zone graphics
    - Add reserved keys parameter to prevent clashes with other products
    버전 2.2 2017.04.06
    Enhancements
    - Support additional timeframes
    - Support alerts for engulfings
    - Draw zones one bar back if the conterminous line originates there
    - Changed colour and font of QPoints label when range greater than 15x average size
    - Separated old and active filters to simplify usage
    - Added advanced iCustom buffers for timeframes two and three
    - Added second demo mode to show extra timeframes
    = Summary Panel
    - Support clicking on timeframe values to show/hide zones
    - Support clicking on QPoint values to change focus
    - Disabled highlighting of QPoint value in pink/blue when range is less than 15x average range
    - Modified highlighting of SupDem values to only use pink/blue
    = Hotkeys
    - Reversed the order of hotkey changes when "Shift" key is pressed
    - Nudge both start and end of zones one bar forward when "X" key is pressed

    Fixes
    - Remember the QPoint timeframe set by the user when switching chart timeframes
    - Fixed the average bar size to match version 1.0 values (regression bug)
    - Rebuild with latest compiler for MetaTrader platform changes
    - Changed all global variables to be constant expressions
    버전 2.1 2017.01.19
    Fixes
    - Resolved issues with iCustom calls

    Performance
    - Reduced overhead each tick to optimise Expert Advisor performance
    - Added Expert Advisor mode to skip creation and drawing of objects
    버전 2.0 2016.12.09
    New Features
    - Alerts - User customisable
    - Engulfing detector - Multi-timeframe
    - Filters - User configurable visibility filters
    - Old Zones - Choice of broken levels or trend changes
    - Nested Zones - Highlight levels that are nested within higher timeframe zones
    - iCustom - Add buffers for developers

    Enhancements
    - Info - Add bubble scores
    - Scores - Normalise with-trend scores so they are always out of 8
    - Timeframes - Change mappings for M1 to M1/M5/M30
    - Strength Engine Mode - Allow user to relax the criteria for a strong zone
    - Calc Mode - Add option to disable incremental calculations
    - Demo Mode - Allow user to switch between default and demo settings
    = Summary display:
    - Show icons when filters are active
    - Highlight "extended" trend in deeper colour
    - Support clicking then dragging panel to new location
    = Hotkey display:
    - Add verbose display
    - Allow user to change value by clicking on the rows
    - Support clicking then dragging panel to new location
    - Highlight values that have changed from input parameter settings

    Fixes
    - Summary - Do not highlight countertrend levels when all three trends align
    - Scores - Change so the user enters 0-8 rather than 0.0-1.0 for the strong zone scores
    - Trend - Support DBD levels changing trend
    - Hotkeys - Update position when window height is changed
    - Backtest - Use TimeLocal for backtest expire so it works when market is closed
    - Reset - Force clear and redraw of all objects on Reset

    Architecture
    - Candle parser - Rewrite candle parse to enable old zones

    Performance
    - Implement incremental calculations to reduce CPU usage
    - Only refresh each tick if next level has been touched or broken
    - Only redraw Hotkey display if chart width has changed

    New Hotkeys
    - "9" - Demo mode
    - "=" - Strength Mode
    - "]" - Filters - All Zones
    - "[" - Filters - Old Zones
    - ";" - Old Zones
    - "'" - Old Zones Style
    - "#" - Nested Zones

    Developers and parameters
    - Developers - Twenty five iCustom buffers
    - Parameters - Fifty extra parameters to control new features
    - See documentation for details http://www.blahtech.co.uk/supplydemand
    버전 1.1 2016.04.12
    - Bug Fix : Chart Zones - Hotkey "X" wasn't working on MN1 timeframe
    - Enhancement : Chart Zones - Add new Hotkey "Z" - Zone style (Applies to solo timeframe only)
    - Enhancement : Summary View - Highlight Active QPoint and differentiate between in the middle (---) and no QPoints ( )
    - Enhancement : Summary View - Change overall trend to use "Two Adjacent" rather than "Best Of Three"
    - Enhancement : Summary View - Improve Trend detection when we bust the top
    - Enhancement : Summary View - Improve SupDem highlighting to focus on QPoints as well as Trend
    - Enhancement : Summary View - Add Input parameter - Highlight SupDem in QPoint - Level Strength
    - Enhancement : Summary View - Shift text right one space when in full mode
    - Enhancement : Daylight Savings - UseDaylightSavings parameter - Change default to true
    - Enhancement : High Res Displays - WindowsDesktopScaling - Add parameter to support desktop scaling for 4K and other high res screens
    - Performance : Backtest Mode - Do not recalculate every tick when in backtest mode