Chart Spotter
- 지표
- Kenneth Berry Cunningham
- 버전: 1.0
- 활성화: 7
Chart Spotter – 궁극의 하이라이팅 및 알림 도구
Chart Spotter로 거래 전략의 모든 잠재력을 최대한 발휘하세요! 세션, RSI 수준, ATR 수준, 트렌드에 대해 실시간 하이라이팅 및 즉각적인 알림을 제공하는 올인원 도구입니다.
주요 기능
-
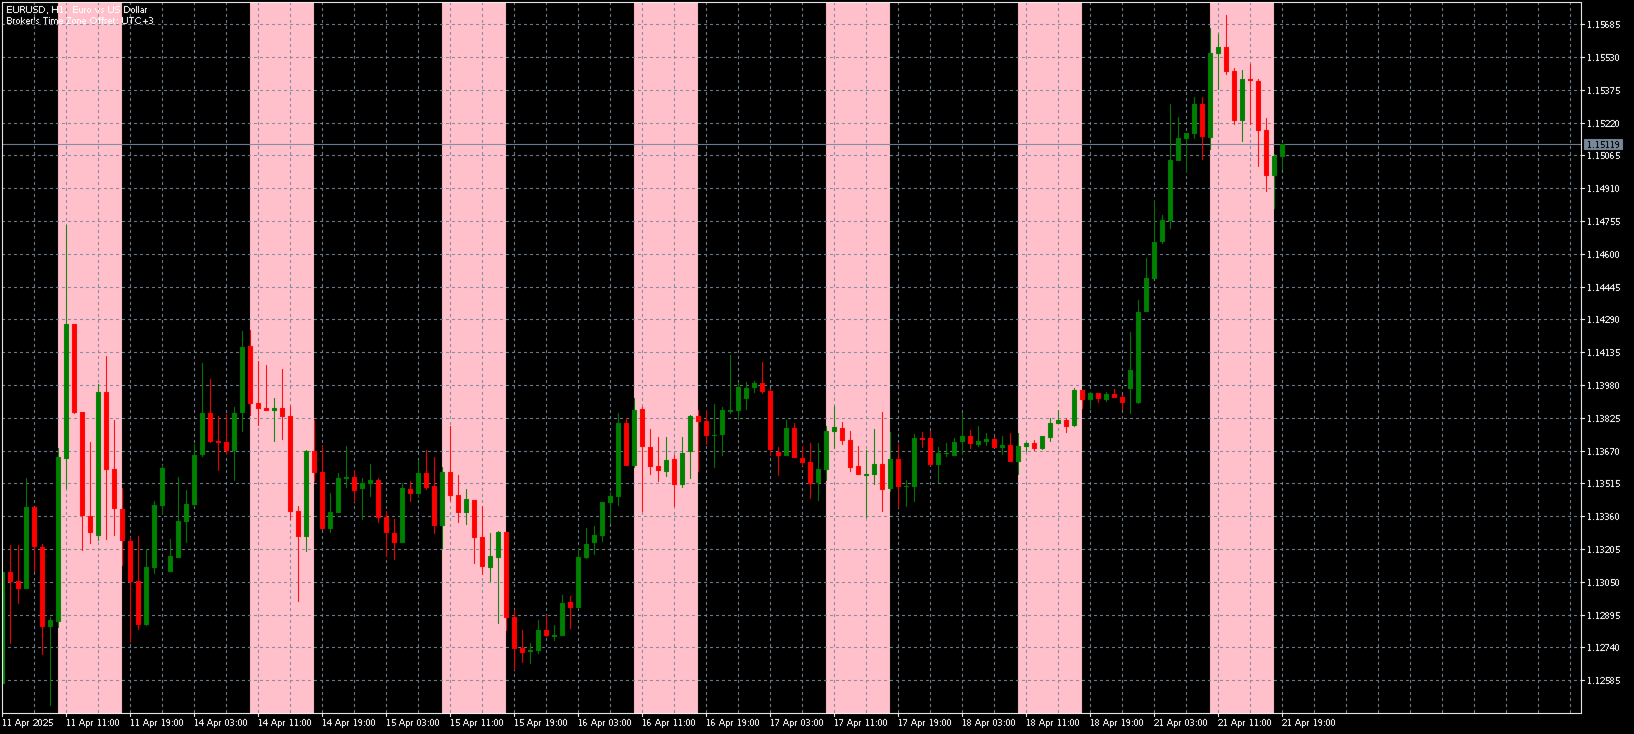
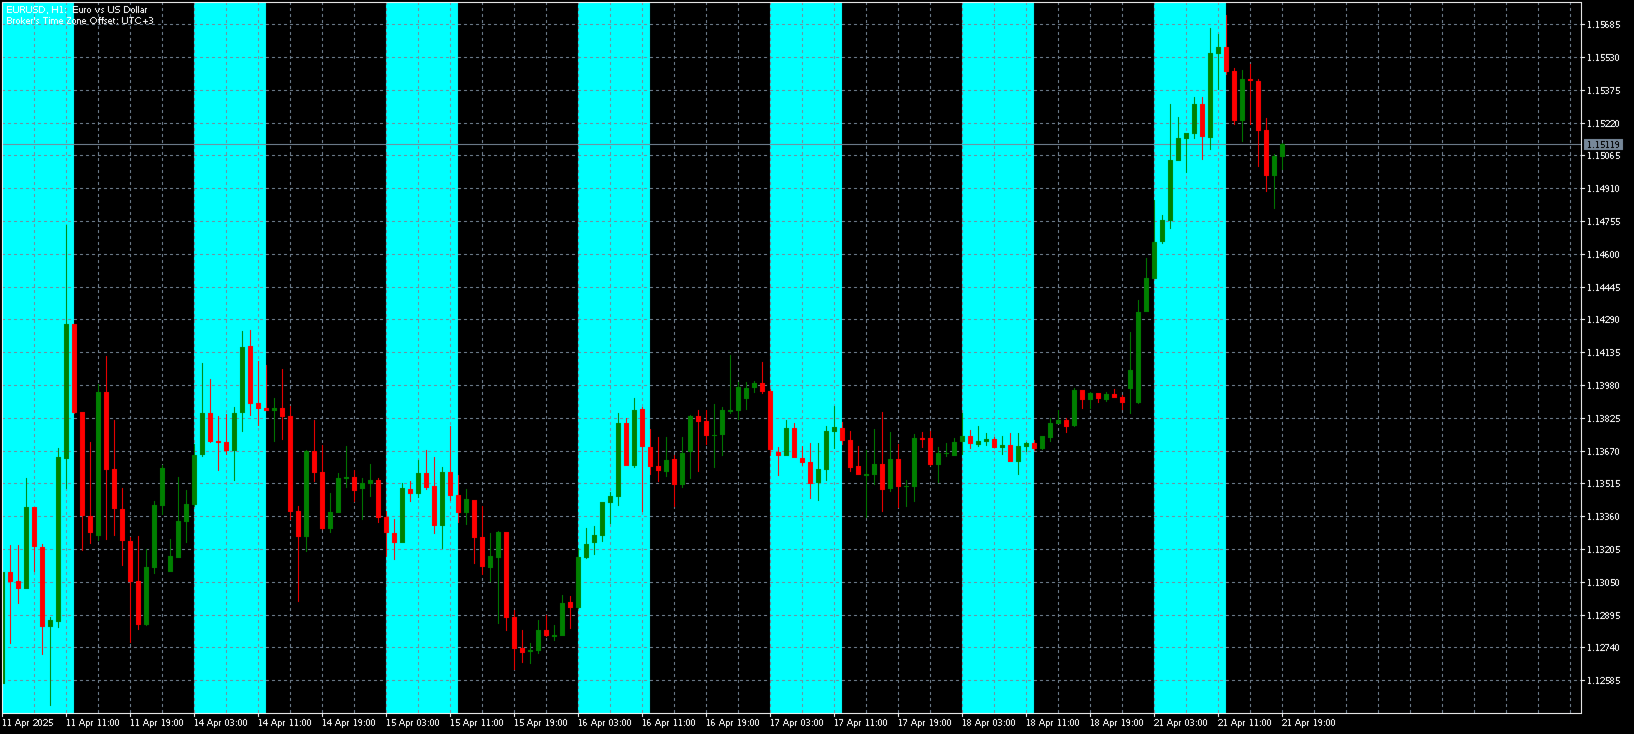
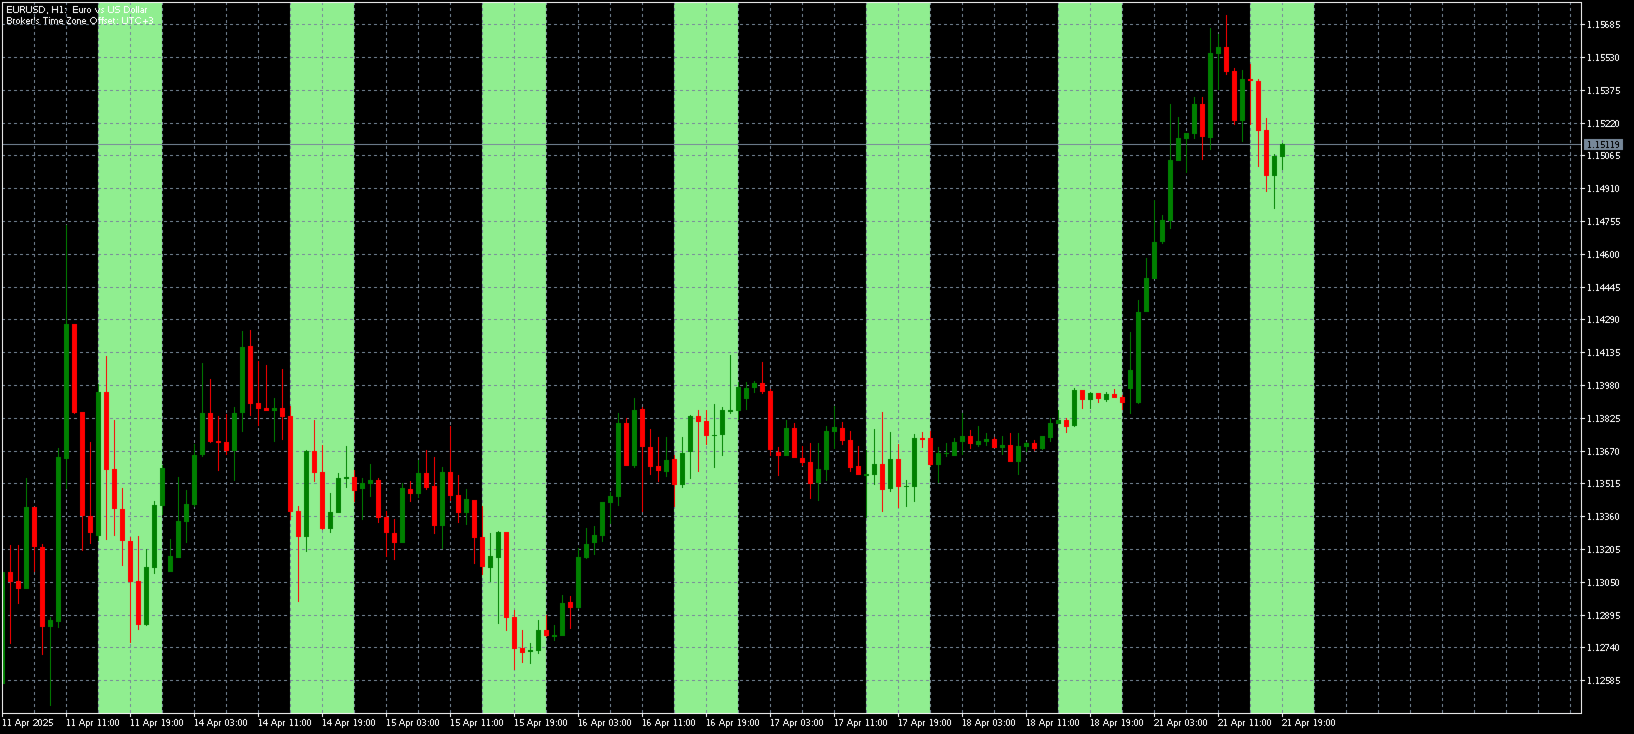
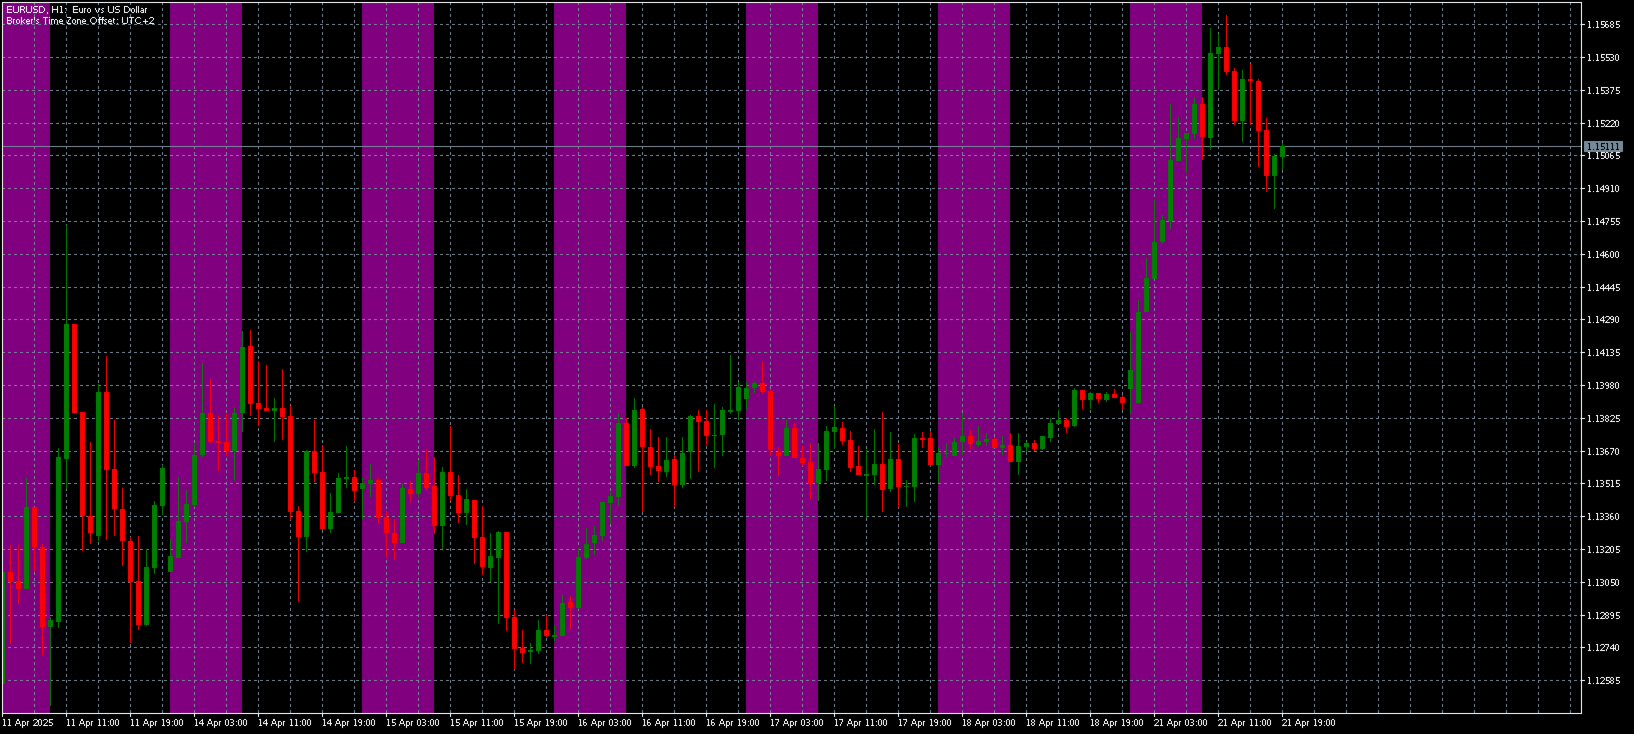
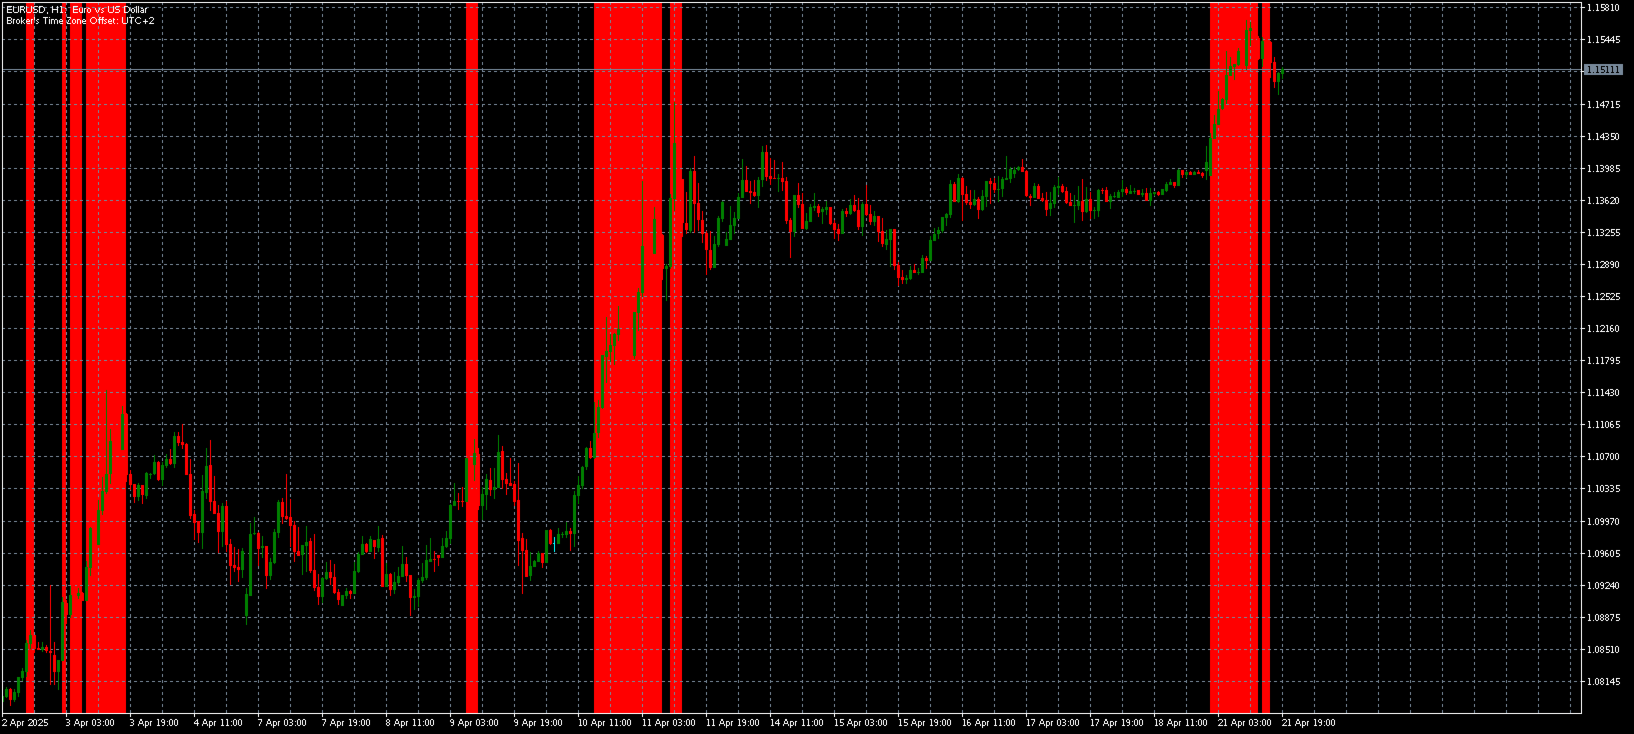
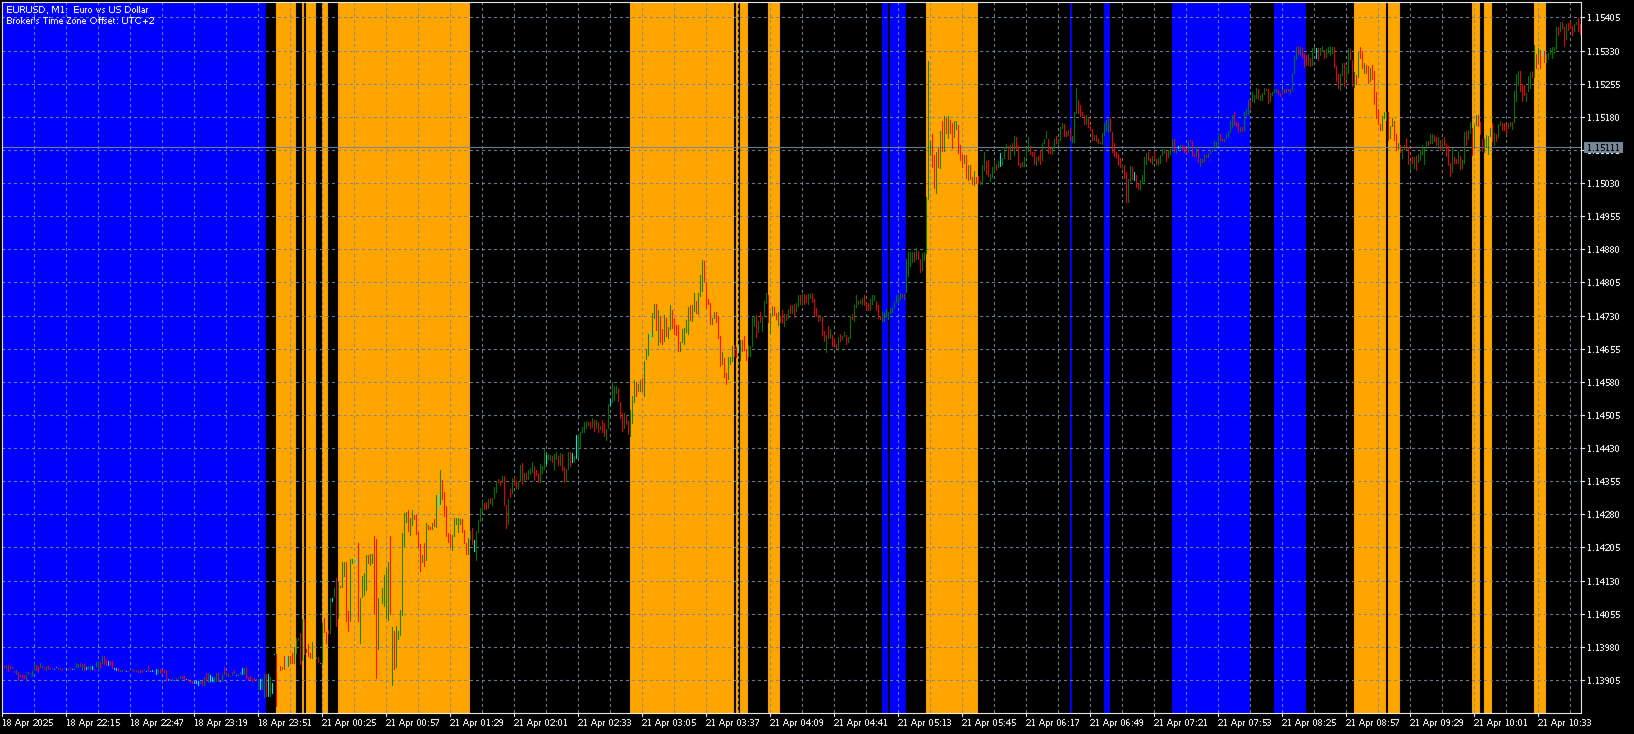
세션 하이라이트
-
주요 거래 세션을 차트에 자동으로 표시하여 타이밍 및 시장 분석을 개선합니다.
-
시각적 도구를 통해 높은 활동 기간에 집중할 수 있습니다.
-
-
RSI 알림
-
RSI가 과매수 또는 과매도 구간에 진입하면 실시간으로 알림을 제공합니다.
-
RSI 기간 및 임계값은 완전히 사용자 정의할 수 있습니다.
-
-
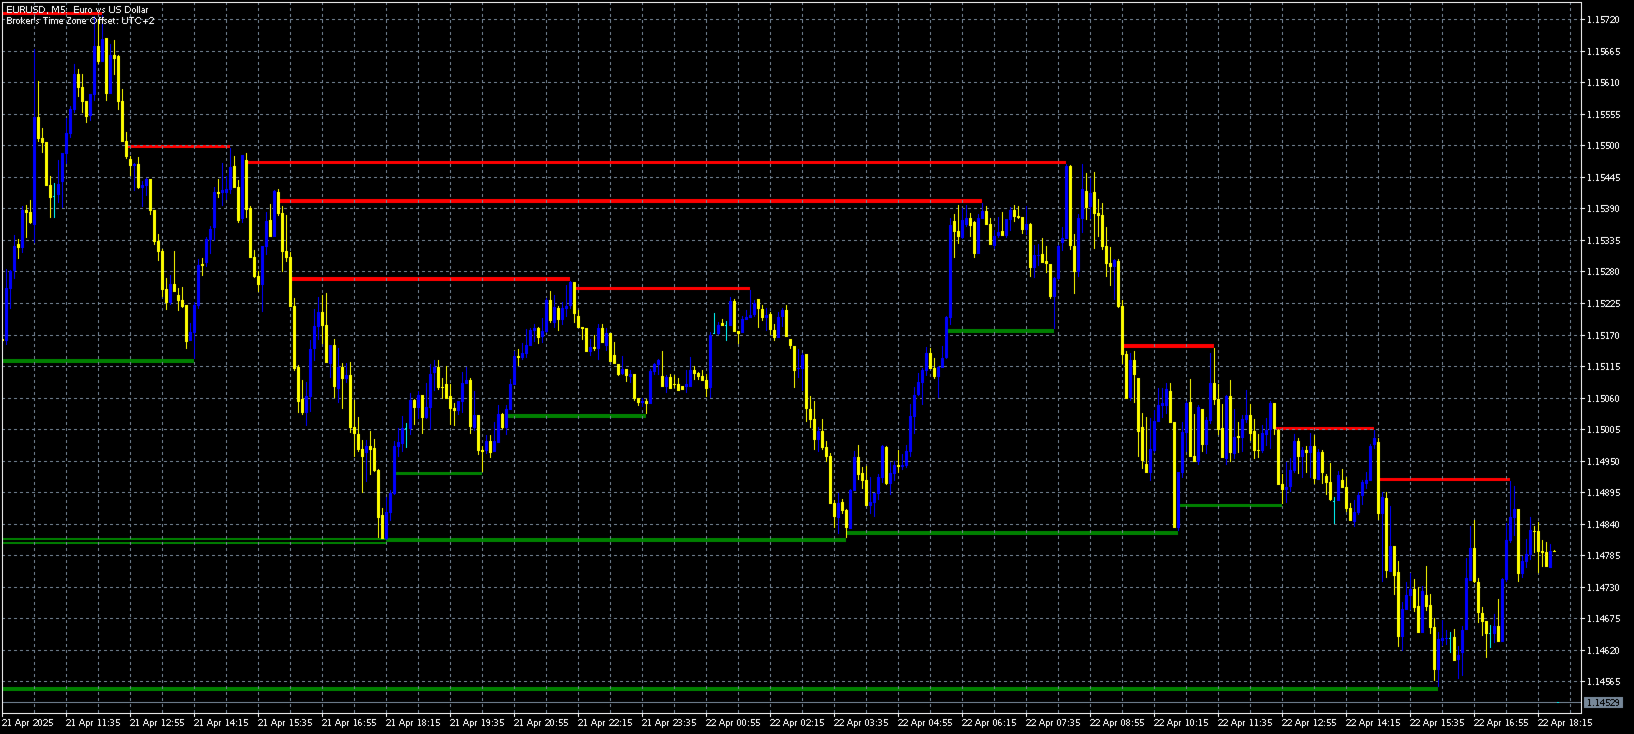
ATR 수준 감지
-
ATR 수준이 사용자가 설정한 상한선 또는 하한선을 초과하거나 하회하면 즉각적으로 알림을 보냅니다.
-
조정 가능한 ATR 기간 및 배율로 더 높은 정밀도를 제공합니다.
-
-
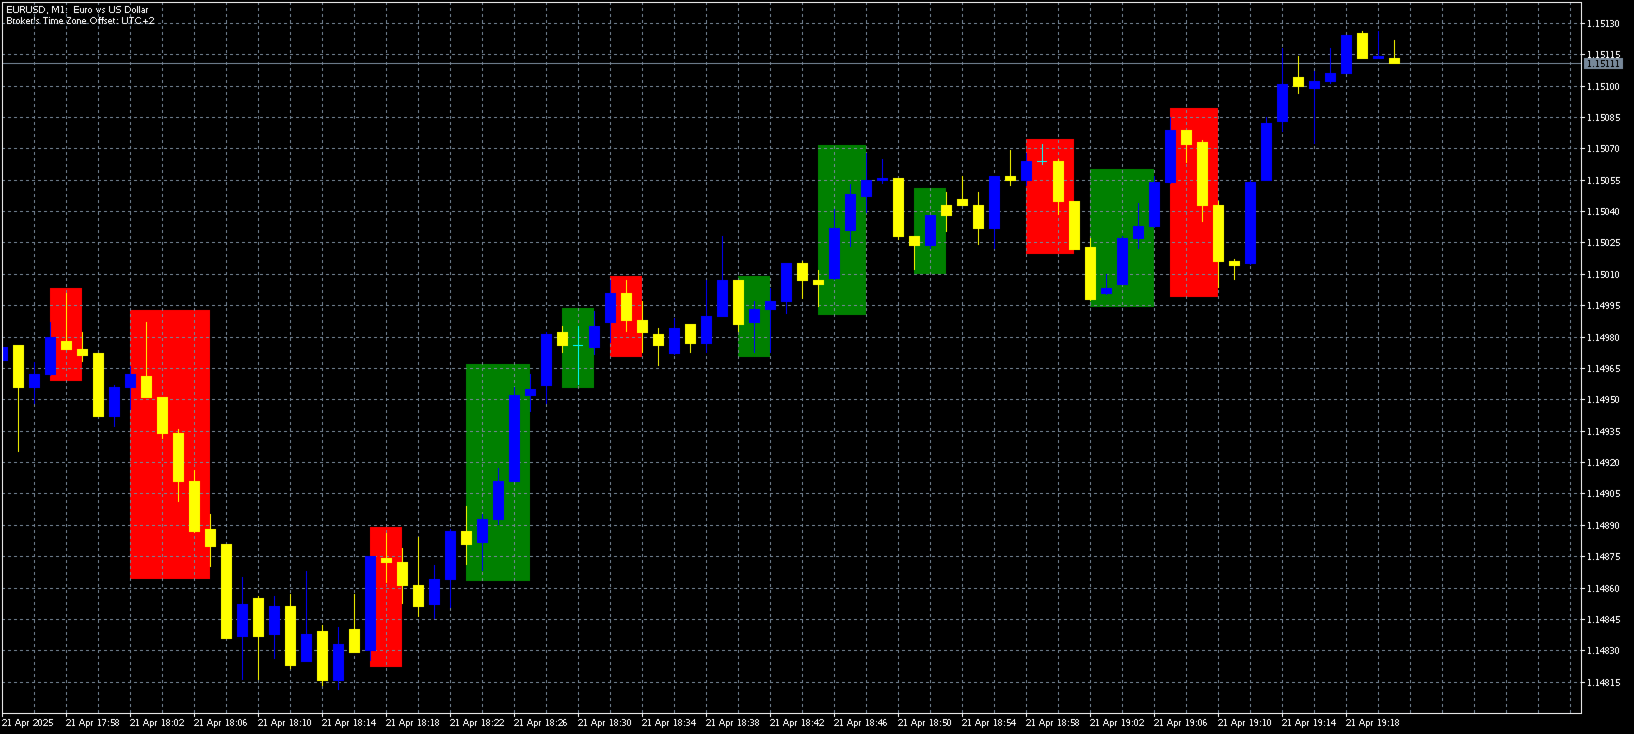
트렌드 감지
-
상승 트렌드(더 높은 고점 및 저점)와 하락 트렌드(더 낮은 고점 및 저점)를 즉각적으로 식별합니다.
-
사용자의 거래 스타일에 맞춰 루크백 기간을 사용자 정의할 수 있습니다.
-
-
실시간 알림
-
알림은 최신 완료된 막대에만 초점을 맞추어 실용적인 정보를 제공합니다.
-
-
하이라이팅 도구
-
세션 기간, 트렌드 막대 및 수준을 시각적으로 강조하여 차트 분석을 쉽게 수행할 수 있습니다.
-
초보자와 숙련된 트레이더 모두에게 빠르고 정보에 입각한 결정을 내리는 데 도움을 줍니다.
-
Chart Spotter를 선택해야 하는 이유
-
시간 절약: Chart Spotter가 차트 모니터링 작업을 처리하므로 실행에 집중할 수 있습니다.
-
한 발 앞서가기: RSI, ATR, 트렌드 변화에 즉각적으로 반응합니다.
-
사용자 정의 가능: 사용자의 거래 환경 및 전략에 완벽하게 적응합니다.
-
사용 용이성: 초보자와 전문가 모두를 위해 설계된 직관적이고 간단한 인터페이스를 제공합니다.
사용 방법
Chart Spotter를 차트에 부착하고 선호 설정을 구성하기만 하면 됩니다. 변동성이 큰 세션, RSI 수준을 추적하거나 새롭게 떠오르는 트렌드를 식별하는 경우에 Chart Spotter는 최고의 거래 도구입니다.