• 미리보기
  • 리뷰
  • 코멘트

Points of control

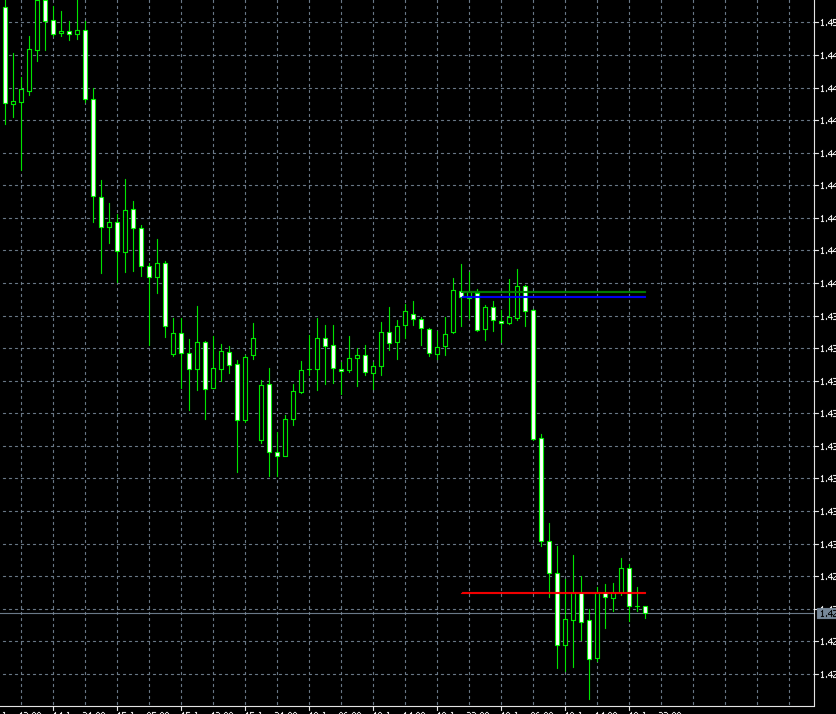
The POC_Levels indicator calculates and displays the 3 most frequently occurring price levels (Points of Control – POC) based on historical candles.

It is useful for identifying areas of high market interest (like support/resistance zones) across any timeframe.

How It Works

  • The indicator analyzes the last LookbackBars candles.

  • It counts how many times each price level (based on the selected price type) appears.

  • Then it selects the top 3 most frequent prices and draws horizontal lines at those levels.

  • These lines update live with every tick and are only shown from the area of calculation to the current candle.

  • Input Parameters

    Parameter Description
    LookbackBars Number of candles to scan back from the current candle
    PriceType Applied price used for analysis (e.g., Close, Open, High, Low, etc.)
    ShowPOC1 Show/hide the most frequent price level (POC 1)
    POC1Color Color of the line for POC 1
    POC1Width Line thickness for POC 1
    ShowPOC2 Show/hide the second most frequent price level (POC 2)
    POC2Color Color of the line for POC 2
    POC2Width Line thickness for POC 2
    ShowPOC3 Show/hide the third most frequent price level (POC 3)
    POC3Color Color of the line for POC 3
    POC3Width Line thickness for POC 3


  • 추천 제품
    Previous High Low Levels
    Artur Alves De Carvalho
    The Previous High Low Levels indicator displays the high and low of the previous candle from a selected higher timeframe. This helps traders identify key support and resistance zones while trading on lower timeframes. Features: Plots the previous high and low from a higher timeframe Works on all timeframes and instruments Helps identify strong support and resistance levels Lightweight and does not repaint How to Use: Select a higher timeframe (e.g., H1, H4, D1) in the settings. T
    FREE
    Utility for show on charts the visual informations about: - a vertical line at start of each bar of selected timeframe - a vertical line at start of each day - a vertical line at start of each week - vertical lines at start / end of trading sessions selected - bid / ask prices, spread, money value for each point (of 1 standard lot) and last tick time recived" You can enable / disable each information and set the color for each line
    FREE
    Graphic Alignment Context
    Ricardo Alexandre Laurentino
    The Graphic Alignment Context (GAC) Technical Indicator measures the vertical difference of the simple average price of a financial instrument in the context of three different timeframes determined by a defined number of bars or candles (periods) to determine the strength of the buy or sell trend. sale. Ascending average prices indicate Buying strength (1), Descending average prices indicate Selling strength (-1) and any scenario different from the previous two conditions indicates Neutrality
    FREE
    React Fibonacci Chart
    Kim Yonghwa
    4.91 (11)
    기능 피보나치 리트레이스먼트 트레이딩을 위한 지표 1H, 4H, 1D 및 1W 중에서 선택한 이전 바를 기반으로 피보나치 차트가 그려집니다. 시장 가격이 피보나치 레벨에 닿으면 색상이 변경되고 닿은 시간이 표시됩니다. -23.6, 0, 23.6, 38.2, 50, 61.8, 76.4, 100 및 123.6 레벨에 피보나치 그래프가 그려지며, 바가 업데이트될 때마다 차트가 새로 고침됩니다. 변수 타임프레임: 1H, 4H, 1D 및 1W 중에서 선택한 타임프레임으로 피보나치 차트가 그려집니다. FiboWidth: 레벨의 두께를 결정합니다. FiboStyle: 피봇 레벨의 스타일을 설정합니다. TouchedColor: 닿았을 때 변경되는 색상입니다. 오류가 있거나 개선 사항이 있다면 의견을 남겨주세요. 평가는 개발자에게 큰 도움이 됩니다. 만족하셨다면 5성을 부여해 주시기 바랍니다.
    FREE
    Propulsion Block V2 Indicator ICT MT5 The Propulsion Block V2 Indicator ICT MT5 is built upon the ICT trading methodology, allowing traders to identify key Propulsion Blocks that are often overlooked. This tool highlights these blocks using arrow markers on the price chart, marking areas where institutional investors and large market players establish or reinforce their positions. Due to the significance of these zones, experienced traders leverage them for strategic trade entries.   Indicator S
    FREE
    VWAP Simple
    Deibson Carvalho
    4.25 (28)
    The Volume Weighted Average Price is similar to a moving average, except volume is included to weight the average price over a period.    Volume-Weighted Average Price [VWAP] is a dynamic, weighted average designed to more accurately reflect  a security’s true average price over a given period . Mathematically, VWAP is the summation of money (i.e., Volume x Price) transacted divided by the total volume over any time horizon, typically from market open to market close. VWAP reflects the capitali
    FREE
    Bar Sequential
    Maximiliano Frisione Figueroa
    This indicator can help you clearly identify trend changes in both bullish and bearish markets. The indicator compares the closing price of the last candle with the closing price of the candle "X" periods ago (input parameter). In an uptrend, an initial number '1' is plotted if a candle closes higher than the closing of a candle "X" periods ago. In a downtrend, an initial number '1' is plotted if a candle closes below the closing of a candle "X" periods ago. Subsequent numbers are plotted when e
    FREE
    SMC Structure Markup
    Seyed Mohammad Hosseini Hejazi
    5 (6)
    Overview The Smart Money Structure Markup Indicator for MetaTrader 5 is a powerful tool designed to help traders identify key market structures based on popular Smart Money Concepts (SMC) strategies. This indicator detects micro-market structures, providing insights into price movements and potential trend changes. It highlights important elements such as valid Break of Structure (BOS), Change of Character (CHoCH), and Inducement (IDM), helping traders to make informed decisions. Key Features Ma
    FREE
    Reclaimed Order Block ICT Indicator MT5 Built upon the ICT trading principles, the Reclaimed Order Block ICT Indicator MT5 for MetaTrader 5 pinpoints essential price areas where an order block is initially breached, leading to a structural shift and the formation of a new trend. As the price revisits these levels post-breakout, the indicator generates strategic buy and sell signals, assisting traders in making data-driven decisions. «Indicator Installation & User Guide» MT5 Indicator Installatio
    FREE
    Vertical Volume
    Kim Yonghwa
    4.83 (6)
    기능 가격에 대한 거래량 확인 지표입니다. 주로 EURUSD에 적용되며, 다른 통화 쌍은 작동하지 않거나 계산에 오랜 시간이 걸릴 수 있습니다. 원활한 사용을 위해 "차트 경계를 오른쪽 경계에서 이동" 옵션을 활성화합니다(스크린샷에 표시됨). 새로운 막대가 나타날 때 데이터가 재설정됩니다. 변수 COlOR: 지표 색상 설정 WIDTH: 지표 너비 설정 PERIOD: 데이터 계산을 위한 기간 설정 ‐----‐-------------------------------------------------------------------------------------------------------------------------------------------------
    FREE
    BinaWin NoTouch
    Juan Fernando Urrego Alvarez
    BinaWin NoTouch is an indicator that sends an alert signal when the trade is in the right position to wait for the breakdown of a side market. It is specially designed to trade under the “No Touch” strategy of the Binary.Com platform with synthetic indexes N.10, N.25, N.50, N.75 and N.100 Similarly, trading can be done with the conventional CALL and PUT strategy of any Binary Options platform. Requirements to use the indicator: 1. Have an account at Binary.Com 2. Configure the Binary.Com d
    FREE
    SmartSetup Bot Is an advanced trading tool that combines the flexibility of manual configurations with the power of semi-automated features. It automatically generates graphical objects, displaying critical zones such as support and resistance levels, stop loss and take profit areas, and other essential indicators. SmartSetup Bot provides clear and precise visualization of your trading parameters, facilitating informed decision-making. This bot is designed for traders who value manual control bu
    FREE
    The  Box Range Indicator  for MT5 helps traders visualize key price zones by automatically detecting and highlighting market structures. It dynamically draws upper, lower, and middle levels based on price action, making it an effective tool for identifying  support and resistance zones, breakouts, and trend reversals . Key Features: • Automatic Box Detection – Identifies price ranges based on market movements. • Dynamic High and Low Updates – Adjusts in real time to reflect market conditions.
    FREE
    ZigZag SMC MT5
    Kallebe Lins De Oliveira Santos
    The ZigZag SMC/SMT Indicator for MT5 is the ideal tool for traders who want to accurately identify tops and bottoms based on the advanced concepts of Smart Money Concepts (SMC) and Smart Money Trap (SMT). Main Benefits: Automatic identification of strategic tops and bottoms. Based on concepts used by institutional traders. Ideal for analyzing liquidity, market structure and manipulation. Simple to use: just add it to the chart and track the critical points. ️ Free Version: This ve
    FREE
    Simple Candle Countdown
    Emanuel Cavalcante Amorim Filho
    Simple candle countdown - never again miss how much time is left to open a new bar! This indicator doesn't plot any line on the chart - it uses only objects and calculates the time left to open a new bar. You can set custom colors for the panel background and border and for the text color. Simple as that, the indicator is ready to use. If you find any bugs, feel free to contact me. 
    FREE
    Smart Calculator
    Renato Fiche Junior
    4.67 (18)
    Simple utility to calculate margin and financial value according to the number of lots and points informed by the user. This is a product developed by the Renato Fiche Junior and available to all MetaTrader 5 users! Partners: "Águia Traders"  team ( Eagle Traders ) by  Larissa Sihle  #aguiatraders #larissasihle Input Parameters - Balance : Account balance. The margin percentage will be calculated based on the balance informed by the user.
    FREE
    VI Vortex
    Fernando Lahude Ritter
    4.75 (4)
    Description : Enhance Your Trading Strategy with the Advanced Vortex Indicator for MT5! Discover the power of the Vortex Indicator (VI), a robust technical analysis tool now available for MetaTrader 5. This custom-built indicator is designed to help traders identify trends and reversals, offering a critical edge in the dynamic Forex market. Key Features: Dynamic Trend Identification : With the VI's unique calculations of VI+ (positive) and VI- (negative) lines, you can easily spot trend strength
    FREE
    The 4 headed dragon is an indicator that has two functions. 1) Set the background trend. 2) Mark the predominant trend. By combining these two indicator signals, we will be able to trade for or against the trend, adapting the signals to your reading of the market. You can download the demo and test it yourself. 1) Set the background trend.    Define four possibilities of trend that are the four heads of the dragon, marked by colors on the indicator, marking a) Powerful buying trend. b) Weak
    MP Heatmap for MT5
    Pierre Ksachikian
    5 (2)
    A heatmap is a graphical representation of data in two dimensions, using colors to display different factors. Heatmaps are a helpful visual aid for viewers, enabling the quick dissemination of statistical or data-driven information. The MP Heatmap indicator provides a graphical representation of the relative strengths of major currencies compared to others, organizing data from pairs into color-coded results and producing a clear overview of the entire Forex market. The MP Heatmap indicator dis
    FREE
    DataFeeder
    Joao Paulo Euko
    Hi you, I need your help! Be my Patron, let's make it possible! https://www.patreon.com/joaopeuko https://github.com/Joaopeuko/Mql5-Python-Integration Esse Expert Advisor copia os dados("symbol,last,bid,ask") dos ativos que foram colocados na lista e só funciona enquanto o mercado esta aberto. Esse EA não é um link DDE ou RTD, as informações não são passadas em tempo real ao excel. O EA tem um delay de 30 segundos e o Excel tem um delay de 1 minuto. A vantagem desse EA é que ele dispensa o
    FREE
    CChart
    Rong Bin Su
    Overview In the fast-paced world of forex and financial markets, quick reactions and precise decision-making are crucial. However, the standard MetaTrader 5 terminal only supports a minimum of 1-minute charts, limiting traders' sensitivity to market fluctuations. To address this issue, we introduce the Second-Level Chart Candlestick Indicator , allowing you to effortlessly view and analyze market dynamics from 1 second to 30 seconds on a sub-chart. Key Features Support for Multiple Second-Level
    HiperCube ADX Histogram
    Adrian Lara Carrasco
    HiperCube ADX Histogram is here! Discount code for 25% off at Darwinex Zero: DWZ2328770MGM This indicators helps you to know if could be a strong trend in the market . ADX is a very popular and usefull indicator, so many top traders reccomends use it as filter to bad trades, or in combinations of other analysis. With HiperCube ADX you will be a premium exoerience using a beautifula and great indicator for your trading. FEATURES: Fully Customizable Custom Your Chart! Custom Color to Histogram I
    FREE
    This SMT (Smart Money Technique) divergence indicator identifies discrepancies in price movement between two different trading symbols, helping traders detect potential market reversals. This tool compares the price action of two correlated assets, such as two currency pairs or indices, to spot divergences where one asset's price moves in the opposite direction of the other. For example, while one symbol may be making higher highs, the other might be making lower highs, signaling a divergence. T
    FREE
    A good trader is a trader that respect his plan and keep the head cool. This indicator allow to display up to 5 lines of text for the things you always to see. Congifuration 5 lines of text Text font, color, size Frame on/off, color, style, size Position of the text anchored Corners or anywhere on the screen Any questions or comments, send me a direct message here  https://www.mql5.com/en/users/mvonline
    FREE
    Weis Waves
    Flavio Javier Jarabeck
    2.83 (18)
    The original author is David Weis, an expert in the Wyckoff Method. The Weis Wave is a modern adaptation of the 1930's Wyckoff Method, another expert in Tape Reading techniques and Chart Analysis. Weis Waves takes market volume and stacks it into waves according to price conditions giving the trader valuable insights about the market conditions. If you want to learn more about this subject you can find tons of videos in YouTube. Just look for "The Wickoff Method", "Weis Wave" and "Volume Spread
    FREE
    트렌드 캐쳐: 알림 인디케이터와 함께 하는 트렌드 캐쳐 전략은 시장 트렌드와 잠재적인 진입 및 체크 포인트를 식별하는 데 도움이 되는 다목적 기술 분석 도구입니다. 이는 시장 상황에 적응하여 트렌드 방향을 명확하게 시각적으로 표현하는 동적 트렌드 캐쳐 전략을 제공합니다. 트레이더는 선호도와 위험 허용도에 맞게 매개변수를 사용자 정의할 수 있습니다. 이 인디케이터는 트렌드 식별을 지원하고 잠재적인 반전을 신호로 제공하며 트레일링 스탑 메커니즘으로 작동하며 실시간 경고를 제공하여 신속한 시장 대응을 돕습니다. 특징: - 트렌드 식별: 상승 트렌드와 하락 트렌드를 신호합니다. - 트렌드 반전: 양봉 색상이 상승에서 하락으로 변경되거나 그 반대의 경우 잠재적인 반전을 경고합니다. - 실시간 경고: 새로운 트렌드 식별을 위한 경고를 생성합니다. 추천사항: - 통화 및 페어: EURUSD, AUDUSD, XAUUSD 등... - 시간 프레임: H1. - 계정 유형: 모든 ECN 계정
    FREE
    Flat finder
    Yuriy Lyachshenko
    이 인디케이터는 플랫을 감지하고 발견된 영역을 컬러 직사각형으로 칠합니다. 이 인디케이터의 주요 아이디어는 가격이 차트의 특정 영역을 채울 때 플랫을 감지하는 것입니다. 입력 매개변수: Color rectangle - 음영 처리할 사각형의 색상입니다. Bars in rectangle - 직사각형에 허용되는 최소 막대 수입니다. Density in % - 플랫의 밀도로, 사각형 영역의 백분율로 설정합니다. __________________________________________________________________ __________________________________________________________________
    1. Why did I develop this series of indicators I found that most traders need to use multiple time frame indicators. They usually switch time frame to see indicators. However, once the timeframe is switched, you cannot see the  corresponding relationship  between  the price in the smaller timeframe  and  the indicator in the larger timeframe . For example: if your price chart is in H1 timeframe, you can see H4, D1 and W1 indicators in H1 timeframe Chart. This is more helpful for you to find th
    Candle Perspective Structure Indicator MT5 is a simple indicator that defines and displays the candlestick structure of the market. This indicator will suit both experienced traders and beginners who find it difficult to follow the structure visually. Main functions: Determining High and Low swings using the three candlestick pattern. Determination of structure breaks. Setting the visual display of structural elements. Setting the period for which the structure is analysed. Input parameters:
    FREE
    Cybertrade Auto Fibonacci
    Emanuel Andriato
    5 (7)
    Cybertrade Auto Fibonacci retraction and projection  - MT5 Auto Fibonacci is an indicator that automatically plots the Fibonacci retracement and projection based on the number of bars you select in the indicator setting. You can customize nine different levels of retraction and three levels of projection. It works on periods longer than the period visible on the chart. All values ​​are available in the form of buffers to simplify possible automations. This indicator is the same one we use in ou
    FREE
    이 제품의 구매자들이 또한 구매함
    Trend Screener Pro MT5
    STE S.S.COMPANY
    4.85 (79)
    트렌드 표시기, 트렌드 트레이딩 및 필터링을 위한 획기적인 고유 솔루션, 하나의 도구 안에 내장된 모든 중요한 트렌드 기능! Forex, 상품, 암호 화폐, 지수 및 주식과 같은 모든 기호/도구에 사용할 수 있는 100% 다시 칠하지 않는 다중 시간 프레임 및 다중 통화 표시기입니다. Trend Screener는 차트에 점이 있는 화살표 추세 신호를 제공하는 효율적인 지표 추세 추종 지표입니다. 추세 분석기 표시기에서 사용할 수 있는 기능: 1. 트렌드 스캐너. 2. 최대 이익 분석이 있는 추세선. 3. 추세 통화 강도 측정기. 4. 경고가 있는 추세 반전 점. 5. 경고가 있는 강력한 추세 점. 6. 추세 화살표 Trend Screener Indicator가 있는 일일 분석 예, 일일 신호 성능...등은 여기에서 찾을 수 있습니다. 여기를 클릭하십시오. LIMITED TIME OFFER : Trend Screener Indicator는 50$ 및 평생 동안만 사용할 수 있습니다.
    Moneytron — профессиональный сигнальный индикатор тренда Индикатор Moneytron предназначен для тех, кто хочет зарабатывать стабильно и системно, торгуя по тренду. Он автоматически определяет: • Точки входа (Buy/Sell сигналы) • 3 уровня тейк-профита (TP1, TP2, TP3) • 3 уровня стоп-лосса (SL1, SL2, SL3) • Показывает реальную статистику успешности сделок прямо на графике Особенности: • Работает на всех валютных парах и металлах • Идеален для таймфреймов M30, H1 и выше • Подходит как для начинающи
    Algo Pumping
    Ihor Otkydach
    5 (7)
    PUMPING STATION – 당신만을 위한 올인원(All-in-One) 전략 PUMPING STATION은 당신의 외환 거래를 더욱 흥미롭고 효과적으로 바꿔줄 혁신적인 인디케이터입니다. 단순한 보조 도구가 아니라, 강력한 알고리즘을 갖춘 완전한 거래 시스템으로서 보다 안정적인 트레이딩을 시작할 수 있도록 도와줍니다. 이 제품을 구매하시면 다음의 혜택을 무료로 받으실 수 있습니다: 전용 설정 파일: 자동 설정으로 최대의 퍼포먼스를 제공합니다. 단계별 동영상 가이드: PUMPING STATION 전략으로 거래하는 법을 배워보세요. Pumping Utility: PUMPING STATION과 함께 사용하도록 설계된 반자동 거래 봇으로, 거래를 더욱 쉽고 편리하게 만들어줍니다. ※ 구매 후 바로 저에게 메시지를 보내주세요. 추가 자료에 대한 접근 권한을 제공해드립니다. PUMPING STATION은 어떻게 작동하나요? 트렌드 컨트롤: 시장의 추세 방향을 즉시 파악합니다. 추세는 최고의
    Golden Trend Indicator MT5
    Noha Mohamed Fathy Younes Badr
    4.89 (18)
    Golden Trend indicator  is The best indicator for predicting trend movement this indicator never lags and never repaints and never back paints    and give  arrow buy and sell    before the candle appear  and it will help you and  will make your trading decisions clearer its work on all currencies and  gold and crypto and all time frame This unique  indicator uses very secret algorithms to catch the  trends, so you can trade using this indicator and see the trend clear on charts  manual guide and
    Support And Resistance Screener는 하나의 지표 안에 여러 도구를 제공하는 MetaTrader에 대한 하나의 레벨 지표입니다. 사용 가능한 도구는 다음과 같습니다. 1. 시장 구조 스크리너. 2. 완고한 후퇴 영역. 3. 약세 후퇴 영역. 4. 일일 피벗 포인트 5. 주간 피벗 포인트 6. 월간 피벗 포인트 7. 고조파 패턴과 볼륨에 기반한 강력한 지지와 저항. 8. 은행 수준 구역. LIMITED TIME OFFER : HV 지원 및 저항 표시기는 50 $ 및 평생 동안만 사용할 수 있습니다. ( 원래 가격 125$ ) MQL5 블로그에 액세스하면 분석 예제와 함께 모든 프리미엄 지표를 찾을 수 있습니다. 여기를 클릭하십시오. 주요 특징들 고조파 및 볼륨 알고리즘을 기반으로 하는 강력한 지원 및 저항 영역. Harmonic 및 Volume 알고리즘을 기반으로 한 강세 및 약세 풀백 영역. 시장 구조 스크리너 일간, 주간 및 월간 피벗 포인트. 실제 거래의
    FX Power MT5 NG
    Daniel Stein
    5 (13)
    FX Power: 통화 강세 분석으로 더 스마트한 거래 결정을 개요 FX Power 는 어떤 시장 상황에서도 주요 통화와 금의 실제 강세를 이해하기 위한 필수 도구입니다. 강한 통화를 매수하고 약한 통화를 매도함으로써 FX Power 는 거래 결정을 단순화하고 높은 확률의 기회를 발견합니다. 트렌드를 따르거나 극단적인 델타 값을 사용해 반전을 예측하고자 한다면, 이 도구는 귀하의 거래 스타일에 완벽히 적응합니다. 단순히 거래하지 말고, FX Power 로 더 스마트하게 거래하세요. 1. FX Power가 거래자에게 매우 유용한 이유 통화와 금의 실시간 강세 분석 • FX Power 는 주요 통화와 금의 상대적 강세를 계산하고 표시하여 시장 역학에 대한 명확한 통찰력을 제공합니다. • 어떤 자산이 앞서고 있고 어떤 자산이 뒤처지는지 모니터링하여 보다 현명한 거래 결정을 내릴 수 있습니다. 포괄적인 멀티 타임프레임 뷰 • 단기, 중기 및 장기 타임프레임에서 통화와 금의 강세를
    FX Volume MT5
    Daniel Stein
    4.82 (17)
    FX Volume: 브로커 시각에서 바라보는 진짜 시장 심리 간단 요약 트레이딩 접근 방식을 한층 더 향상시키고 싶으신가요? FX Volume 는 소매 트레이더와 브로커의 포지션을 실시간으로 파악할 수 있게 해 줍니다. 이는 COT 같은 지연된 보고서보다 훨씬 빠릅니다. 꾸준한 수익을 추구하는 분이든, 시장에서 더 깊은 우위를 원하시는 분이든, FX Volume 을 통해 대규모 불균형을 찾아내고, 돌파 여부를 확인하며 리스크 관리를 정교화할 수 있습니다. 지금 시작해 보세요! 실제 거래량 데이터가 의사결정을 어떻게 혁신할 수 있는지 직접 경험해 보시기 바랍니다. 1. 트레이더에게 FX Volume이 매우 유익한 이유 탁월한 정확도를 지닌 조기 경보 신호 • 다른 사람들보다 훨씬 앞서, 각 통화쌍을 매수·매도하는 트레이더 수를 거의 실시간으로 파악할 수 있습니다. • FX Volume 은 여러 리테일 브로커에서 추출한 실제 거래량 데이터를 종합해 명확하고 편리한 형태로 제공하는
    Grabber System MT5
    Ihor Otkydach
    5 (5)
    탁월한 기술적 지표인 Grabber를 소개합니다. 이 도구는 즉시 사용 가능한 “올인원(All-Inclusive)” 트레이딩 전략으로 작동합니다. 하나의 코드 안에 강력한 시장 기술 분석 도구, 매매 신호(화살표), 알림 기능, 푸시 알림이 통합되어 있습니다. 이 인디케이터를 구매하신 모든 분들께는 다음의 항목이 무료로 제공됩니다: Grabber 유틸리티: 오픈 포지션을 자동으로 관리하는 도구 단계별 영상 매뉴얼: 설치, 설정, 그리고 실제 거래 방법을 안내 맞춤형 세트 파일: 인디케이터를 빠르게 자동 설정하여 최고의 성과를 낼 수 있도록 도와줍니다 다른 전략은 이제 잊어버리세요! Grabber만이 여러분을 새로운 트레이딩의 정점으로 이끌어 줄 수 있습니다. Grabber 전략의 주요 특징: 거래 시간 프레임: M5부터 H4까지 거래 가능한 자산: 어떤 자산이든 사용 가능하지만, 제가 직접 테스트한 종목들을 추천드립니다 (GBPUSD, GBPCAD, GBPCHF, AUDCAD, AU
    FourAverageMT5
    Mikhail Sergeev
    5 (2)
    포라 평균은 트렌드 탐지의 새로운 단어입니다. 정보 기술의 발전과 많은 참가자들로 인해 금융 시장은 구식 지표에 의한 분석에 덜 민감해지고 있습니다. 이동 평균이나 정작과 같은 기존의 기술적 분석 도구는 순수한 형태로 추세의 방향이나 역전 방향을 결정할 수 없습니다. 하나의 지표가 14 년의 역사를 기반으로 매개 변수를 변경하지 않고 미래 가격의 올바른 방향을 나타낼 수 있습니까? 동시에,옆으로 시장의 움직임과 적절성을 잃지 않는다? 답변:예,할 수 있습니다. 우리 팀은 변화하는 시장 상황에 적응하기 위해 상당히 강력하고 효과적인 메커니즘을 가진 지표를 개발했습니다. 2025 년에 선도적 인 추세 지표"평균"은 새로운 개발 단계에 진입하고 있습니다. 현대 암호 화폐 및 주식 시장은이 지표를 위해 만들어진 것 같습니다. 고유 한 스무딩 공식을 사용하면 통화 쌍 또는 기타 악기의 모든 기능에 대한 표시기를 조정(패턴 식별)할 수 있습니다. 지금,이익을 만들기 위해,하나의 지표는 충분하다
    Quantum TrendPulse
    Bogdan Ion Puscasu
    5 (13)
    SuperTrend   ,   RSI   ,   Stochastic   의 힘을 하나의 포괄적인 지표로 결합하여 트레이딩 잠재력을 극대화하는 궁극의 트레이딩 도구   인 Quantum TrendPulse를   소개합니다. 정밀성과 효율성을 추구하는 트레이더를 위해 설계된 이 지표는 시장 추세, 모멘텀 변화, 최적의 진입 및 종료 지점을 자신 있게 식별하는 데 도움이 됩니다. 주요 특징: SuperTrend 통합:   주요 시장 추세를 쉽게 따라가고 수익성의 물결을 타세요. RSI 정밀도:   매수 과다 및 매도 과다 수준을 감지하여 시장 반전 시점을 파악하는 데 적합하며 SuperTrend 필터로 사용 가능 확률적 정확도:   변동성이 큰 시장에서 숨겨진 기회를 찾기 위해 확률적 진동   을 활용하고 SuperTrend의 필터로 사용 다중 시간대 분석:   M5부터 H1 또는 H4까지 다양한 시간대에 걸쳐 시장을 최신 상태로 유지하세요. 맞춤형 알림:   맞춤형 거래 조건이 충족되면
    TPSproTREND PrO MT5
    Roman Podpora
    4.72 (18)
    VERSION MT4        —        ИНСТРУКЦИЯ RUS           —        INSTRUCTIONS  ENG 주요 기능: 렌더링 없이 정확한 입력 신호! 신호가 나타나면 관련성은 유지됩니다! 이는 신호를 제공한 후 변경하여 예금 자금 손실을 초래할 수 있는 다시 그리기 지표와의 중요한 차이점입니다. 이제 더 큰 확률과 정확도로 시장에 진입할 수 있습니다. 화살표가 나타난 후 목표에 도달(이익실현)하거나 반전 신호가 나타날 때까지 캔들을 색칠하는 기능도 있습니다. STOP LOSS / TAKE PROFIT 구역 표시 진입점 검색 시 시각적 명확성을 높이기 위해 시장 진입을 위한 최적 지점이 검색되는 BUY/SELL 영역을 초기에 표시하는 모듈을 만들었습니다. 정지 손실 수준 작업을 위한 추가 지능형 논리는 시간이 지남에 따라 크기를 줄이는 데 도움이 되므로 거래에 들어갈 때 초기 위험을 줄이는 데 도움이 됩니다(move sl). 더 높은 기간의 MIN
    Matrix Arrow Indicator MT5
    Juvenille Emperor Limited
    5 (13)
    매트릭스 화살표 표시기 MT5 는 외환, 상품, 암호 화폐, 지수, 주식과 같은 모든 기호/도구에 사용할 수 있는 100% 다시 칠하지 않는 다중 기간 표시기를 따르는 고유한 10 in 1 추세입니다.  Matrix Arrow Indicator MT5 는 다음과 같은 최대 10개의 표준 지표에서 정보와 데이터를 수집하여 초기 단계에서 현재 추세를 결정합니다. 평균 방향 이동 지수(ADX) 상품 채널 지수(CCI) 클래식 하이켄 아시 캔들 이동 평균 이동 평균 수렴 발산(MACD) 상대 활력 지수(RVI) 상대 강도 지수(RSI) 포물선 SAR 스토캐스틱 오실레이터 윌리엄스의 백분율 범위 모든 지표가 유효한 매수 또는 매도 신호를 제공하면 강력한 상승/하락 추세를 나타내는 다음 캔들/막대가 시작될 때 해당 화살표가 차트에 인쇄됩니다. 사용자는 사용할 표시기를 선택하고 각 표시기의 매개변수를 개별적으로 조정할 수 있습니다. 매트릭스 화살표 표시기 MT5는 선택한 표시기에서만 정보를 수
    FX Levels MT5
    Daniel Stein
    5 (4)
    FX Levels: 모든 시장을 위한 뛰어난 정확도의 지지와 저항 간단 요약 통화쌍, 지수, 주식, 원자재 등 어떤 시장이든 믿을 만한 지지·저항 레벨을 찾고 싶나요? FX Levels 는 전통적인 “Lighthouse” 기법과 첨단 동적 접근을 결합해, 거의 보편적인 정확성을 제공합니다. 실제 브로커 경험을 반영하고, 자동화된 일별 업데이트와 실시간 업데이트를 결합함으로써 FX Levels 는 가격 반전 포인트를 파악하고, 수익 목표를 설정하며, 자신 있게 트레이드를 관리할 수 있게 돕습니다. 지금 바로 시도해 보세요—정교한 지지/저항 분석이 어떻게 여러분의 트레이딩을 한 단계 끌어올릴 수 있는지 직접 확인하세요! 1. FX Levels가 트레이더에게 매우 유용한 이유 뛰어난 정확도의 지지·저항 존 • FX Levels 는 다양한 브로커 환경에서도 거의 동일한 존을 생성하도록 설계되어, 데이터 피드나 시간 설정 차이로 인한 불일치를 해소합니다. • 즉, 어떤 브로커를 사용하
    Gold Stuff mt5
    Vasiliy Strukov
    4.93 (178)
    Gold Stuff mt5는 금을 위해 특별히 설계된 추세 지표이며 모든 금융 상품에서도 사용할 수 있습니다. 표시기가 다시 그려지지 않고 지연되지 않습니다. 권장 기간 H1. 설정 및 개인 보너스를 받으려면 구매 후 즉시 저에게 연락하십시오!     강력한 지원 및 트렌드 스캐너 표시기의 무료 사본을 받으실 수 있습니다. 메시지를 보내주세요. 나!   설정 화살표 그리기 - 켜기 끄기. 차트에 화살표 그리기. 경고 - 가청 경고를 끕니다. 이메일 알림 - 켜기 끄기. 이메일 알림. Puch-notification - 켜기 끄기. 푸시 알림. 다음으로 색 영역을 조정합니다. Gold Stuff mt5는 금을 위해 특별히 설계된 추세 지표이며 모든 금융 상품에서도 사용할 수 있습니다. 표시기가 다시 그려지지 않고 지연되지 않습니다. 권장 기간 H1. 설정 및 개인 보너스를 받으려면 구매 후 즉시 저에게 연락하십시오!   설정 화살표 그리기 - 켜기 끄기. 차트에 화살표 그
    TPSpro RFI Levels MT5
    Roman Podpora
    4.55 (20)
    주요 플레이어의 반전 구역 / 피크 볼륨 / 활성 구역 =       TS TPS프로시스템 지침 RUS       /       지침       영어       /           버전 MT4        이 지표를 구매한 모든 구매자는 또한 다음을 무료로 받습니다. RFI SIGNALS 서비스의 거래 신호에 6개월 동안 액세스할 수 있습니다. TPSproSYSTEM 알고리즘에 따른 즉시 사용 가능한 진입 포인트입니다. 정기적으로 업데이트되는 교육 자료 - 전략에 푹 빠져서 전문가 수준을 높여보세요. 주중 24/5 지원 및 비공개 트레이더 채팅 이용 - 시장 상황에 대한 소통, 지원 및 분석. 저자가 설정한 파일 - 별도의 노력 없이 최대 결과를 얻을 수 있도록 지표를 자동으로 설정합니다. 주요 기능: 판매자와 구매자의 활동 영역을 표시합니다! 이 지표는 매수 및 매도에 대한 모든 올바른 첫 번째 임펄스 레벨/존을 표시합니다. 진입점 검색이 시작되는 이러한 레벨/존이 활성화되면
    IX Power MT5
    Daniel Stein
    4.86 (7)
    IX Power: 지수, 원자재, 암호화폐 및 외환 시장 통찰력을 발견하세요 개요 IX Power 는 지수, 원자재, 암호화폐 및 외환 시장의 강도를 분석할 수 있는 다목적 도구입니다. FX Power 는 모든 가용 통화 쌍 데이터를 사용하여 외환 쌍에 대해 가장 높은 정확도를 제공하는 반면, IX Power 는 기초 자산 시장 데이터에만 초점을 맞춥니다. 이로 인해 IX Power 는 비외환 시장에 이상적이며, 다중 쌍 분석이 필요하지 않은 간단한 외환 분석에도 신뢰할 수 있는 도구입니다. 모든 차트에서 매끄럽게 작동하며, 거래 결정을 향상시키기 위한 명확하고 실행 가능한 통찰력을 제공합니다. 1. IX Power가 트레이더에게 유용한 이유 다양한 시장 강도 분석 • IX Power 는 지수, 원자재, 암호화폐 및 외환 심볼의 강도를 계산하여 각 시장에 맞는 통찰력을 제공합니다. • US30, WTI, 금, 비트코인 또는 통화 쌍과 같은 자산을 모니터링하여 거래 기회를 발견
    Trade smarter, not harder: Empower your trading with Harmonacci Patterns This is arguably the most complete harmonic price formation auto-recognition indicator you can find for the MetaTrader Platform. It detects 19 different patterns, takes fibonacci projections as seriously as you do, displays the Potential Reversal Zone (PRZ) and finds suitable stop-loss and take-profit levels. [ Installation Guide | Update Guide | Troubleshooting | FAQ | All Products ] It detects 19 different harmonic pri
    MTF Supply Demand Zones MT5
    Georgios Kalomoiropoulos
    5 (1)
    자동화된 수요 및 공급 구역의 차세대. 모든 차트에서 작동하는 새롭고 혁신적인 알고리즘. 모든 구역은 시장의 가격 움직임에 따라 동적으로 생성됩니다. 두 가지 유형의 경고 --> 1)가격이 영역에 도달할 때 2)새로운 영역이 형성될 때 당신은 더 이상 쓸모없는 지표를 얻을 수 없습니다. 입증된 결과로 완벽한 거래 전략을 얻을 수 있습니다.     새로운 기능:     가격이 공급/수요 영역에 도달하면 경고     새로운 공급/수요 구역이 생성되면 알림     푸시 알림 알림     핍의 영역 너비 레이블     기동특무부대에 한 번 더 시간이 주어집니다. 따라서 현재보다 위의 2개의 시간 프레임 대신 현재보다 높은 3개의 시간 프레임을 볼 수 있습니다.     Alerts/Zones/MTF 기능을 활성화/비활성화하는 버튼 당신이 얻는 이점:     거래에서 감정을 제거하십시오.     거래 항목을 객관화하십시오.     높은 확률 설정을 사용하여 수익
    The   Time_Price_SQ9_Degree   indicator is based on the 9 Gann square. Using this indicator, you can identify strong time and price zones. The indicator displays the levels as a degree value. The degrees can be set in the settings. After launching, the MENU button appears. If it is highlighted, it can be moved to any point on the graph, and after double-clicking on it, it stops being highlighted and menu buttons appear. To hide the menu, just double-click on the button, it will become highlight
    프리시전 트레이딩 시스템의 로저 메드칼프에 의한 프리시전 인덱스 오실레이터 (Pi-Osc) 버전 2는 차트에 신속하게 로드되도록 주의 깊게 다시 코딩되었으며 경험을 향상시키기 위해 몇 가지 다른 기술적 개선 사항이 통합되었습니다. Pi-Osc는 정확한 거래 타이밍 신호를 제공하도록 개발되었으며 시장이 모든 사람의 스톱을 청산하기 위해 가야 하는 극도의 고갈 지점을 찾는 데 목적이 있습니다. 이 제품은 극단적인 지점이 어디에 있는지 알고 있는 고전적인 문제를 해결하며 트레이더로서의 삶을 훨씬 간단하게 만듭니다. 이것은 업계 표준 오실레이터와는 상당히 다른 강력한 차이점을 가지고 있는 고도로 복잡한 합의 지표입니다. 사용하는 기능 중 일부는 수요 지수, 자금 흐름, RSI, 스토캐스틱, 패턴 인식, 거래량 분석, 표준 편차 극단점 및 다양한 길이에서 위와 유사한 변형을 갖습니다. 미숙한 눈에는 다른 오실레이터와 비슷해 보일 수 있지만 RSI 또는 모멘텀과 같은 다른 오실레이
    PZ Mean Reversion MT5
    PZ TRADING SLU
    3 (2)
    평균 회귀 거래에 대한 전문적이고 정량적인 접근 방식을 구현하는 고유한 지표입니다. 이는 가격이 예측 가능하고 측정 가능한 방식으로 평균으로 전환되고 반환된다는 사실을 이용하여 비정량적 거래 전략을 훨씬 능가하는 명확한 진입 및 퇴장 규칙을 허용합니다. [ Installation Guide | Update Guide | Troubleshooting | FAQ | All Products ] 명확한 거래 신호 놀랍도록 쉬운 거래 사용자 정의 가능한 색상 및 크기 성능 통계 구현 대부분의 거래 전략을 능가합니다. 적절한 SL 및 TP 레벨을 표시합니다. 이메일/음향/시각 알림을 구현합니다. 작동 원리 이 지표는 더 높은 기간에서 완전히 사용자 정의 가능한 이동 평균 주변의 표준 편차를 측정하고 추세 추종 접근 방식을 사용하여 정확하게 거래를 찾습니다. 거래는 현재 차트의 가격 동작을 살펴보고 선택한 더 높은 기간에서 계산된 평균 가격대로 가격이 돌아오면 닫힙니다. 코딩 방식 때문에 지
    Basic Harmonic Patterns Dashboard MT5
    Mehran Sepah Mansoor
    4.13 (8)
    이 대시보드는 선택한 심볼에 대해 사용 가능한 최신 고조파 패턴을 표시하므로 시간을 절약하고 더 효율적으로 사용할 수 있습니다 /   MT4 버전 . 무료 인디케이터:   Basic Harmonic Pattern 인디케이터 열 Symbol :   선택한 심볼이 나타납니다 Trend :   강세 또는 약세 Pattern :   패턴 유형(가틀리, 나비, 박쥐, 게, 상어, 사이퍼 또는 ABCD) Entry :   진입 가격 SL:   스톱로스 가격 TP1:   1차 테이크프로핏 가격 TP2:   2차 테이크프로핏 가격 TP3:   3차 테이크프로핏 가격 Current price:   현재 가격 Age (in bars):   마지막으로 그려진 패턴의 나이 주요 입력 Symbols :   "28개 주요 통화쌍" 또는 "선택한 심볼" 중에서 선택합니다. Selected Symbols :   쉼표로 구분하여 모니터링하려는 원하는 심볼("EURUSD,GBPUSD,XAUUSD")을 선택
    우선적으로, 이 거래 도구는 전문적인 거래에 이상적인 비-다시 그리기 및 지연되지 않는 지표입니다.  온라인 강좌, 사용자 매뉴얼 및 데모. 스마트 가격 액션 컨셉트 인디케이터는 신규 및 경험 많은 트레이더 모두에게 매우 강력한 도구입니다. Inner Circle Trader Analysis 및 Smart Money Concepts Trading Strategies와 같은 고급 거래 아이디어를 결합하여 20가지 이상의 유용한 지표를 하나로 결합합니다. 이 인디케이터는 스마트 머니 컨셉트에 중점을 두어 대형 기관의 거래 방식을 제공하고 이동을 예측하는 데 도움을 줍니다.  특히 유동성 분석에 뛰어나 기관이 어떻게 거래하는지 이해하는 데 도움을 줍니다. 시장 트렌드를 예측하고 가격 변동을 신중하게 분석하는 데 탁월합니다. 귀하의 거래를 기관 전략에 맞추어 시장의 동향에 대해 더 정확한 예측을 할 수 있습니다. 이 인디케이터는 시장 구조를 분석하고 중요한 주문 블록을 식별하고 다양
    FX Dynamic: 맞춤형 ATR 분석으로 변동성과 트렌드를 파악하세요 개요 FX Dynamic 는 Average True Range(ATR) 계산을 활용하여 트레이더에게 일간 및 일중 변동성에 대한 뛰어난 인사이트를 제공하는 강력한 도구입니다. 80%, 100%, 130%와 같은 명확한 변동성 임계값을 설정함으로써 시장이 평소 범위를 초과할 때 빠르게 경고를 받고, 유망한 수익 기회를 재빨리 식별할 수 있습니다. FX Dynamic 는 브로커의 시간대를 인식하거나 수동으로 조정할 수 있으며, 변동성 측정 기준을 일관되게 유지하며, MetaTrader 플랫폼과 완벽하게 연동되어 실시간 분석을 지원합니다. 1. FX Dynamic이 트레이더에게 매우 유용한 이유 실시간 ATR 인사이트 • 하루 및 일중 변동성을 한눈에 모니터링하세요. ATR의 80%, 100%, 130% 임계값이 도달 또는 초과되면, 시장의 중요한 지점에 있음을 알 수 있습니다. • 변동성이 완전히 폭발하기
    PZ Support Resistance MT5
    PZ TRADING SLU
    4.17 (6)
    Unlock key market insights with automated support and resistance lines Tired of plotting support and resistance lines? This is a multi-timeframe indicator that detects and plots supports and resistance lines in the chart with the same precision as a human eye would. As price levels are tested over time and its importance increases, the lines become thicker and darker, making price leves easy to glance and evaluate. [ Installation Guide | Update Guide | Troubleshooting | FAQ | All Products ] Boos
    Legend mt5
    Vladyslava Shaviernieva
    This is an indicator that includes the best basic forex indicators , without redrawing. Based on this data, a sell or buy signal is generated. It does not disappear anywhere after the signal, which gives us the opportunity to see the results on the history. It can be used on any currency pair, crypto, metals, stocks It is best used on an hourly chart, but other periods are also acceptable. The best results for the period H1,H4,daily If customers have any questions, I will answer them and af
    Auto Order Block with break of structure based on ICT and Smart Money Concepts (SMC) Futures Break of Structure ( BoS )             Order block ( OB )            Higher time frame Order block / Point of Interest ( POI )    shown on current chart           Fair value Gap ( FVG ) / Imbalance   -  MTF      ( Multi Time Frame )    HH/LL/HL/LH  -  MTF      ( Multi Time Frame )  Choch  MTF      ( Multi Time Frame )  Volume Imbalance     ,  MTF          vIMB Gap’s Power of 3 Equal High / Low’s  
    Atomic Analyst MT5
    Issam Kassas
    4.32 (19)
    우선적으로 언급할 점은이 거래 지표가 다시 그리지 않고 지연되지 않으며 이를 통해 수동 및 로봇 거래 모두에 이상적이라는 점입니다. 사용자 매뉴얼: 설정, 입력 및 전략. Atomic Analyst는 가격의 강도와 모멘텀을 활용하여 시장에서 더 나은 이점을 찾는 PA Price Action Indicator입니다. 고급 필터를 장착하여 잡음과 거짓 신호를 제거하고 거래 잠재력을 높이는 데 도움이 됩니다. 복잡한 지표의 다중 레이어를 사용하여 Atomic Analyst는 차트를 스캔하고 복잡한 수학적 계산을 간단한 신호와 색상으로 변환하여 초보 트레이더가 이해하고 일관된 거래 결정을 내릴 수 있도록합니다. "Atomic Analyst"는 새로운 및 경험이 풍부한 트레이더를위한 종합적인 거래 솔루션입니다. 프리미엄 지표와 최고 수준의 기능을 하나의 거래 전략에 결합하여 모든 종류의 트레이더에 대한 다재다능한 선택지가되었습니다. 인트라데이 거래 및 스캘핑 전략 : 빠르고 정확한 일일
    Trend Hunter MT5
    Andrey Tatarinov
    5 (2)
    Trend Hunter 는 Forex, 암호화폐 및 CFD 시장에서 작업하기 위한 추세 지표입니다. 이 지표의 특별한 특징은 가격이 추세선을 약간 돌파할 때 신호를 변경하지 않고 자신있게 추세를 따른다는 것입니다. 표시기는 다시 그려지지 않으며 막대가 닫힌 후에 시장 진입 신호가 나타납니다. 추세를 따라 이동할 때 표시기는 추세 방향에 대한 추가 진입점을 표시합니다. 이러한 신호를 바탕으로 작은 StopLoss로 거래할 수 있습니다. Trend Hunter 는 정직한 지표입니다. 표시 신호 위로 마우스를 가져가면 신호의 잠재적 이익과 가능한 중지가 표시됩니다. 새로운 신호가 나타나면 다음 알림을 받을 수 있습니다. 알리다 푸시 알림 이메일로 알림 텔레그램 알림 차트 스크린샷도 텔레그램으로 전송되므로 거래 결정을 내리기 위해 단말기를 열 필요가 없습니다. 표시 신호는 텔레그램 채널 https://www.mql5.com/ko/market/product/11085#!tab=com
    Black Dragon indicator mt5
    Ramil Minniakhmetov
    4.83 (60)
    추세 감지 표시기는 모든 전략을 보완하며 독립적인 도구로도 사용할 수 있습니다.   장점 사용하기 쉽고 불필요한 정보로 차트에 과부하가 걸리지 않습니다. 모든 전략에 대한 필터로 사용할 수 있습니다. 기본 제공 수준의 동적 지원 및 저항이 있어 이익을 얻고 손절매를 설정하는 데 모두 사용할 수 있습니다. 촛대가 닫힌 후에도 표시기는 색상을 변경하지 않습니다.  주식 시장, 지수, 석유, 금 및 모든 시간대에서 작동합니다. 토스트 알림, 이메일 알림, 푸시 알림 및 소리 알림 기능이 있습니다. 내 다른 개발은 여기에서 찾을 수 있습니다:   https://www.mql5.com/ko/users/mechanic/seller 입력 매개변수 Alert - 켜기/끄기. 알리다; Push Notification - 켜기/끄기. 푸시 알림; Mail - 켜기/끄기 이메일 알림; Fibo 1,2,3,4,5,6,7,11,21,31,41,51,61,71 - 동적 지원 및 저항 수준 설정.
    제작자의 제품 더 보기
    OctoGold
    Martin Slacka
    5 (1)
    STRATEGY DETAILS ______________________________________________________________________________________________________________ Multistrategies expert advisor. It has 16 strategies which bring more stability in performance. The lot of strategies are trend based because gold is growing till all history.  I hope that massive bactest and massive training data from different brokers will make this expert advisor profitable in next years. It is no miracle expert advisor in some periods there are some
    PropHelper
    Martin Slacka
    4.21 (14)
    STRATEGY DETAILS ______________________________________________________________________________________________________________ This is multiple strategy expert advisor. 3 trend strategies,1 big move strategy,1 reversal strategy. Multiple strategies make Expert advisor more stable and more better for Propfirms.There are lot od setting possibilities on different market conditions. Expert advisor have tendency be profitable in trend market conditions and stagnation or slightly loses in high volati
    FREE
    ScalpingMachine
    Martin Slacka
    3.25 (4)
    STRATEGY DETAILS ______________________________________________________________________________________________________________ Indicators used: Bollinder Bands+Bulls power+Momentum+MACD Symbol: XAUUSD Timeframe: M1 Recomended: M1 No Dangerous Strategies Take profit: Fixed Stop loss: Fixed Posibble to set other money protections Possible to set Newsfilter Trading frequency: Moderate _______________________________________________________________________________________________________________ L
    FREE
    GoldUPtrend
    Martin Slacka
    5 (5)
    Hi this is my first product STRATEGY DETAILS ______________________________________________________________________________________________________________ This is trend strategy,there is no fixed take profit that means that it can have lot of gain potential in strong trend market moves. Fixed stop loss and exit conditions minimalize loses when false signal occurs.It no opens trades often and positions are open usually more than one day Indicators used: Moving average+ADX+RSI+Bears power+Demarke
    FREE
    STRATEGY DETAILS ______________________________________________________________________________________________________________ This strategy is useful for propchalenges and real money deposits. The lot of indicators give more stability in performance but it is no miracle strategy, there can be periods of stagnation or drops Indicators used: Alligator+Alligator lips,teeth growth+Demarker+MACD(signal line crossover)+Moving average+ADX+Directional indicators Symbol: XAUUSD Timeframe: M5,M15,M30 Re
    Goldenroad
    Martin Slacka
    4.67 (3)
    STRATEGY DETAILS ______________________________________________________________________________________________________________ Indicators used: Wiliams percent range+Moving average+RVI+Awesome Oscilator+Accelerator Oscilator+Alligator+ADX+Demarker Symbol: XAUUSD Timeframe: M5,M15 Recomended: M5 No Dangerous Strategies Take profit: Fixed+Exit indicators(Envelopes+ Candle patterns) Stop loss: Fixed+Exit indicators( Envelopes, +Candle patterns ) Trading frequency: Moderate Posibble to set other m
    FREE
    AurumCircuit
    Martin Slacka
    Symbol: XAUUSD Recomended Timeframe: M15 No dangerous strategies  Fixed  Stop loss Multiple Strategies Recomended settings: deafult Recomended lot size: Normal risk Deposit    Lot size 1000€.       0.02 2000€.       0.04 5000€.       0.1 10000€.     0.2 Low risk Deposit    Lot size 1000€.       0.01 2000€.       0.02 5000€.       0.05 10000€.     0.1 High risk Deposit    Lot size 1000€.       0.03 2000€.       0.06 5000€.       0.15 10000€.     0.3 If you do prop challenge please dont use hight
    EternityEdge
    Martin Slacka
    Symbol: XAUUSD Recomended Timeframe: M5 No dangerous strategies  Fixed  Stop loss Recomended settings: deafult Recomended lot size: Normal risk Deposit    Lot size 1000€.       0.01 2000€.       0.02 5000€.       0.03 10000€.     0.04 Low risk Deposit    Lot size 1000€.       0.01 2000€.       0.01 5000€.       0.02 10000€.     0.03 High risk Deposit    Lot size 1000€.       0.01 2000€.       0.02 5000€.       0.03 10000€.     0.06 If you do prop challenge please dont use hight risk and set mone
    Volume Profile Indicator – User Guide  Description: The Volume Profile Indicator is a powerful tool designed for MetaTrader 5. It visualizes market activity using volume distribution across price levels, showing: Histogram of volume at each price bin POC (Point of Control) – the price with the highest traded volume Value Area – the range covering a configurable percentage of volume (e.g. 70%) Support levels: Min, Max, and Pivot Average tick size for BUY and SELL movements  Inputs and Parameters:
    FREE
    GoldenTouch
    Martin Slacka
    The higher timeframes minimalize news, and possible  big market manipulations, The multiple strategies based on different rules bring more stability in performance. This Expert advisor indeed 7 strategies,  the most strategies are trend based because there is high longterm predicton that gold price will go up in next years.For more experienced traders is highly recommended use Smart Money Concept for better and more profitable exit Entry indiactors used-William percent ranges, Moving averages (E
    FREE
    JapanSniper
    Martin Slacka
    There are some main characteristicks of my product Symbols: USDJPY- recomended other JPY pairs - please try in backtest  Timeframe: M1,M5,M15 Recomended: M5 Money management: Fix TP and SL Past performance: -low drawdowns -stability Check screenshots Backtest 2020- 2024 till now Recomended Lot size settings: Deposit.         Lotsize 1000€.            0.01 2000€.            0.02 5000€.            0.05 10000€.          0.1 You can Multiply lot size by 2x (more risky) Recomended other settings: de
    FREE
    EAtlas
    Martin Slacka
    Symbol: EURUSD Timeframe:M15 Recomended: M15 No dangerous strategies  Fixed  Stop loss Recomended settings: deafult Multiple strategies Recomended lot size: Deposit    Lot size 1000€.       0.01 2000€.       0.02 5000€.       0.05 10000€.     0.1 Backtest 2020-2024 till now  Please use good risk and money manegement Possible to set money and account protections If you need help or other recomendations please ask me More info:   https://www.mql5.com/en/users/martin6223 Check my other products: Ki
    FREE
    New HopE
    Martin Slacka
    Symbols: USDJPY- recomended other JPY pairs - please try in backtest  Timeframe: M5 Recomended: M5 Money management: Fix TP and SL Backtest 2020- 2024 till now ,lot size:0.2 Recomended Lot size settings: Deposit.         Lotsize 1000€.            0.02 2000€.            0.04 5000€.            0.1 10000€.          0.2 You can Multiply lot size by 1,5x (more risky) Recomended other settings: deafult  Note: Please use good money management If you need help or other recomendations please ask me More
    FREE
    EURfrozen
    Martin Slacka
    Symbol: EURUSD Timeframe: M1,M5,M15 Recomended: M5 No dangerous strategies  Fixed TP and SL No trade very often Recomended settings: deafult Recomended lot size: Deposit    Lot size 1000€.       0.02 2000€.       0.04 5000€.       0.1 10000€.     0.2 Backtest 2020-2024 till now  Please use good risk and money manegement Possible to set money and account protections If you need help or other recomendations please ask me More info:   https://www.mql5.com/en/users/martin6223 Check my other products
    FREE
    MicroChip
    Martin Slacka
    STRATEGY DETAILS ______________________________________________________________________________________________________________ This is combination  of 5 different strategies with different entry and exit rules. The different strategies make performance more stable and it opens trades more often. Some of strategies have fixed take profit and some no. This differences make stability, and smooth performance in different market conditions, but overall is more trend oriented Symbol: USDJPY,AUDJPY,NZ
    Peacock
    Martin Slacka
    Symbols: USDJPY- recomended Recomended: M15 Others Timeframes and JPY pairs - you can try backtest Combination of my best USDJPY M15 Strategies Money management: Fix TP and SL Backtest 2021- 2024 till now ,lot size:0.2 Recomended Lot size settings: Deposit.         Lotsize 1000€.            0.02 2000€.            0.04 5000€.            0.1 10000€.          0.2 You can Multiply lot size by 1,5x (more risky) or divide 2 (Low risk) Recomended other settings: deafult  Note: Please use good money man
    TomCat
    Martin Slacka
    STRATEGY DETAILS ______________________________________________________________________________________________________________ The strategy is based on multiple well balanced indicators which are optimalized on different market conditions, but this strategy is no miracle there are still periods of stagnation or slightly drops. Trades are open only few times per month usually(5-12 times) and trades are open more days. The strategy is more trend oriented. Indicators used: RSI+Comodity chanel inde
    KingMoves
    Martin Slacka
    STRATEGY DETAILS ______________________________________________________________________________________________________________ indicators:RSI+RSI levels+Bull Power level+Comodity channel index+MACD+Moving average+Entry time filter Symbol: EURUSD + possibble to set and optimize for other currency pairs Timeframe: H1  + possibble to set and optimize for other currency pairs No Dangerous Strategies  Take profit: Fixed+Exit indicators(Envelopes + Candle formation + Momentum + William Percent Range)
    QueenMoves
    Martin Slacka
    STRATEGY DETAILS ______________________________________________________________________________________________________________ Entry indicators:MACD+Aligator+RSI+Bull power+Moving averages+Daily points Symbol: GBPUSD + possibble to set and optimize for other currency pairs Timeframe: H1  + possibble to set and optimize for other currency pairs No Dangerous Strategies  Take profit: Fixed+Exit indicators(Envelopes + Bollinder bands) Stop loss: Fixed+Exit indicators( Envelopes + Bollinder bands )
    필터:
    리뷰 없음
    리뷰 답변