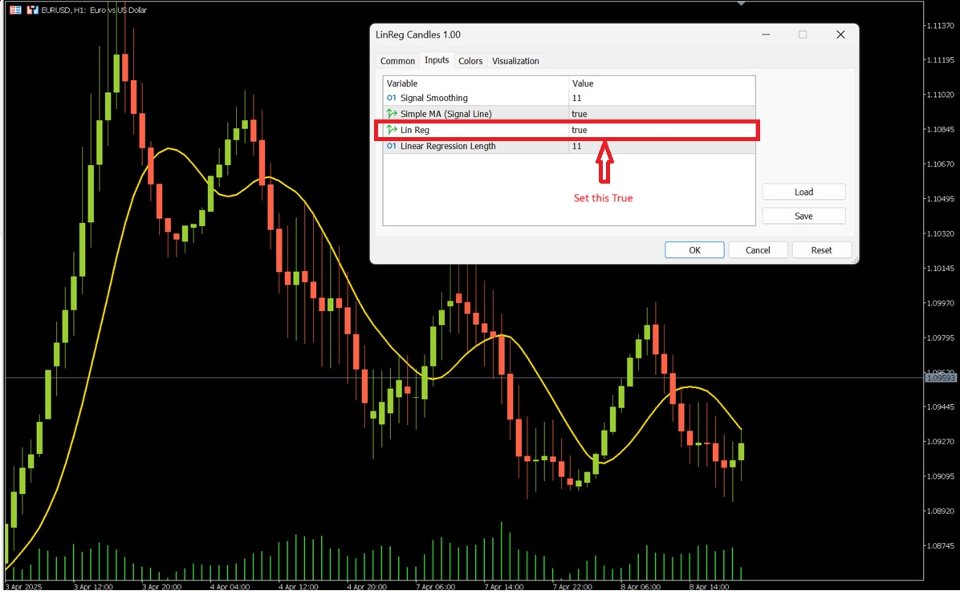
Linear Regression Line
- 지표
- Mohammad Taher Halimi Tabrizi
- 버전: 1.0
- 활성화: 5
What is Linear Regression?
Linear regression is a statistical method used to model the relationship between price and time. In forex trading, it helps traders identify trends, potential reversals, and areas of support and resistance.
Uses of Linear Regression in Forex Trading
-
Trend Identification
-
The regression line acts as a dynamic trendline, showing whether the market is trending upward or downward.
-
Traders can use the slope of the regression line to measure trend strength.
-
-
Support and Resistance Levels
-
Linear regression channels (standard deviation bands around the regression line) act as dynamic support and resistance zones.
-
Price touching the upper or lower band may indicate overbought or oversold conditions.
-
-
Mean Reversion Trading
-
If price moves too far from the regression line, traders may anticipate a return to the mean.
-
This strategy is useful in ranging markets.
-
-
Breakout Confirmation
-
A steeply rising or falling regression line suggests a strong trend, increasing confidence in breakouts.
-
If price consolidates near the regression line, it may signal an upcoming breakout.
-
-
Filtering False Signals
-
The regression line can help traders differentiate between real trends and short-term noise.
-
Helps confirm other indicators like moving averages or RSI.
-
How to Apply Linear Regression in Forex Trading
-
Use regression channels to set take profit and stop loss levels.
-
Combine with other tools like Fibonacci retracements for confluence.
-
Avoid relying solely on regression; use it alongside price action analysis.


