RFX Forex Strength Meter
- 지표
- Rasoul Mojtahedzadeh
- 버전: 1.20
- 업데이트됨: 18 4월 2023
- 활성화: 10
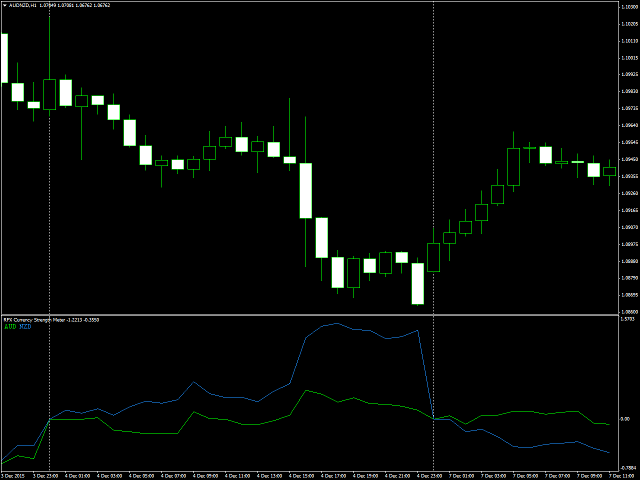
RFX Forex Strength Meter is a powerful tool to trade 8 major currencies in the Forex market,
- U.S. Dollar (USD)
- European Euro (EUR)
- British Pound (GBP)
- Swiss Franc (CHF)
- Japanese Yen (JPY)
- Australian Dollar (AUD)
- Canadian Dollar (CAD)
- New Zealand Dollar (NZD)
The indicator calculates the strength of each major currency using a unique and accurate formula starting at the beginning of each trading day of your broker. Any trading strategy in the Forex market can be greatly improved by observing the strength of the major currencies.
Input Parameters
- Maximum Look Back Days: A positive integer number that indicates the maximum past days over which the past currency strength will be shown.
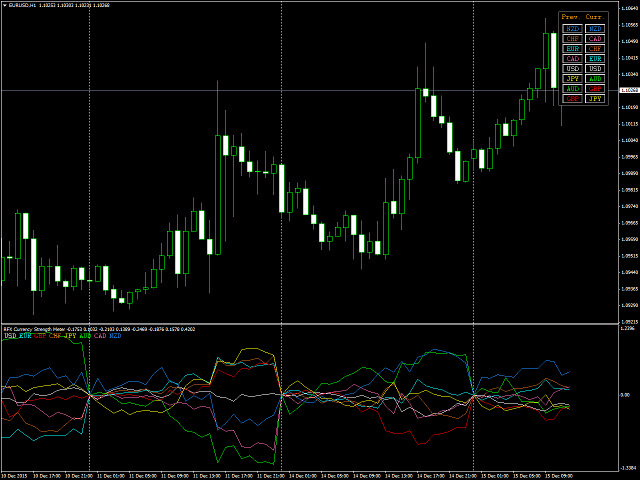
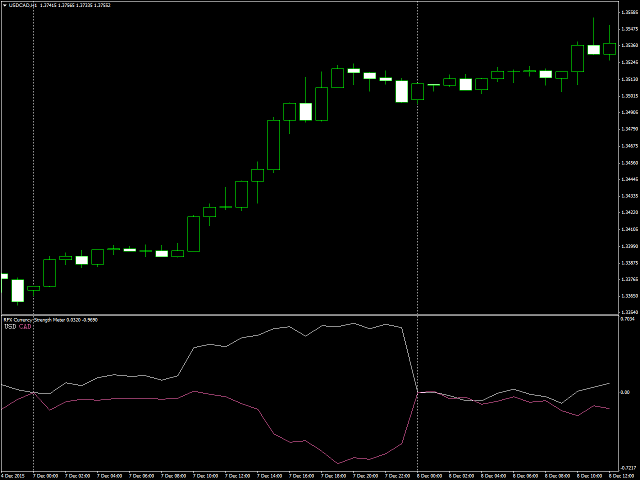
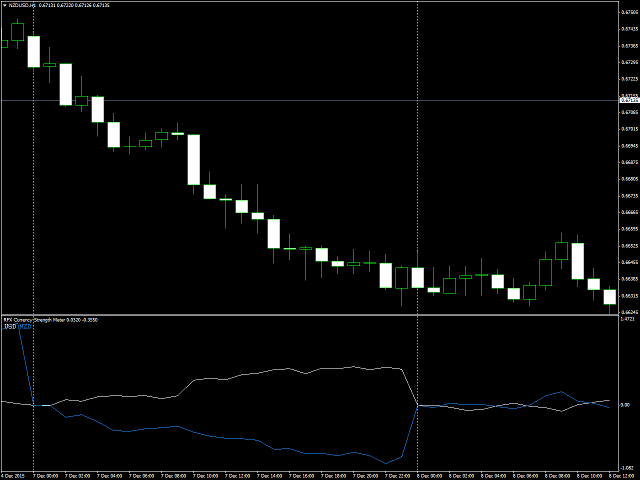
- Only Show Chart's Currencies: If this option is set to Yes, the indicator only shows the strength of the currencies that the indicator is attached to. For example, if you attach the indicator to an EURUSD chart, the indicator only shows the strength of EUR and USD. If this option is set to No, the indicator shows all the strength of all the currencies which are enabled below.
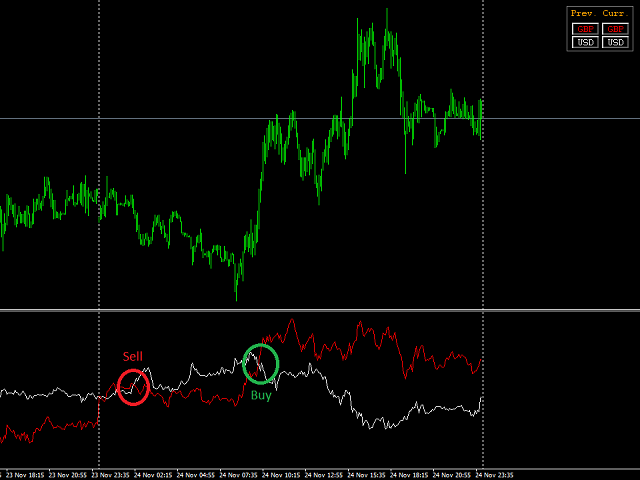
- Show Panel?: If this option is set to Yes, and above option is set to No, a small panel showing the previous and current bars strength will be shown on the top right of the chart.
- Send Alert at Power Change?: If this option is set to Yes and the panel is enabled, the indicator generates alerts when the most the place of the strongest/weakest currency on the current column changes where you have an opportunity to trade the corresponding pair.
- Show USD: If this option is set to Yes, the indicator will show the strength of USD.
- Show EUR: If this option is set to Yes, the indicator will show the strength of EUR.
- Show GBP: If this option is set to Yes, the indicator will show the strength of GBP.
- Show CHF: If this option is set to Yes, the indicator will show the strength of CHF.
- Show JPY: If this option is set to Yes, the indicator will show the strength of JPY.
- Show AUD: If this option is set to Yes, the indicator will show the strength of AUD.
- Show CAD: If this option is set to Yes, the indicator will show the strength of CAD.
- Show NZD: If this option is set to Yes, the indicator will show the strength of NZD.
- USD Color: The color of USD strength line.
- EUR Color: The color of EURstrength line.
- GBP Color: The color of GBP strength line.
- CHF Color: The color of CHF strength line.
- JPY Color: The color of JPY strength line.
- AUD Color: The color of AUD strength line.
- CAD Color: The color of CAD strength line.
- NZD Color: The color of NZD strength line.
Important Notes:
- The indicator ONLY works on brokers who provide the 28 major pairs, which are EURUSD, GBPUSD , USDCHF, USDJPY, EURGBP, EURCHF, EURJPY, GBPCHF, GBPJPY, CHFJPY, USDCAD, EURCAD, GBPCAD, CADCHF, CADJPY, AUDCAD, AUDUSD, EURAUD, GBPAUD, AUDCHF, AUDJPY, EURNZD, NZDUSD, GBPNZD, NZDCHF, NZDJPY, AUDNZD, NZDCAD
- The indicator automatically identifies major pairs on broker who provide symbols with suffix.
- In order to show the indicator values over the past bars, the indicator NEEDS THE HISTORY of the 28 major pairs available.
In order to use the indicator you need to download the history data of all 28 major Forex currency pairs. There are two different download processes you need to do,
- For strategy tester:
- Hit key on your keyboard, it will bring up the history center window.
- Find EURUSD and click on it (it will be selected).
- Click on button on the window.
- When download is finished, go to step (1.2) and repeat the steps up to step (1.4) until the history of all 28 pairs are downloaded.
- For live/demo trading:
- Open a EURUSD chart (timeframe doesn't matter).
- Attach the script LoadAllHistory.ex4 to the chart.
- Wait for the script to finish its job.
- When download is finished, go to step (2.2) and repeat the steps up to step (2.4) until the history of all 28 pairs are downloaded.
Note: Contact me to send you the script LoadAllHistory.ex4

I've had a few days to finally test this indicator out. It's a great indicator for filtering trades and exactly what I was looking for. It does a great job of keeping you on the right side of the market. I'll be forward testing ways to optimize the usage, and post back under comments. Focusing on strong and weak currencies is an often overlooked part of trading Forex. Great job on this one Rasoul!