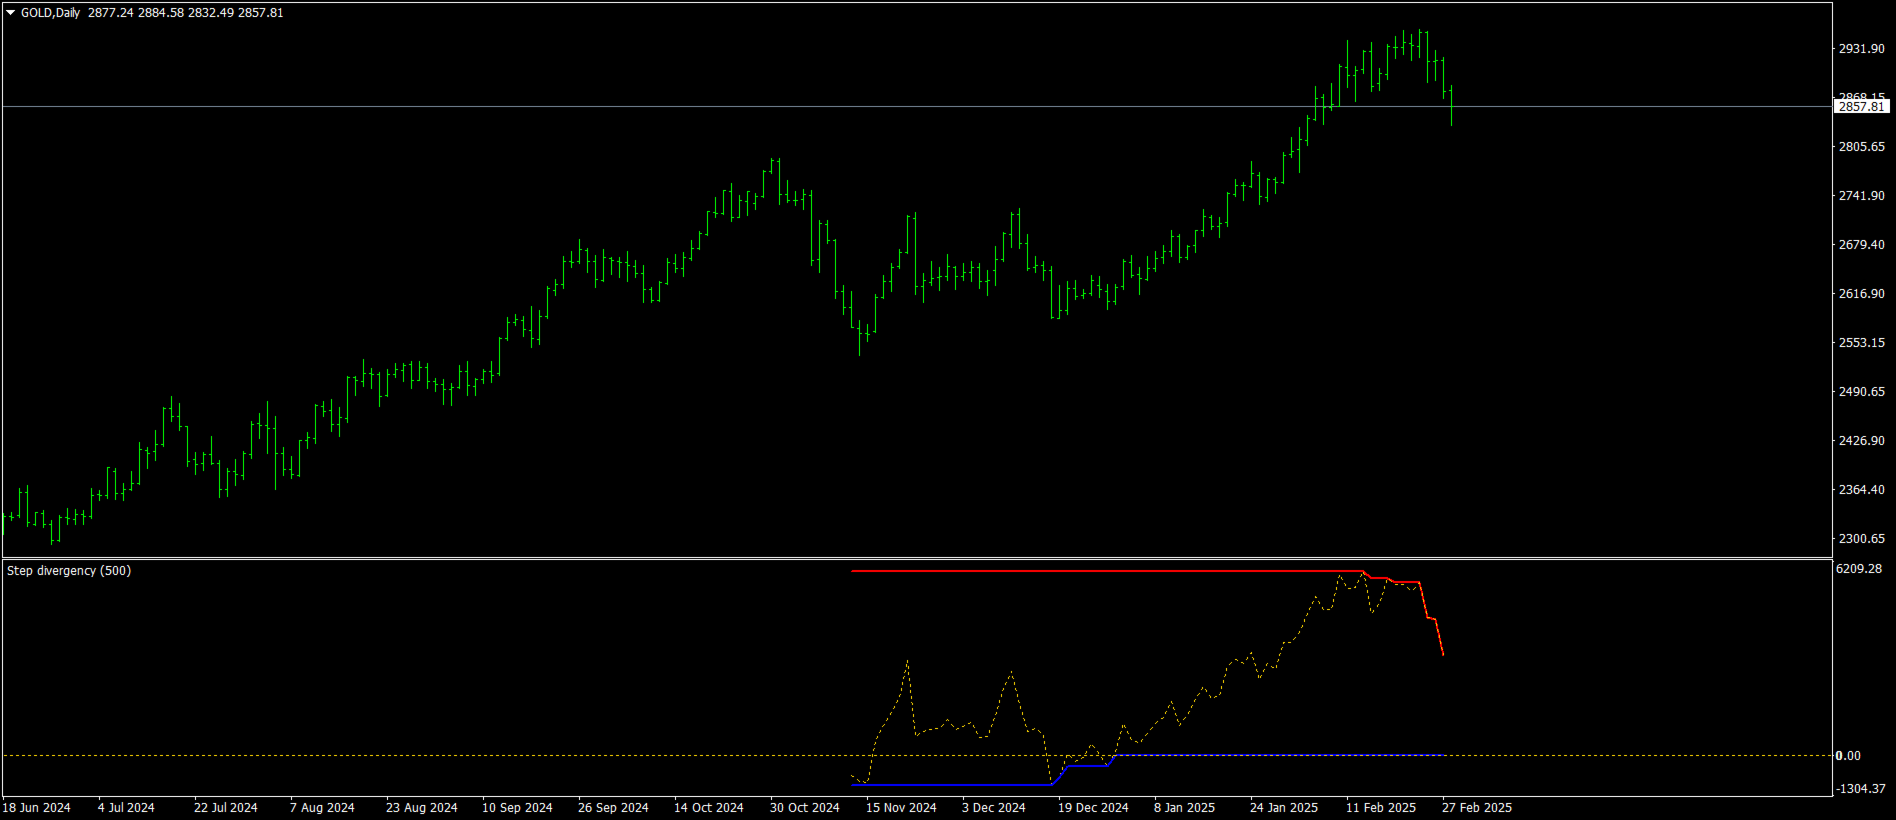
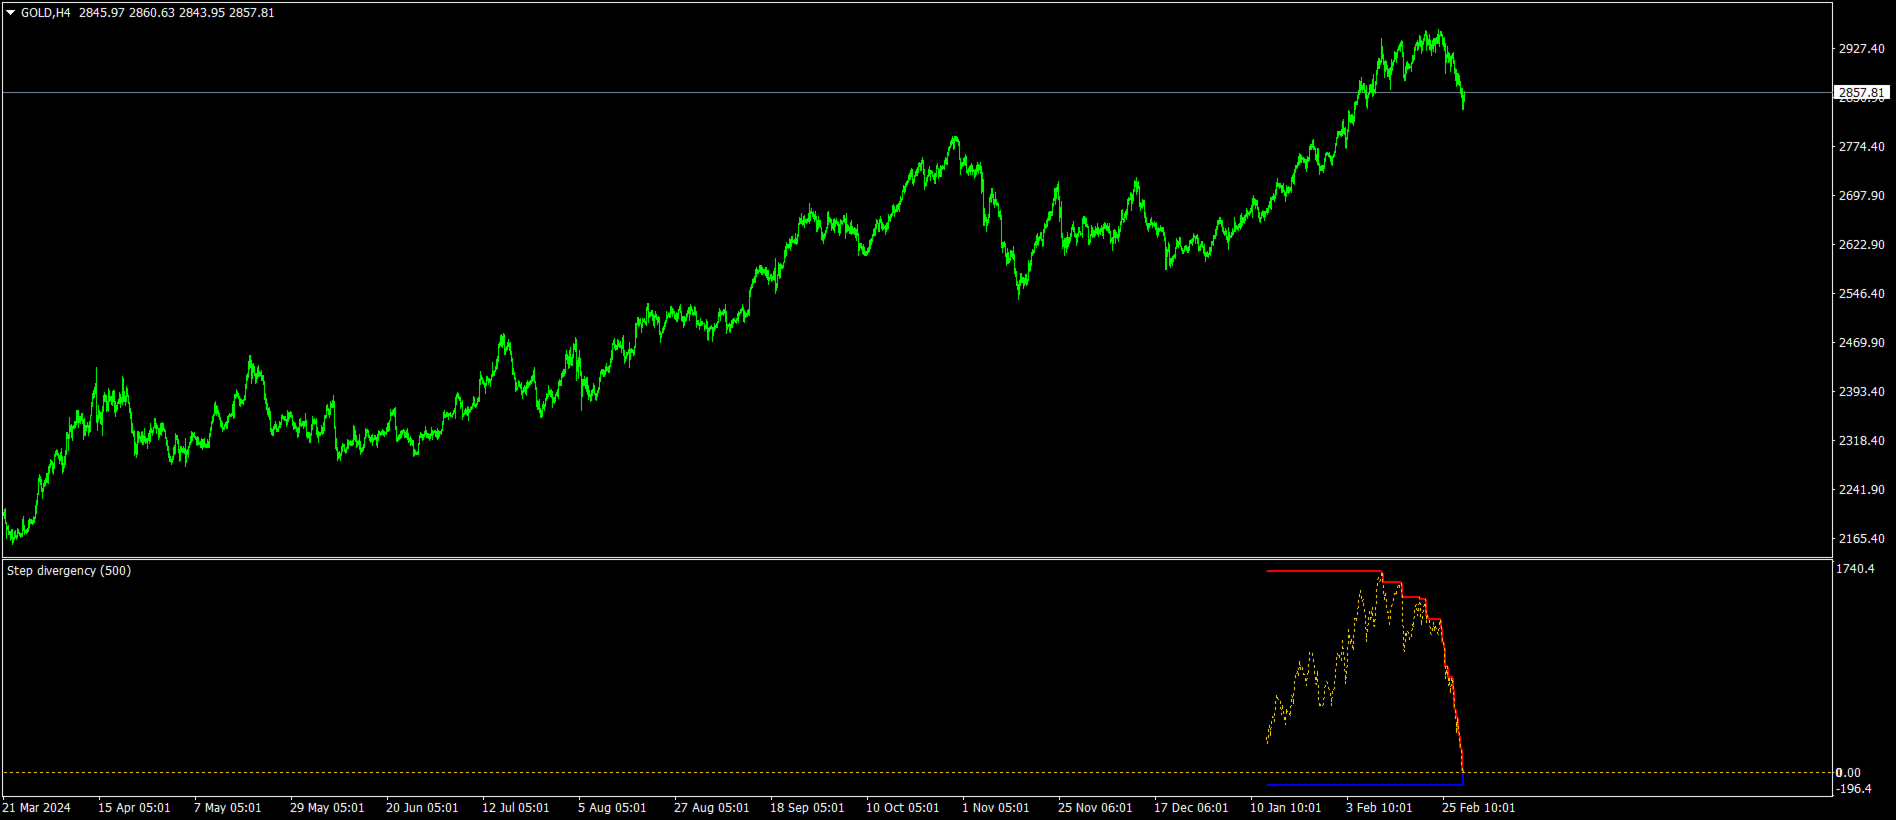
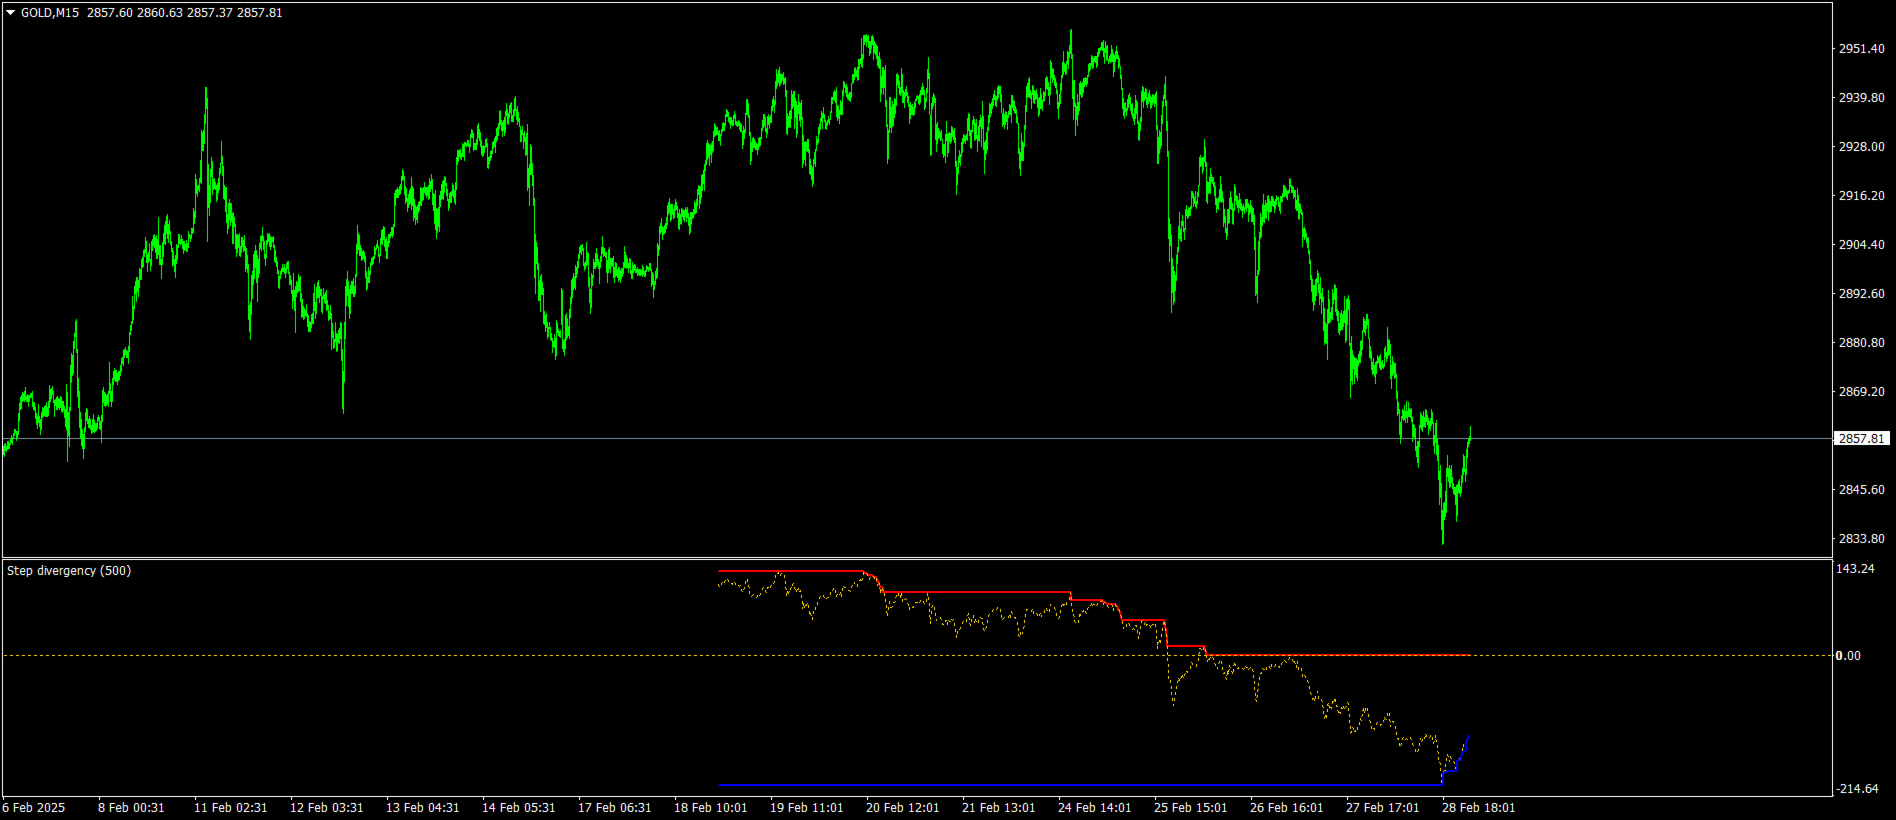
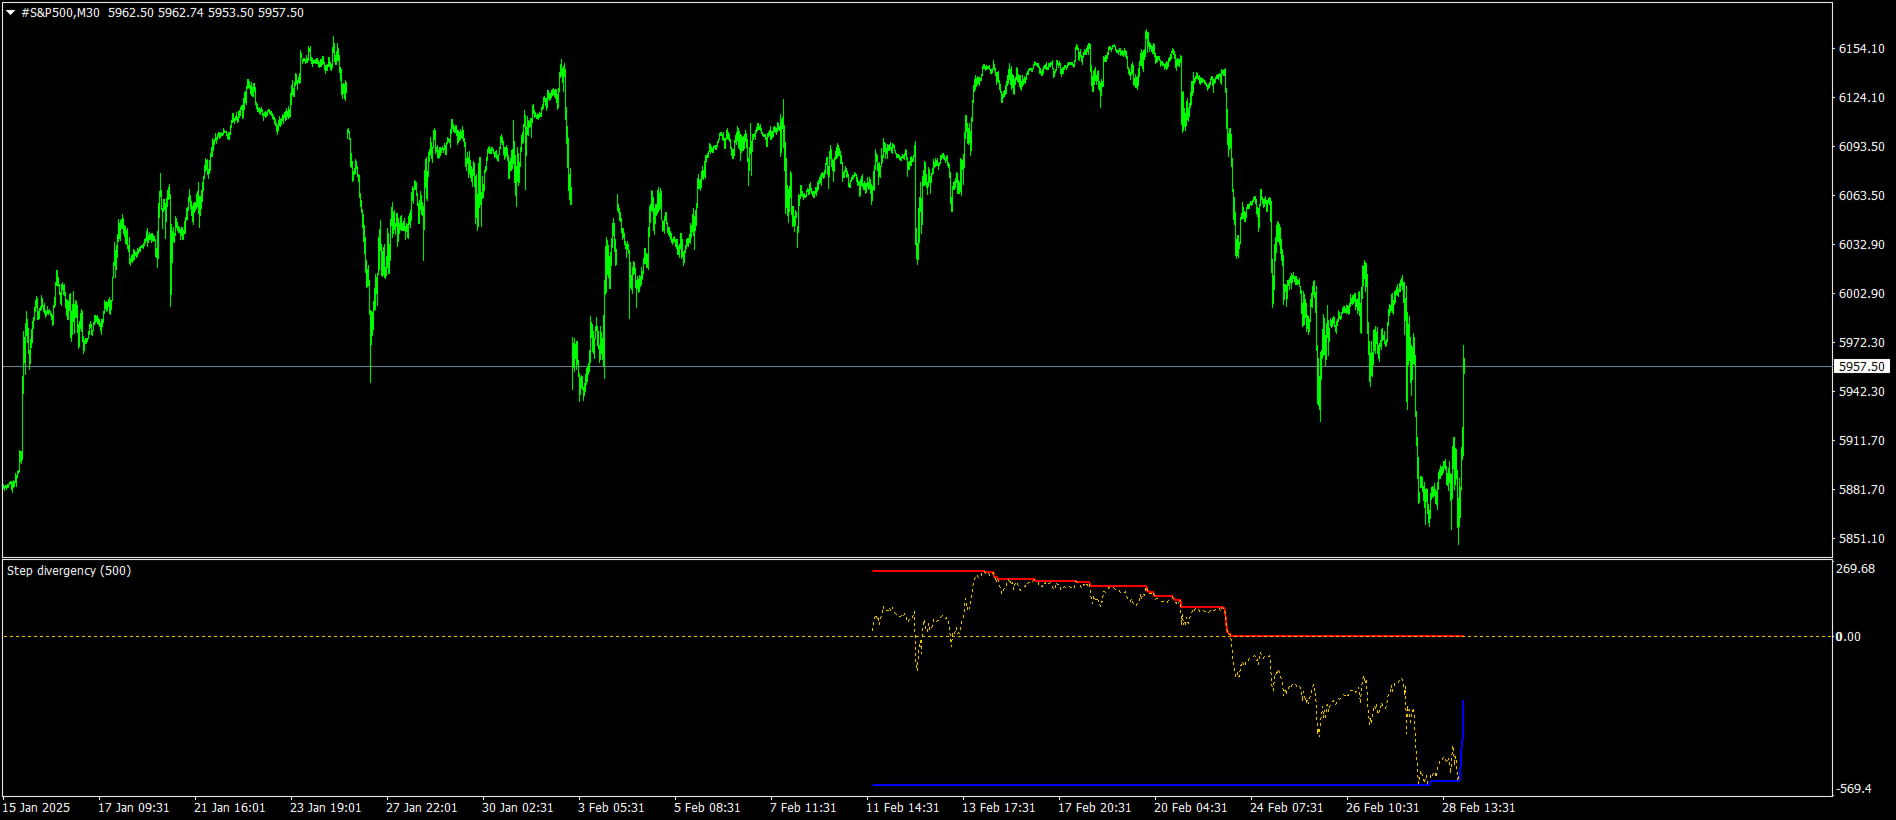
Step divergency
- 지표
- Guner Koca
- 버전: 1.8
- 업데이트됨: 5 3월 2025
- 활성화: 5
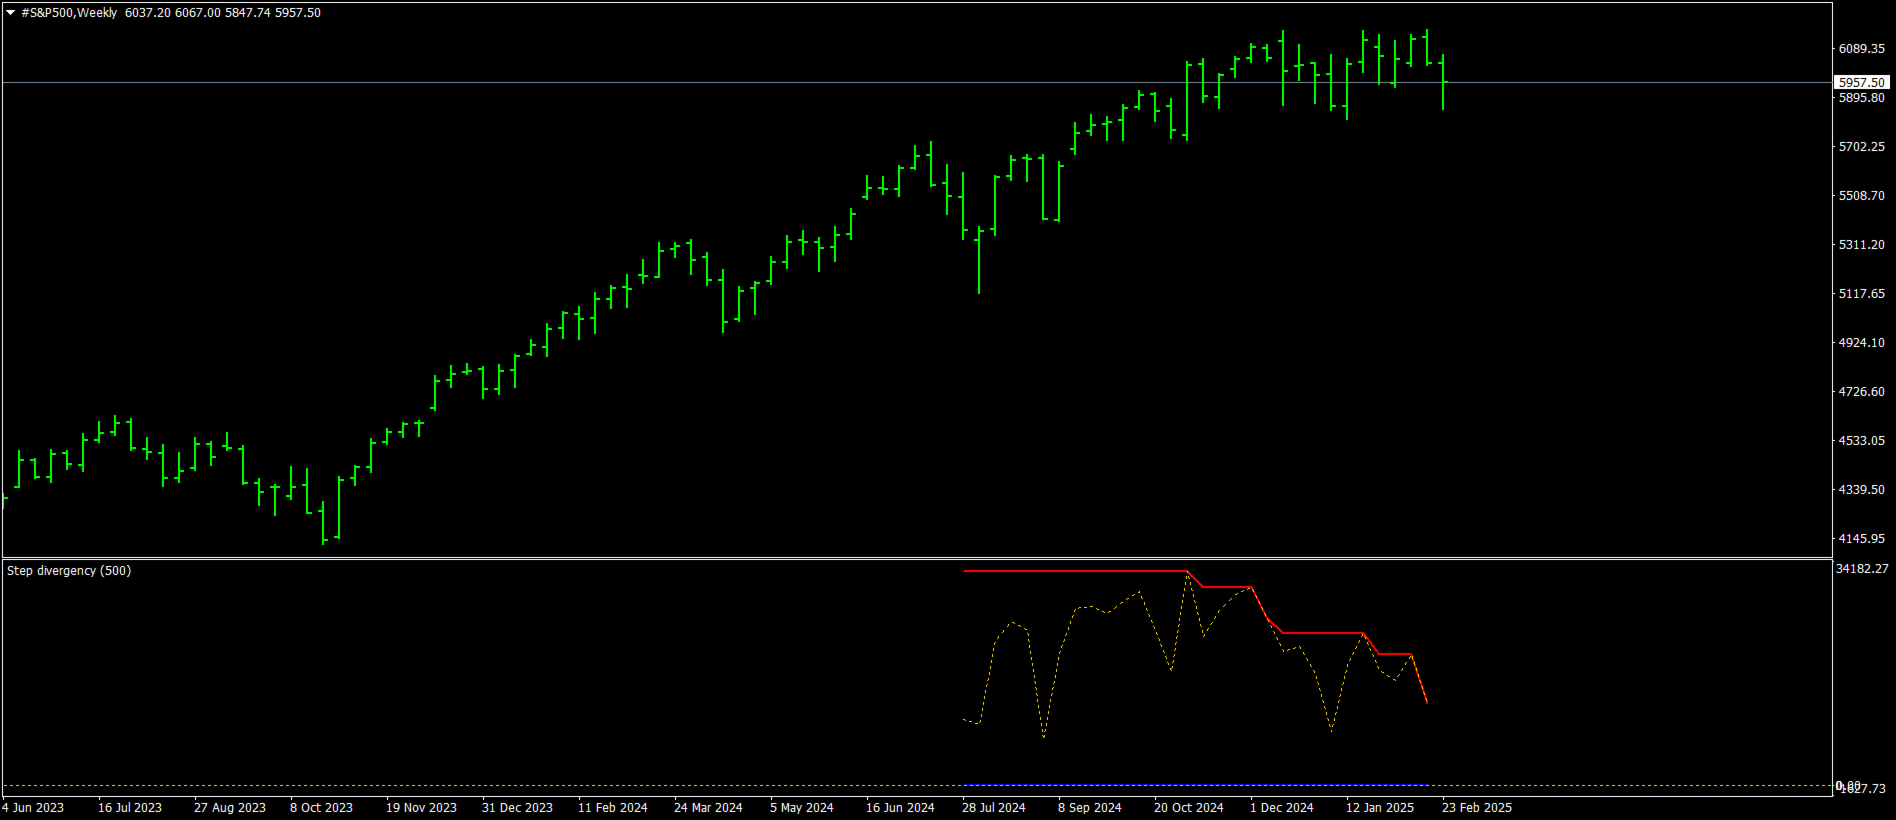
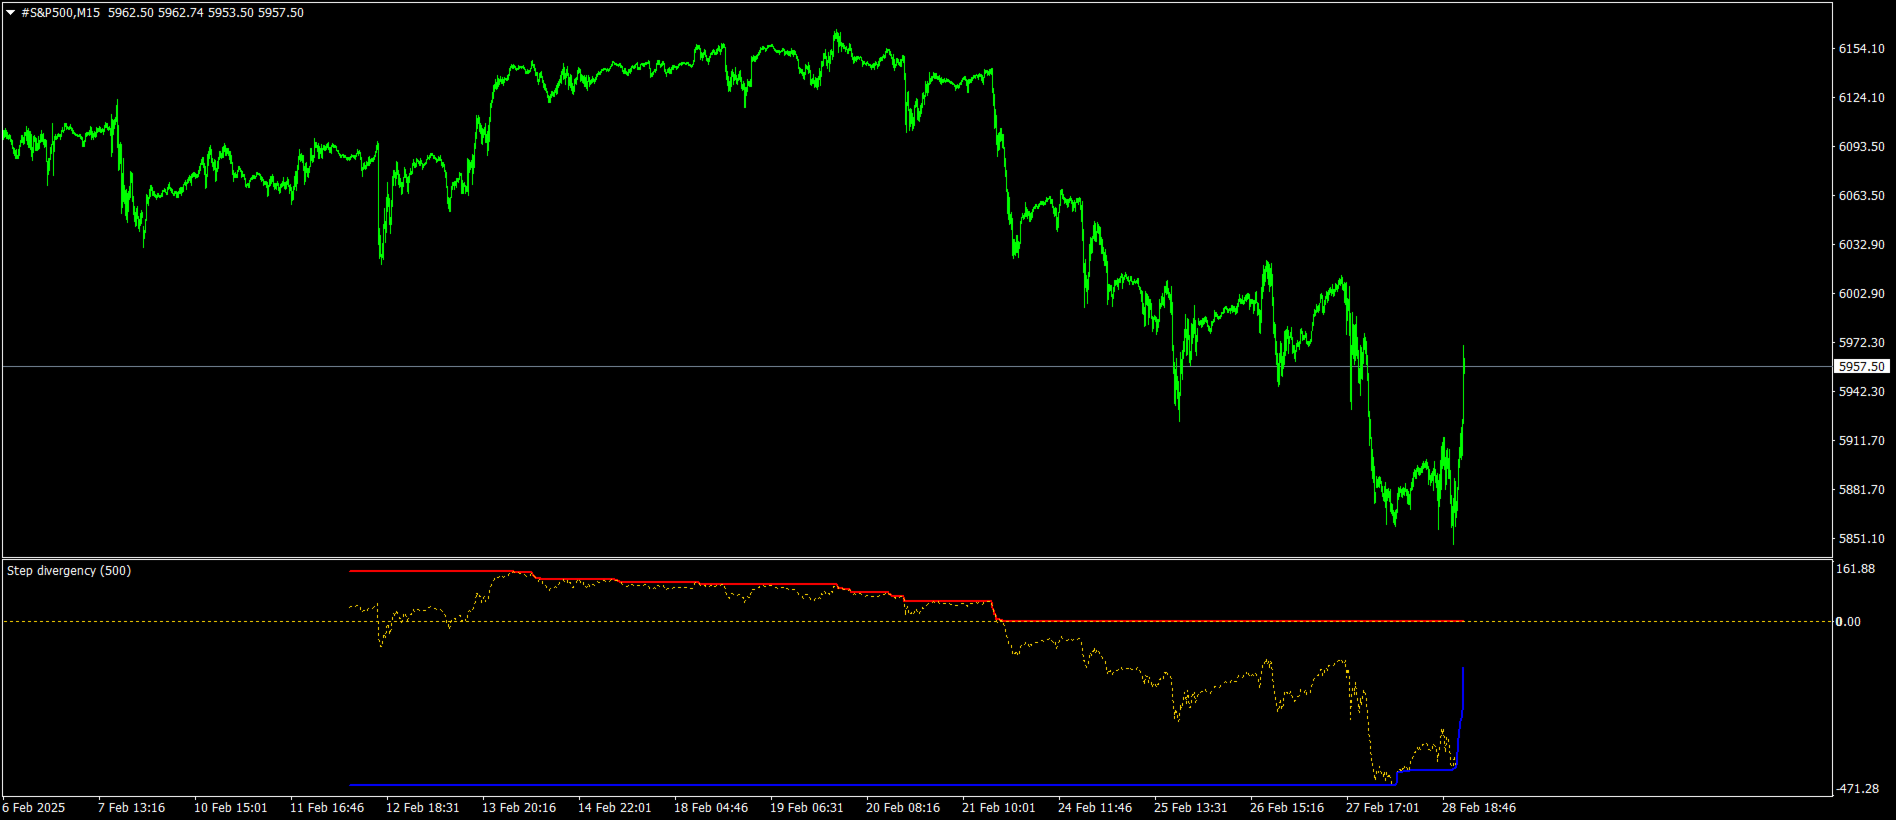
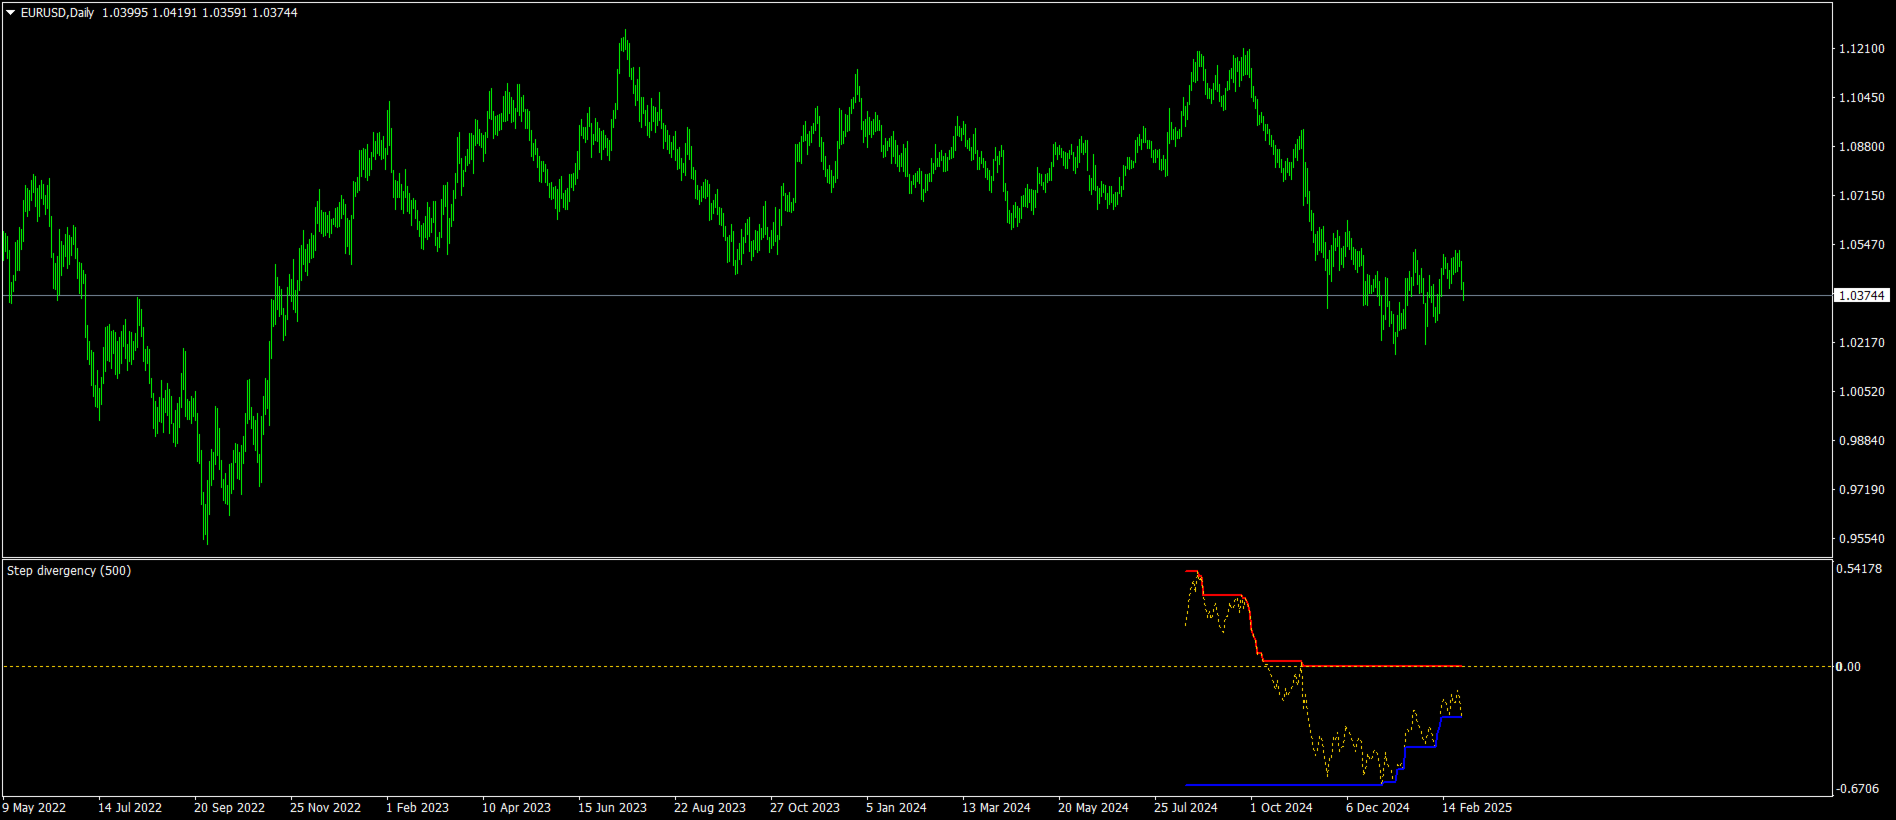
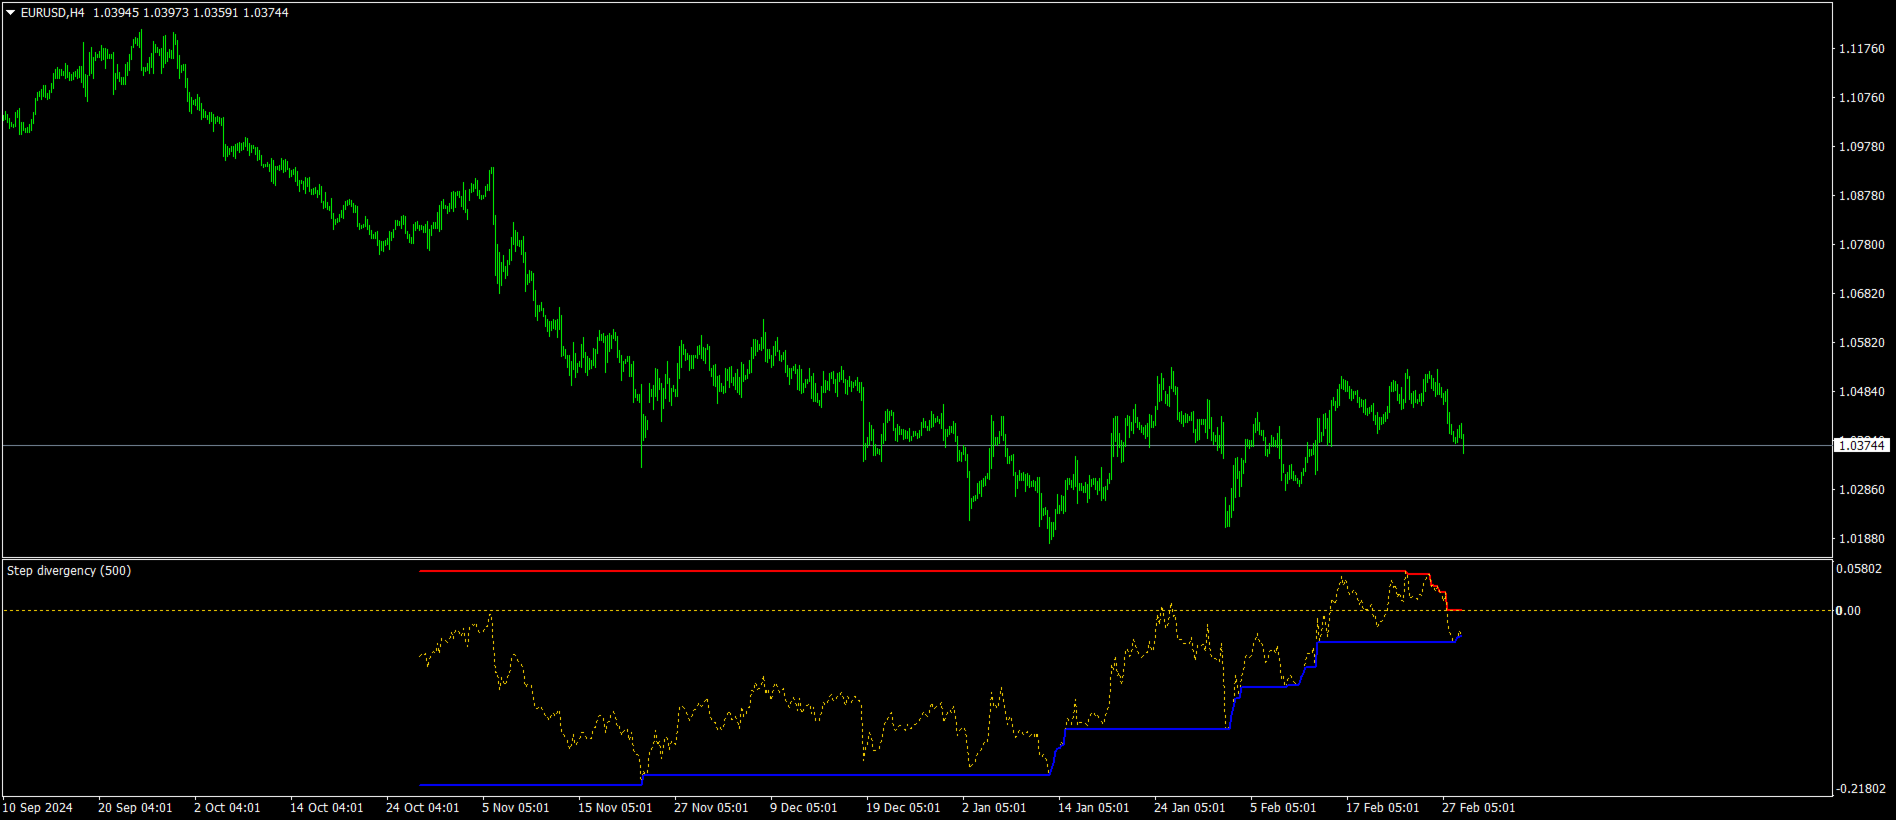
step divergency indicator is a buy sell divergency indicator.include sinus wave indicator.
it work all timeframes and all pairs.
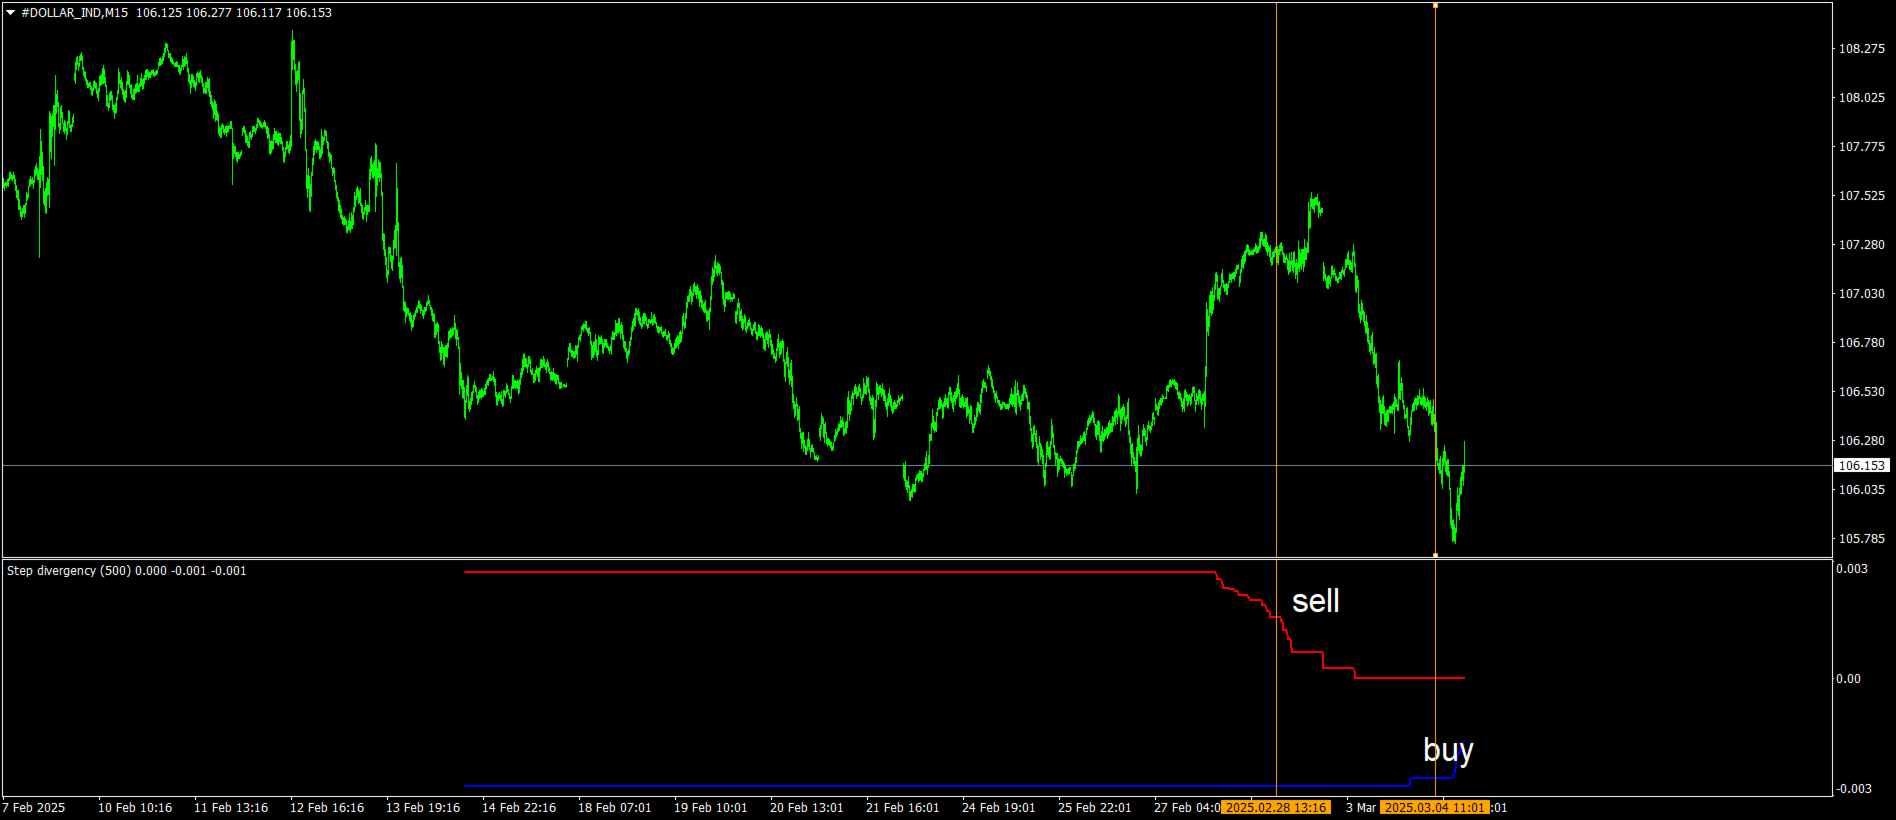
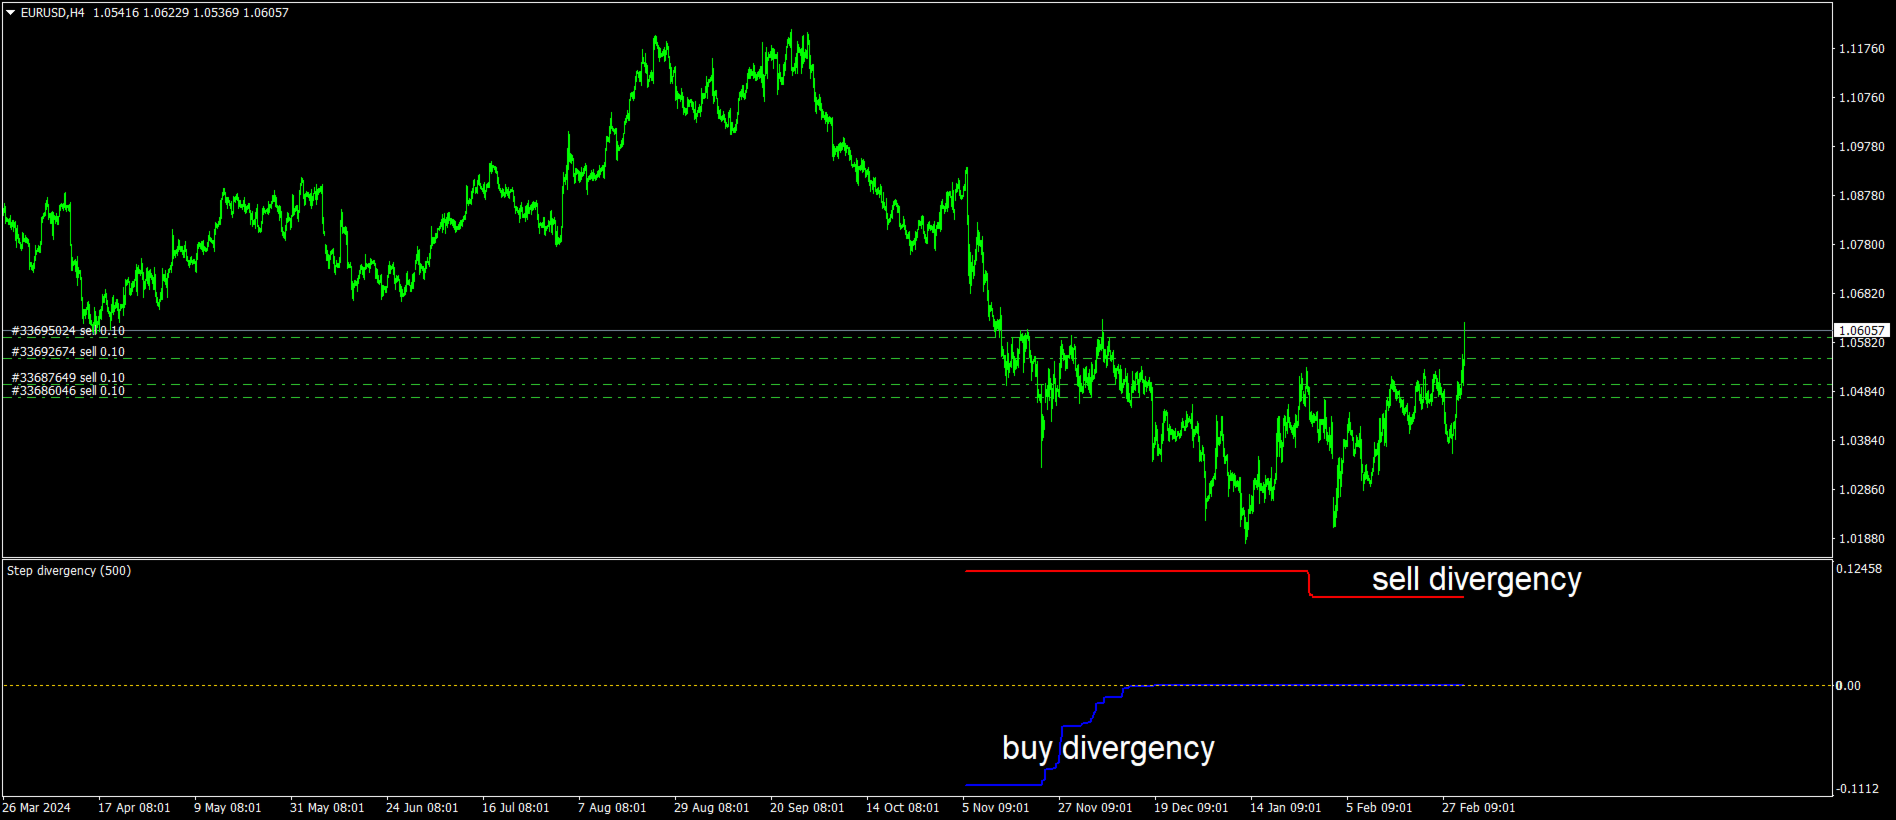
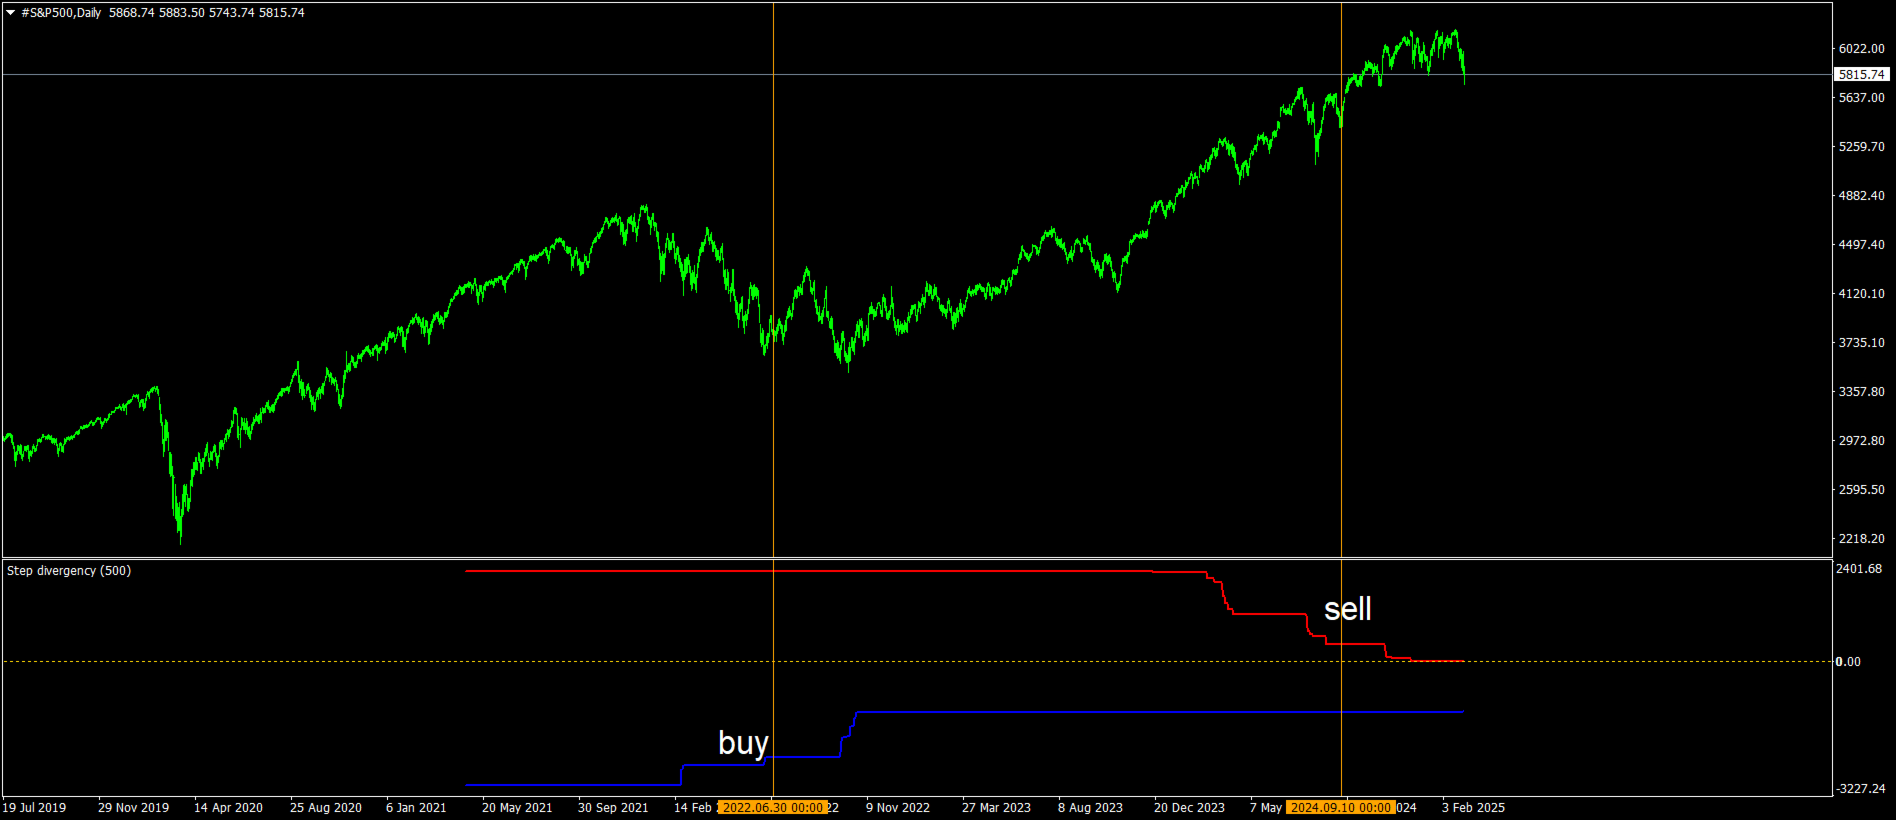
red line gives step divergency sell formations.
blue line gives step divergency buy formations.
suitable for experienced and beginners.
when prices is moving up and red lines step down ..this is sell divergecy formation
and if prices moving down but blue line moving step up this is buy divergency formation.
increased cnt value show more back side.
gold line is sinus wave indicator and can be hide on colours section.
it draw lines but not proceed on demo mode.