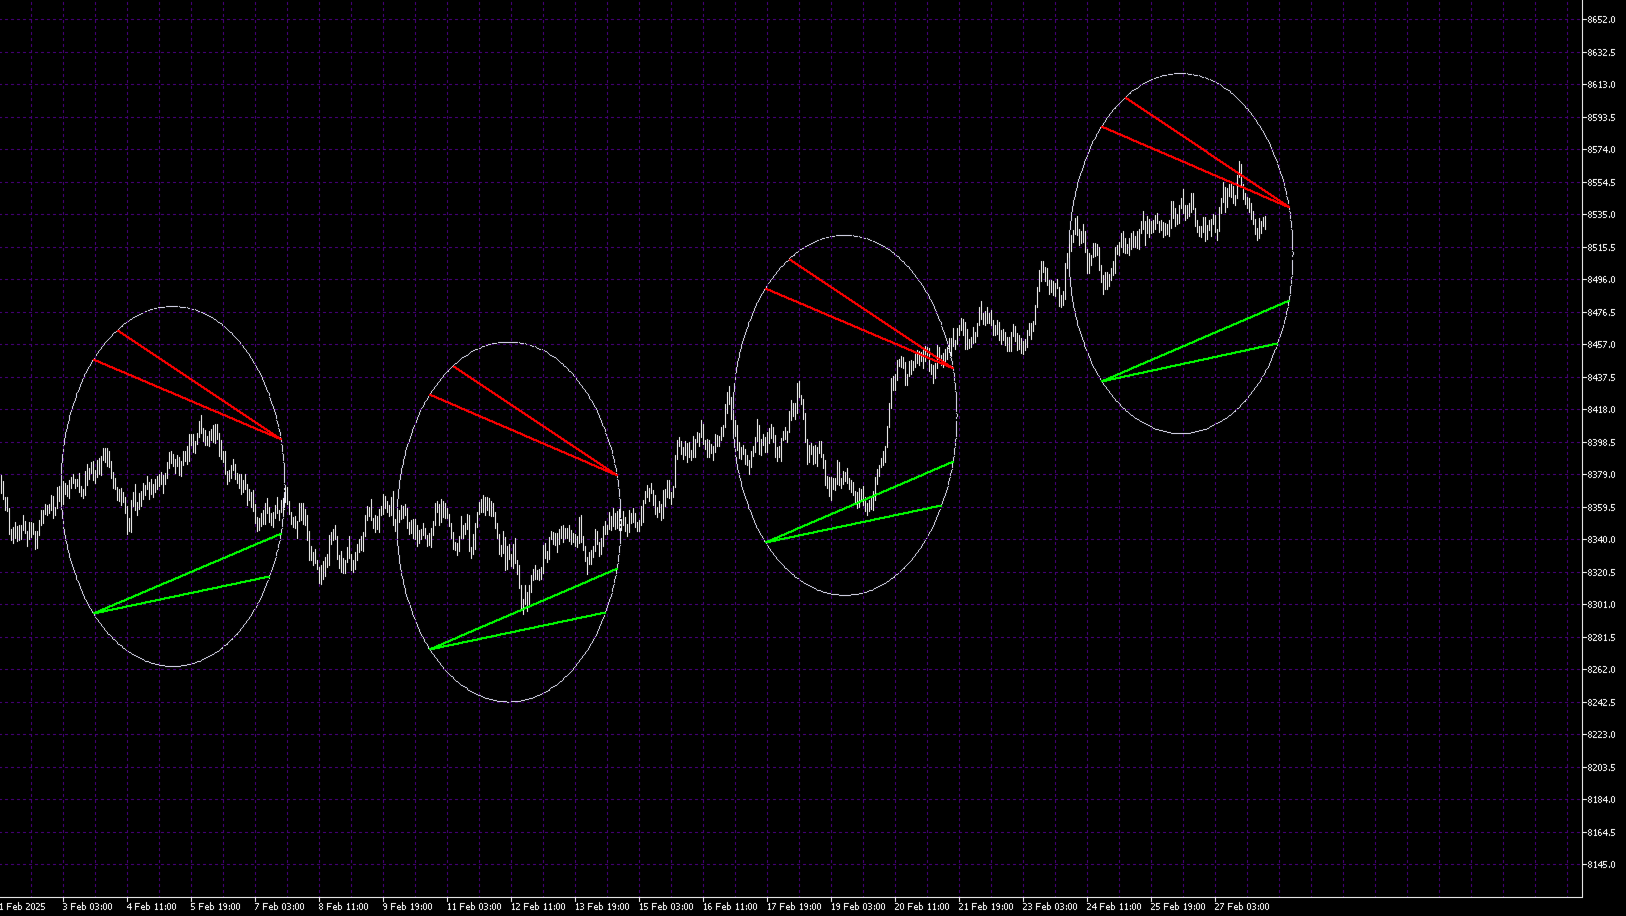
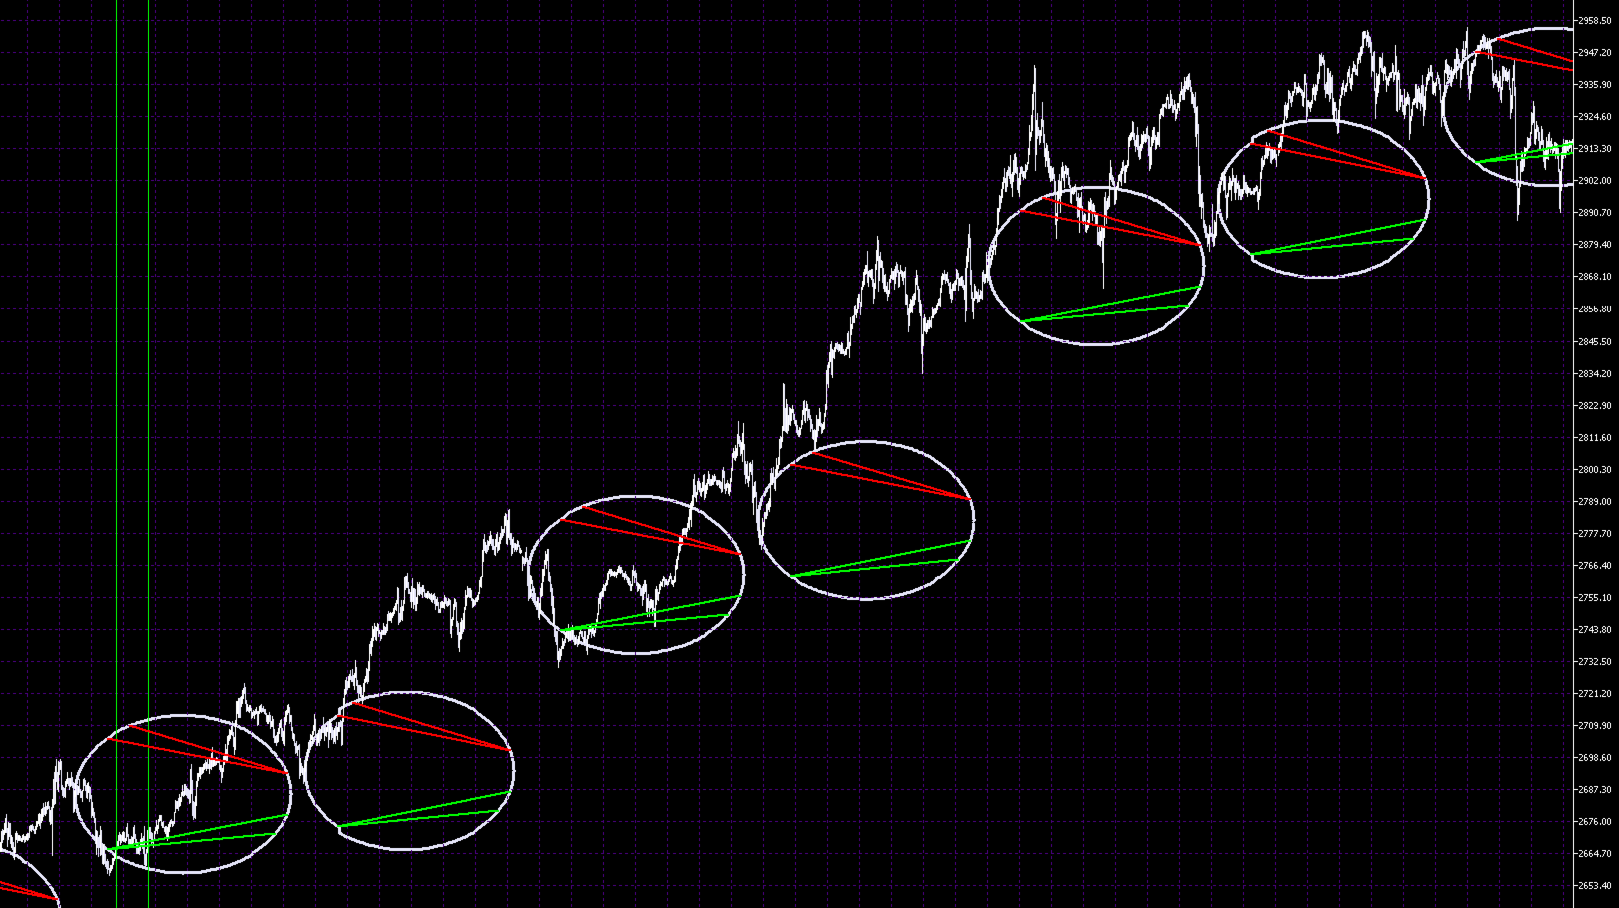
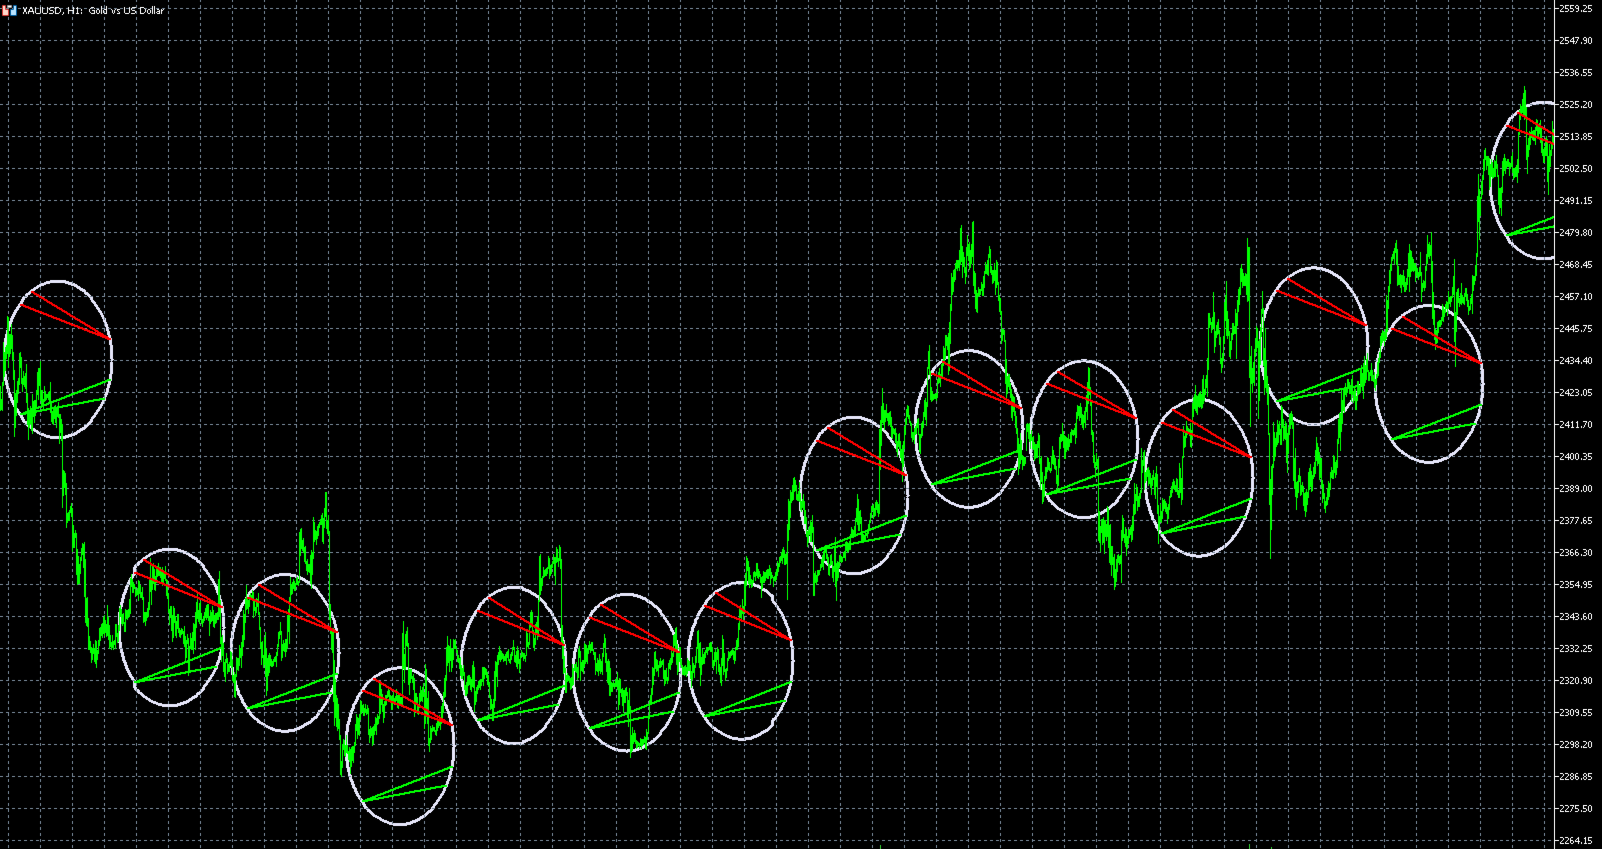
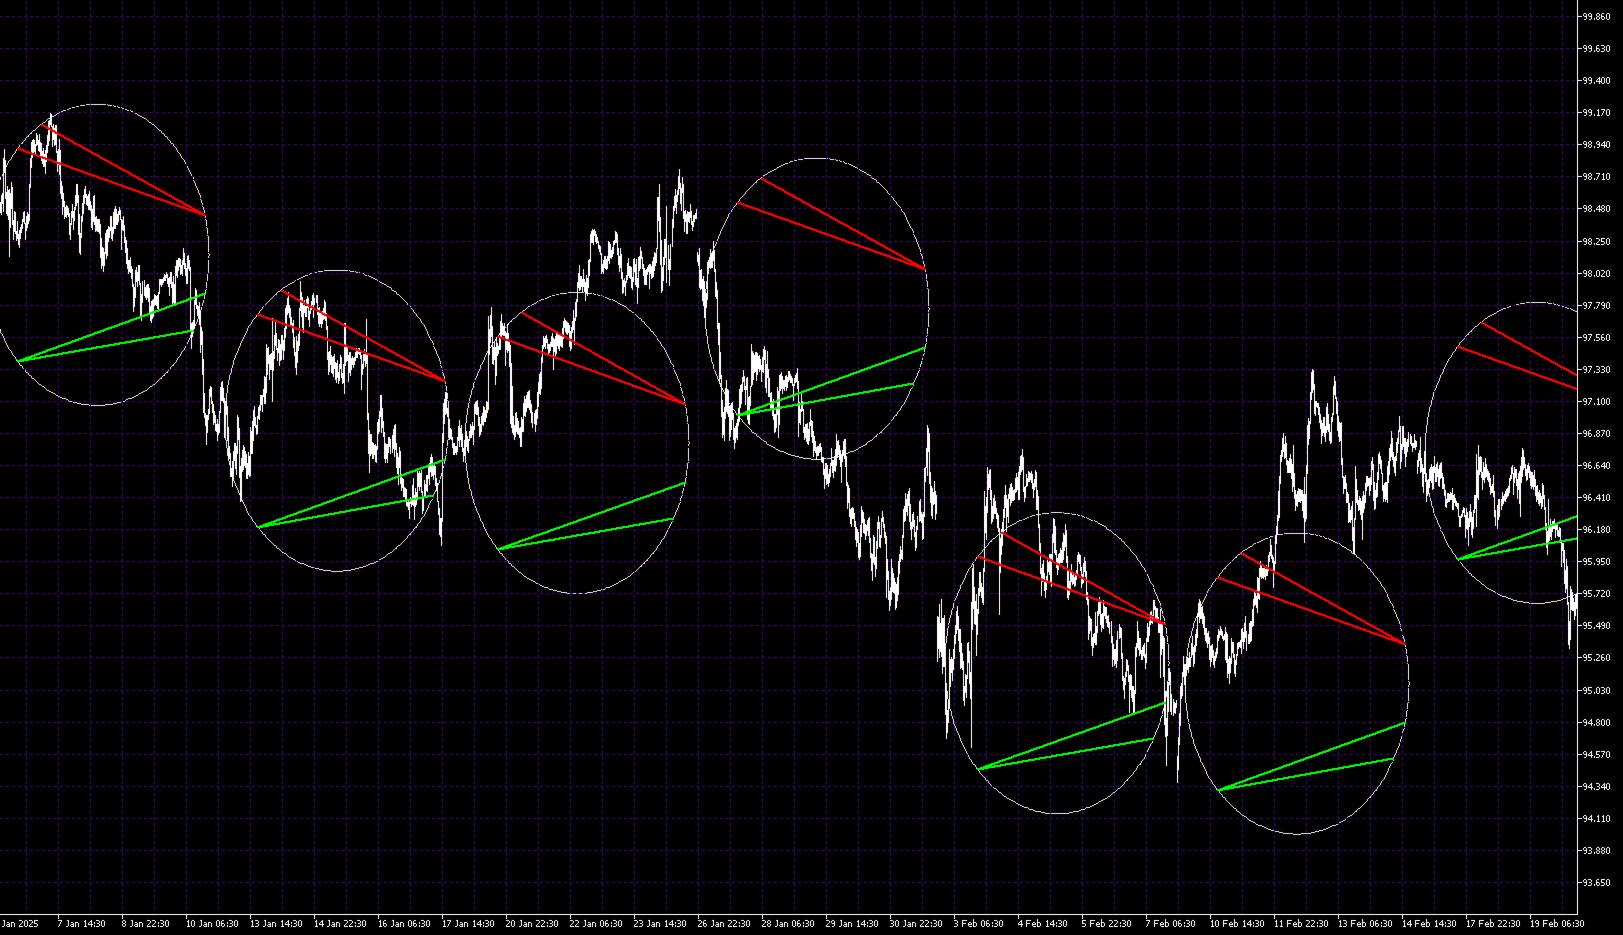
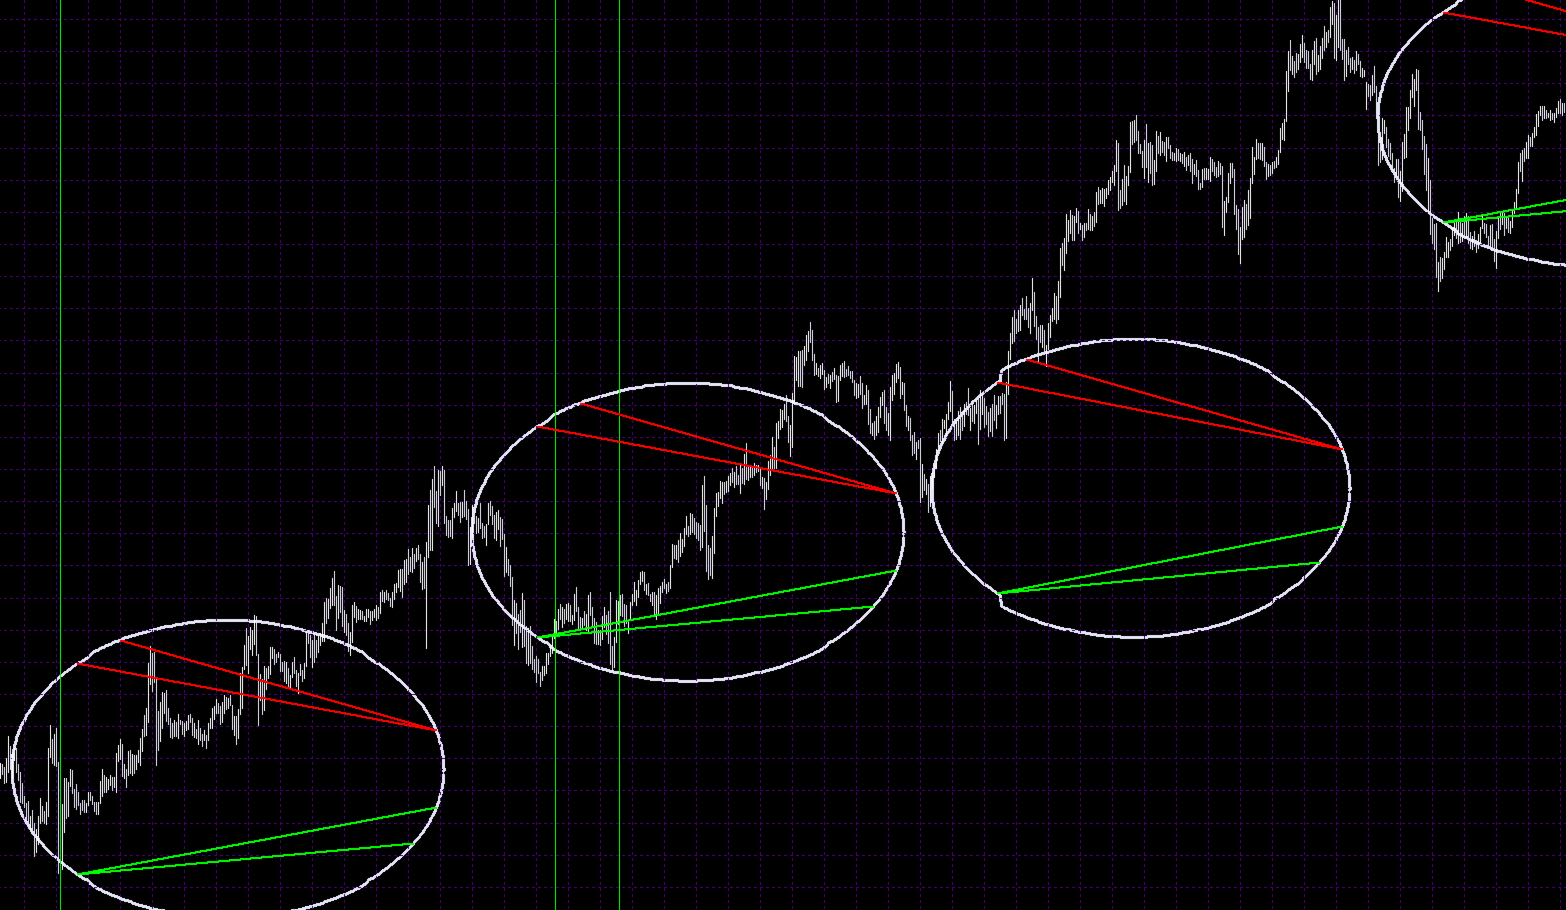
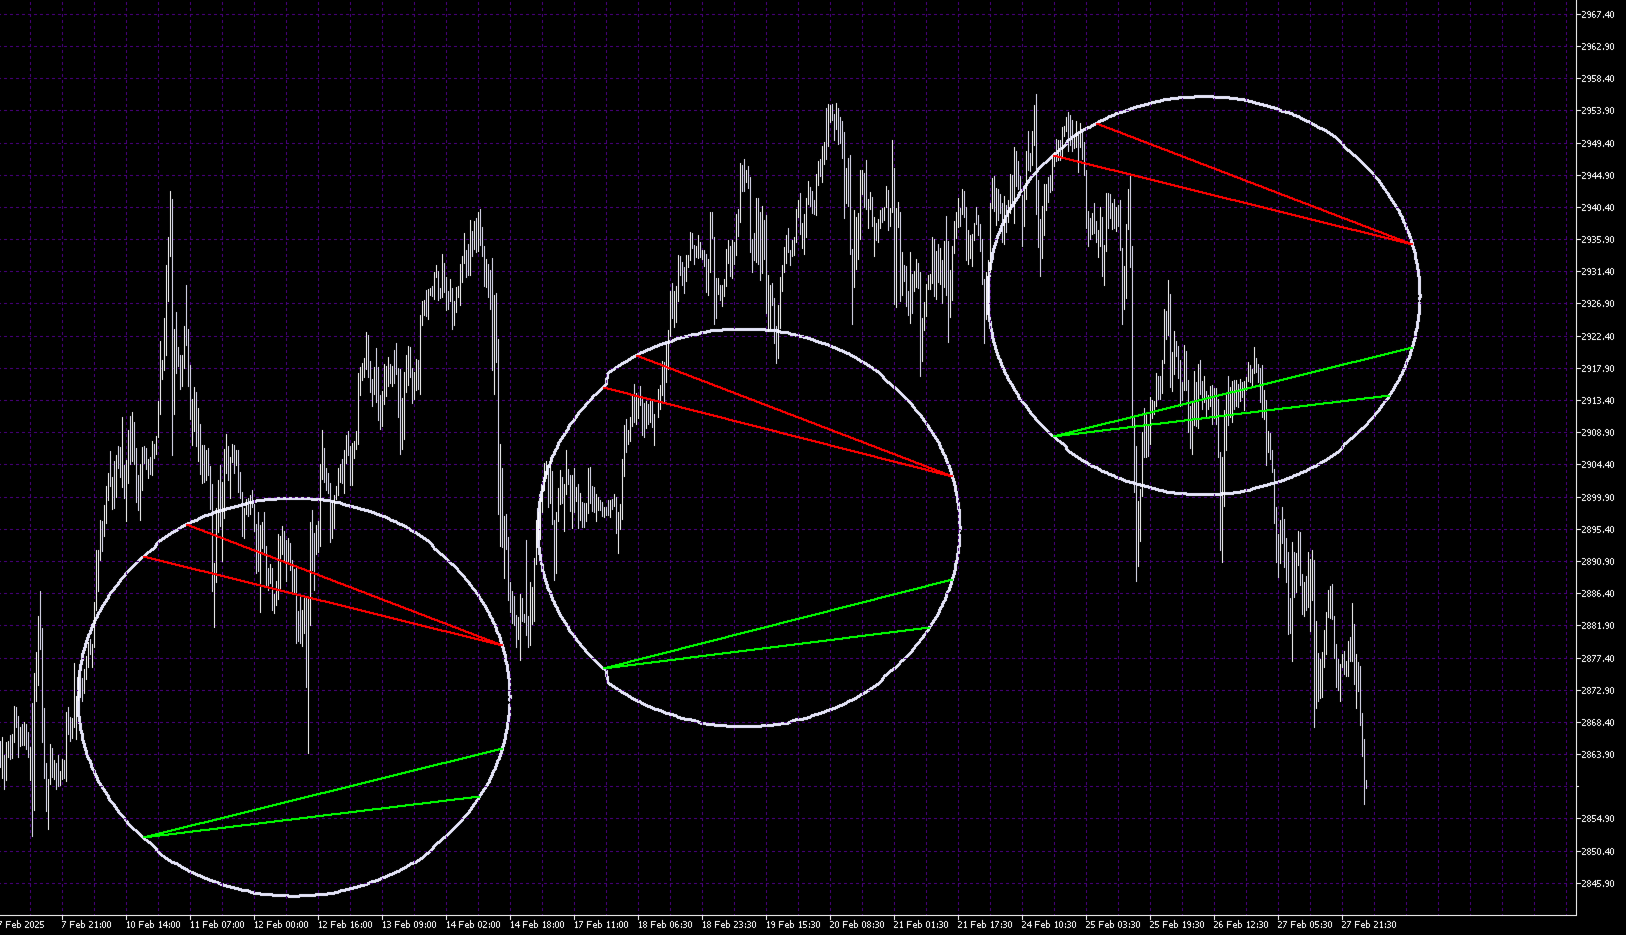
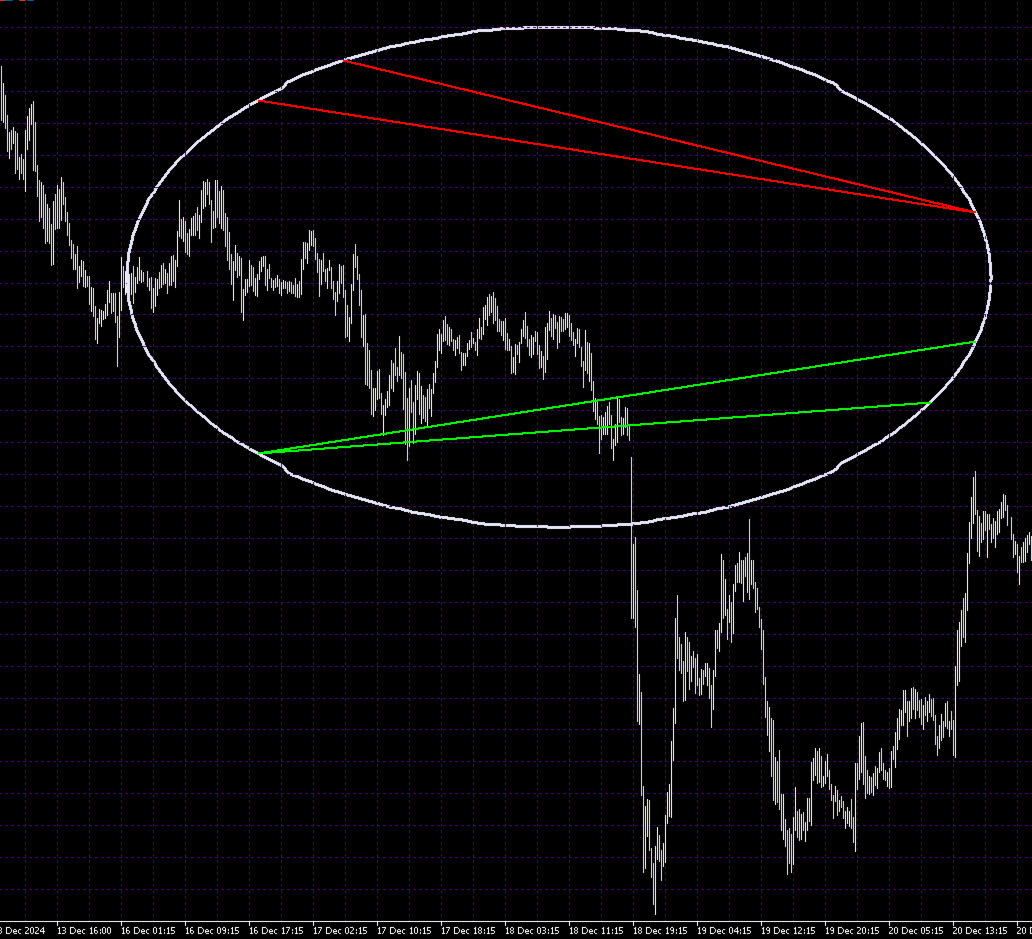
Overbought Oversold Circle
- 지표
- Tevon R Gardiner
- 버전: 1.0
- 활성화: 5
Trading concept:
- When price touches or exceeds the upper circle boundary = potential sell signal (overbought)
- When price touches or falls below the lower circle boundary = potential buy signal (oversold)
- The circle acts like a dynamic support/resistance band around the opening price
- The numbered points (1-24) help identify where in the cycle the price currently is
This is similar to using Bollinger Bands or other envelope indicators, but with a fixed radius instead of standard deviations.