• 미리보기
  • 리뷰
  • 코멘트

BoxLine by Gerega

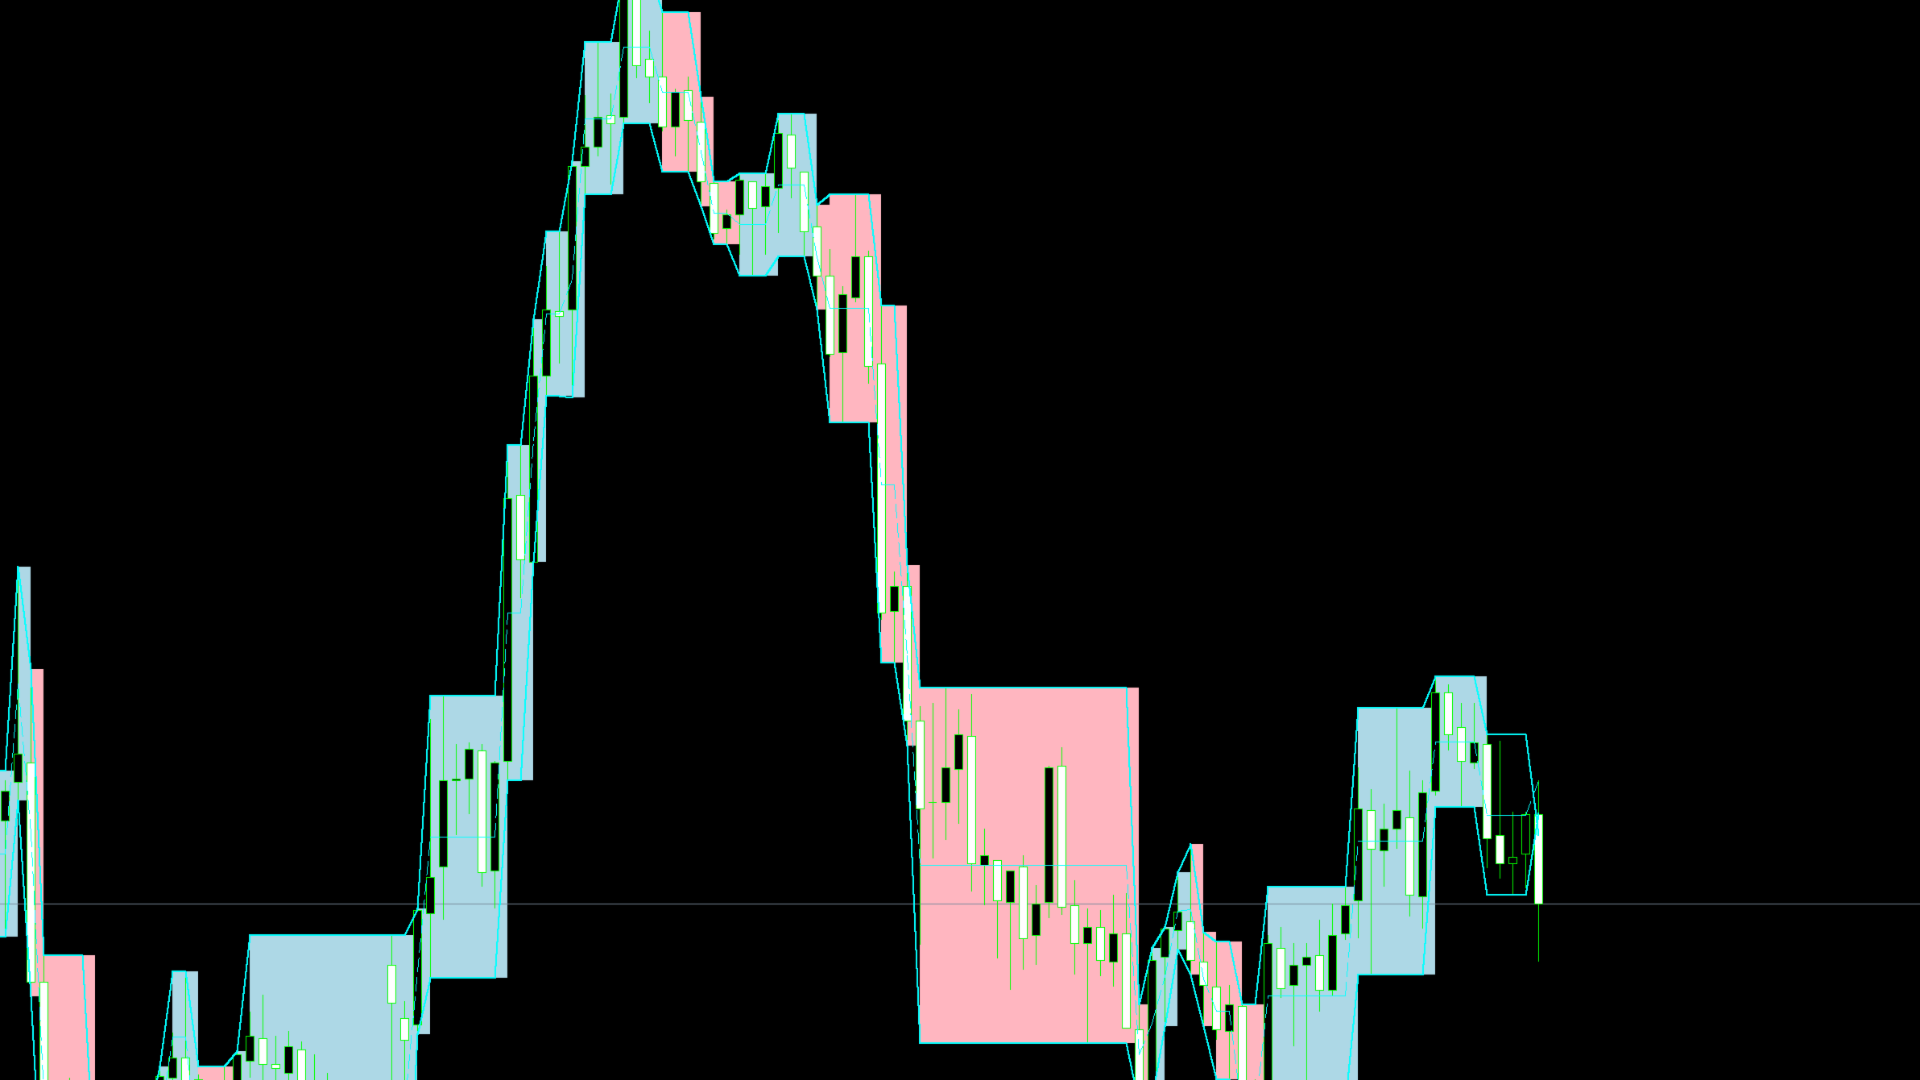
The Box Range Indicator for MT5 helps traders visualize key price zones by automatically detecting and highlighting market structures. It dynamically drawsupper, lower, and middle levelsbased on price action, making it an effective tool for identifying support and resistance zones, breakouts, and trend reversals.


Key Features:

Automatic Box Detection– Identifies price ranges based on market movements.

Dynamic High and Low Updates– Adjusts in real time to reflect market conditions.

Clear Visual Representation– Draws upper, lower, and middle lines for quick analysis.

Bullish & Bearish Zone Highlighting– Colored background for easy trend identification.

Customizable Settings– Adjust colors and visibility to fit your trading style.

Works on All Markets– Suitable for Forex, stocks, indices, and cryptocurrencies.


This indicator is perfect for traders looking to enhance their technical analysis by pinpointing key price areas where market reactions are likely to occur.


추천 제품
Historical Memory
Marat Sultanov
3.33 (3)
Indicator-forecaster. Very useful as an assistant, acts as a key point to forecast the future price movement. The forecast is made using the method of searching the most similar part in the history (pattern). The indicator is drawn as a line that shows the result of change of the close price of bars. The depth of history, the number of bars in the forecast, the patter size and the quality of search can be adjusted via the indicator settings. Settings: PATTERN_Accuracy_ - quality of the search.
FREE
Urgently mt5
Tatiana Savkevych
The Urgently indicator is designed to quickly determine the situation in the market, reflect the state of the market and signal profitable levels for opening trades. Market conditions change quickly enough, requiring constant calibration of trading strategies. Recommended for use in conjunction with any of the oscillators. The Urgently forex market trend indicator shows the trend direction and entry points. It smooths out price fluctuations when generating a signal by averaging the data and the
Trend Catcher with Alert MT5
Issam Kassas
4.71 (80)
트렌드 캐쳐: 알림 인디케이터와 함께 하는 트렌드 캐쳐 전략은 시장 트렌드와 잠재적인 진입 및 체크 포인트를 식별하는 데 도움이 되는 다목적 기술 분석 도구입니다. 이는 시장 상황에 적응하여 트렌드 방향을 명확하게 시각적으로 표현하는 동적 트렌드 캐쳐 전략을 제공합니다. 트레이더는 선호도와 위험 허용도에 맞게 매개변수를 사용자 정의할 수 있습니다. 이 인디케이터는 트렌드 식별을 지원하고 잠재적인 반전을 신호로 제공하며 트레일링 스탑 메커니즘으로 작동하며 실시간 경고를 제공하여 신속한 시장 대응을 돕습니다. 특징: - 트렌드 식별: 상승 트렌드와 하락 트렌드를 신호합니다. - 트렌드 반전: 양봉 색상이 상승에서 하락으로 변경되거나 그 반대의 경우 잠재적인 반전을 경고합니다. - 실시간 경고: 새로운 트렌드 식별을 위한 경고를 생성합니다. 추천사항: - 통화 및 페어: EURUSD, AUDUSD, XAUUSD 등... - 시간 프레임: H1. - 계정 유형: 모든 ECN 계정
FREE
Free automatic Fibonacci is an indicator that automatically plots a Fibonacci retracement based on the number of bars you select on the BarsToScan setting in the indicator. The Fibonacci is automatically updated in real time as new highest and lowest values appears amongst the selected bars. You can select which level values to be displayed in the indicator settings. You can also select the color of the levels thus enabling the trader to be able to attach the indicator several times with differe
FREE
Candle Perspective Structure Indicator MT5 is a simple indicator that defines and displays the candlestick structure of the market. This indicator will suit both experienced traders and beginners who find it difficult to follow the structure visually. Main functions: Determining High and Low swings using the three candlestick pattern. Determination of structure breaks. Setting the visual display of structural elements. Setting the period for which the structure is analysed. Input parameters:
FREE
Range Predictor MT5
Suvashish Halder
Introducing the   Range Predictor : Your Ultimate Guide to Future Trading Ranges!   Imagine having the power to see into the future of market moves— Range Predictor   brings this dream to life. Designed to deliver real-time,   predictive support and resistance levels , this tool goes beyond standard indicators, offering trend direction insights and precise range   forecasts . Whether you're a day trader or a swing trader, the   Range Predictor   is your all-in-one toolkit for mastering the ma
Manyal trading system, CovEchoTrend Robot, focuses on reliability and flexibility. By employing statistical analysis methods to study the relationships between the base indicator and market patterns, the system enables a deeper understanding of market processes. Intelligent pattern analysis: The application of statistical data processing helps identify key trend reversal points more accurately, signaling significant market shifts. Informed decision-making is based on the intersection of indicato
PZ Penta O MT5
PZ TRADING SLU
The Penta-O is a 6-point retracement harmonacci pattern which usually precedes big market movements. Penta-O patterns can expand and repaint quite a bit. To make things easier this indicator implements a twist: it waits for a donchian breakout in the right direction before signaling the trade. The end result is an otherwise repainting indicator with a very reliable trading signal. The donchian breakout period is entered as an input. [ Installation Guide | Update Guide | Troubleshooting | FAQ | A
Noize Absorption Index
Ekaterina Saltykova
Noize Absorption Index - is the manual trading system that measures the difference of pressure between bears forces and bulls forces. Green line - is a noize free index that showing curent situation. Zero value of index shows totally choppy/flat market.Values above zero level shows how powerfull bullish wave is and values below zero measures bearish forces.Up arrow appears on bearish market when it's ready to reverse, dn arrow appears on weak bullish market, as a result of reverse expectation.
**   All Symbols   x   All Timeframes   scan just by pressing scanner button ** *** Contact me  to send you instruction and add you in "Head & Shoulders Scanner group" for sharing or seeing experiences with other users. Introduction: Head and Shoulders   Pattern  is a very repetitive common type of price reversal patterns.   The pattern appears on all time frames and can be used by all types of traders and investors.   The  Head and Shoulders  Scanner indicator  Scans All charts just by pressing
GoldTrader
Yashar Seyyedin
Please backtest with the exact balance of your live account before applying to real money. ==> If account balance is too low it may not trade at all! For MT4 version please contact via private message. martingale version is available here . Strategy description - Detect trend based on EMA18-EMA50-SMA200 alignment in three time frames: M15, H1, H4 - Trade in trend direction and exit when above alignment is broken. - The bot is tuned to trade XAUUSD(Gold). - The bot output is break even in rangin
FREE
High Low Open Close
Alexandre Borela
4.98 (41)
이 프로젝트를 좋아한다면 5 스타 리뷰를 남겨주세요. 이 지표는 열리고, 높은, 낮은 및 마감 가격을 지정합니다. 기간과 그것은 특정한 시간대를 위해 조정될 수 있습니다. 이들은 많은 기관 및 전문가에 의해 보는 중요한 수준입니다 상인은 당신이 더 많은 것일 수있는 장소를 알고 도움이 될 수 있습니다 이름 * 사용 가능한 기간: 이전 날. 이전 주. 지난 달. 이전 분기. 이전 연도. 또는: 현재 날. 현재 주. 현재 달. 현재 분기. 현재 년.
FREE
The new update makes this indicator a complete tool for studying, analyzing and operating probabilistic patterns. It includes: On-chart Multi-asset percentage monitor. Configurable martingales. Twenty-one pre-configured patterns, including Mhi patterns and C3. An advanced pattern editor to store up to 5 custom patterns. Backtest mode to test results with loss reports. Trend filter. Hit operational filter. Martingale Cycles option. Various types of strategies and alerts. Confluence between patter
The ATR Indicator Based on Heiken Ashi is a unique volatility analysis tool that combines the Average True Range (ATR) with Heiken Ashi candlestick calculations to provide a smoother and more reliable measure of market volatility. Unlike the traditional ATR, which uses standard candlesticks, this indicator applies the Heiken Ashi formula to filter out market noise and deliver a clearer volatility signal. Key Features: • ATR Calculation Based on Heiken Ashi Candlesticks – Offers a more stable v
FREE
Standardize
Manuel Espinosa
5 (1)
The "Standardize" indicator   is a technical analysis tool designed to   standardize and smooth price or volume data to highlight significant patterns and reduce market noise, making it easier to interpret and analyze. Description & Functionality: Standardization : The indicator standardizes price or volume values by subtracting the mean and dividing by the standard deviation. This converts the data into a distribution with zero mean and standard deviation of one, allowing different data sets t
FREE
High Probability Reversal Arrow Indicator The indicator looks for trend exhaustion areas, and plots Buy/Sell arrow after on confirmation of trend exhaustion. Signals can also   be shown as popup alerts, or be sent as e-mail or mobile phone notification. Trades can be taken on breakout of the signal candle. Inputs Signal Type: Aggressive/Normal History Bars : Can be set to 0 (zero) to show all historical signals, or can be set to a limited number of bars for faster execution. Show Alert : True/Fa
BeST Darvas Boxes MT5
Eleni Koulocheri
3 (1)
BeST_Darvas Boxes is a Metatrader Indicator based on the trading method developed in the 50’s by the Hungarian Nicolas Darvas . BeST_Darvas Boxes indicator draws the Top and the Bottom of every Darvas Box that can be confirmed on the current Chart draws Buy and Sell Arrows for every confirmed Upwards or Downwards Breakout of the above levels draws always only after the bar closing and so is non-repainting or backpainting it can be used as a standalone trading system/method Inputs Basic Settin
BinaWin NoTouch
Juan Fernando Urrego Alvarez
BinaWin NoTouch is an indicator that sends an alert signal when the trade is in the right position to wait for the breakdown of a side market. It is specially designed to trade under the “No Touch” strategy of the Binary.Com platform with synthetic indexes N.10, N.25, N.50, N.75 and N.100 Similarly, trading can be done with the conventional CALL and PUT strategy of any Binary Options platform. Requirements to use the indicator: 1. Have an account at Binary.Com 2. Configure the Binary.Com d
FREE
Stormer RSI 2
Ricardo Rodrigues Lucca
This strategy was learned from Stormer to be used on B3. Basically, 15 minutes before closing the market, it will check RSI and decided if it will open an position. This strategy do not define a stop loss. If the take profit reach the entry price it will close at market the position. The same happens if the maximal number of days is reached. It is created to brazilian people, so all configuration are in portuguese. Sorry Activations allowed have been set to 50.
Trend Market Catcher MT5
Michael Reuben Msidada
Trend Market Catcher MT5 is a powerful tool developed to assist traders in identifying and capturing profitable market movements. This expert advisor leverages advanced algorithms and sophisticated indicators to analyze price patterns, detect trends, and generate precise trading signals. With Trend Market Catcher, you can say goodbye to guesswork and emotional decision-making. It employs a systematic approach, meticulously scanning the market to identify favorable trading opportunities. By focus
FREE
Premium level Pro
Dmitriy Kashevich
Premium level is a unique indicator with more than 80% accuracy of correct predictions! This indicator has been tested for more than two months by the best Trading Specialists! The author's indicator you will not find anywhere else! From the screenshots you can see for yourself the accuracy of this tool! 1 is great for trading binary options with an expiration time of 1 candle. 2 works on all currency pairs, stocks, commodities, cryptocurrencies Instructions: As soon as the red arrow app
CAP Channel Trading MT5
MEETALGO LLC
3.93 (55)
The   CAP Channel Trading   is a volatility-based indicator that makes use of the “advanced envelope theory”. These envelopes consist of two outer lines. Envelope theory states that the market price will generally fall between the boundaries of the envelope (or channel). If prices move outside the envelope, it is a trading signal or trading opportunity. Benefits of the Channel Trading Indicator CAP Channel Trading works with any asset It can be applied to any financial assets: forex, cryptocur
FREE
우리의   Basic Support and Resistance   표시기는 기술 분석을 향상시키는 데 필요한 솔루션입니다.이 표시기는 차트/ MT4 버전 특징 피보나치 수준의 통합 : 지원 및 저항 수준과 함께 피보나치 수준을 표시하는 옵션과 함께, 우리의 지표는 시장 행동과 가능한 역전 영역에 대한 더 깊은 통찰력을 제공합니다. 성능 최적화 : 각 막대의 개구부에서만 확장 라인을 업데이트하는 옵션을 사용하여, 우리의 지표는 지원 및 저항 수준의 정확도를 희생하지 않고 최적의 성능을 보장합니다. 입력 주요 설정 Timeframe:  이 입력을 통해 차트에 더 높은 기간의 지지선과 저항선을 표시하도록 선택할 수 있습니다. Support/Resistance Strength [Number of Bars]:   이 입력을 사용하면 지지대와 저항의 강도를 결정할 수 있습니다.숫자가 높을수록지지/저항이 더 강해집니다. Price mode:  이 매개 변수를 사용하면 지원 및 저항 수준을
우선적으로, 이 거래 도구는 전문적인 거래에 이상적인 비-다시 그리기 및 지연되지 않는 지표입니다.  온라인 강좌, 사용자 매뉴얼 및 데모. 스마트 가격 액션 컨셉트 인디케이터는 신규 및 경험 많은 트레이더 모두에게 매우 강력한 도구입니다. Inner Circle Trader Analysis 및 Smart Money Concepts Trading Strategies와 같은 고급 거래 아이디어를 결합하여 20가지 이상의 유용한 지표를 하나로 결합합니다. 이 인디케이터는 스마트 머니 컨셉트에 중점을 두어 대형 기관의 거래 방식을 제공하고 이동을 예측하는 데 도움을 줍니다.  특히 유동성 분석에 뛰어나 기관이 어떻게 거래하는지 이해하는 데 도움을 줍니다. 시장 트렌드를 예측하고 가격 변동을 신중하게 분석하는 데 탁월합니다. 귀하의 거래를 기관 전략에 맞추어 시장의 동향에 대해 더 정확한 예측을 할 수 있습니다. 이 인디케이터는 시장 구조를 분석하고 중요한 주문 블록을 식별하고 다양
Order Book, known also as Market Book, market depth, Level 2, - is a dynamically updated table with current volumes of orders to buy and to sell specific financial instument at price levels near Bid and Ask. MetaTrader 5 provides the means for receiving market book from your broker, but in real time only, without access to its history. The indicator OrderBook Cumulative Indicator accumulates market book data online and visualizes them on the chart. In addition, the indicator can show the market
VisualVol EURUSD
Maxim Kuznetsov
The indicator highlights the points that a professional trader sees in ordinary indicators. VisualVol visually displays different volatility indicators on a single scale and a common align. Highlights the excess of volume indicators in color. At the same time, Tick and Real Volume, Actual range, ATR, candle size and return (open-close difference) can be displayed. Thanks to VisualVol, you will see the market periods and the right time for different trading operations. This version is intended f
FREE
Ignition
Dansie Software Limited
Strategy Overview The Ignition EA tries to take advantage of sudden momentum when the Ignition pattern is detected. The final bar in the ignition pattern has a small opening wick, a very little or no closing wick, is large in comparison to recent bars and must start from the lower end of the current range (for a bullish ignition) Quick Testing Use Symbol EURUSD, Timeframe M2, and remove the GBPUSD symbol from the "Symbols" input (stratergy 1 and stratergy 2) Settings The below settings appe
LT Agression Indicator
Thiago Duarte
5 (3)
This is a buyer and seller aggression indicator that analyzes the shape of each candle and project this data in a histogram form. There are 4 histograms in one. On the front we have two: Upper - Buyer force. Lower - Seller force. At the background we also have two histogram, both with same color. They measure the combined strenght of buyers and sellers. This histograms can be turned off in Input Parameters. It is also possible to have the real or tick volume to help on this force measurement. IN
FREE
ZigZag with Fibonacci
Rafael Caetano Pinto
This indicator uses the metaquotes ZigZag indicator as base to plot fibonacci extension and fibonacci retracement based in the Elliot waves. A fibonacci retracement will be plotted on every wave draw by the ZigZag. A fibonacci extension will be plotted only after the 2nd wave. Both fibonacci will be updated over the same wave tendency. Supporting until 9 consecutive elliot waves. Parameters: Depth: How much the algorithm will iterate to find the lowest and highest candles Deviation: Amount of
Pattern 123 MT5
Pavel Verveyko
"Pattern 123" is an indicator-a trading system built on a popular pattern, pattern 123. This is the moment when we expect a reversal on the older trend and enter the continuation of the small trend, its 3rd impulse. The indicator displays signals and markings on an open chart. You can enable/disable graphical constructions in the settings. The indicator has a built-in notification system   (email, mobile terminal, standard terminal alert). "Pattern 123" has a table that displays signals from se
이 제품의 구매자들이 또한 구매함
Trend Screener Pro MT5
STE S.S.COMPANY
4.89 (74)
트렌드 표시기, 트렌드 트레이딩 및 필터링을 위한 획기적인 고유 솔루션, 하나의 도구 안에 내장된 모든 중요한 트렌드 기능! Forex, 상품, 암호 화폐, 지수 및 주식과 같은 모든 기호/도구에 사용할 수 있는 100% 다시 칠하지 않는 다중 시간 프레임 및 다중 통화 표시기입니다. Trend Screener는 차트에 점이 있는 화살표 추세 신호를 제공하는 효율적인 지표 추세 추종 지표입니다. 추세 분석기 표시기에서 사용할 수 있는 기능: 1. 트렌드 스캐너. 2. 최대 이익 분석이 있는 추세선. 3. 추세 통화 강도 측정기. 4. 경고가 있는 추세 반전 점. 5. 경고가 있는 강력한 추세 점. 6. 추세 화살표 Trend Screener Indicator가 있는 일일 분석 예, 일일 신호 성능...등은 여기에서 찾을 수 있습니다. 여기를 클릭하십시오. LIMITED TIME OFFER : Trend Screener Indicator는 50$ 및 평생 동안만 사용할 수 있습니다.
Golden Trend Indicator MT5
Noha Mohamed Fathy Younes Badr
4.88 (16)
Golden Trend indicator  is The best indicator for predicting trend movement this indicator never lags and never repaints and never back paints    and give  arrow buy and sell    before the candle appear  and it will help you and  will make your trading decisions clearer its work on all currencies and  gold and crypto and all time frame This unique  indicator uses very secret algorithms to catch the  trends, so you can trade using this indicator and see the trend clear on charts  manual guide and
FX Levels MT5
Daniel Stein
5 (3)
FX Levels: 모든 시장을 위한 뛰어난 정확도의 지지와 저항 간단 요약 통화쌍, 지수, 주식, 원자재 등 어떤 시장이든 믿을 만한 지지·저항 레벨을 찾고 싶나요? FX Levels 는 전통적인 “Lighthouse” 기법과 첨단 동적 접근을 결합해, 거의 보편적인 정확성을 제공합니다. 실제 브로커 경험을 반영하고, 자동화된 일별 업데이트와 실시간 업데이트를 결합함으로써 FX Levels 는 가격 반전 포인트를 파악하고, 수익 목표를 설정하며, 자신 있게 트레이드를 관리할 수 있게 돕습니다. 지금 바로 시도해 보세요—정교한 지지/저항 분석이 어떻게 여러분의 트레이딩을 한 단계 끌어올릴 수 있는지 직접 확인하세요! 1. FX Levels가 트레이더에게 매우 유용한 이유 뛰어난 정확도의 지지·저항 존 • FX Levels 는 다양한 브로커 환경에서도 거의 동일한 존을 생성하도록 설계되어, 데이터 피드나 시간 설정 차이로 인한 불일치를 해소합니다. • 즉, 어떤 브로커를 사용하
IX Power MT5
Daniel Stein
4.83 (6)
IX Power: 지수, 원자재, 암호화폐 및 외환 시장 통찰력을 발견하세요 개요 IX Power 는 지수, 원자재, 암호화폐 및 외환 시장의 강도를 분석할 수 있는 다목적 도구입니다. FX Power 는 모든 가용 통화 쌍 데이터를 사용하여 외환 쌍에 대해 가장 높은 정확도를 제공하는 반면, IX Power 는 기초 자산 시장 데이터에만 초점을 맞춥니다. 이로 인해 IX Power 는 비외환 시장에 이상적이며, 다중 쌍 분석이 필요하지 않은 간단한 외환 분석에도 신뢰할 수 있는 도구입니다. 모든 차트에서 매끄럽게 작동하며, 거래 결정을 향상시키기 위한 명확하고 실행 가능한 통찰력을 제공합니다. 1. IX Power가 트레이더에게 유용한 이유 다양한 시장 강도 분석 • IX Power 는 지수, 원자재, 암호화폐 및 외환 심볼의 강도를 계산하여 각 시장에 맞는 통찰력을 제공합니다. • US30, WTI, 금, 비트코인 또는 통화 쌍과 같은 자산을 모니터링하여 거래 기회를 발견
FX Volume MT5
Daniel Stein
4.82 (17)
FX Volume: 브로커 시각에서 바라보는 진짜 시장 심리 간단 요약 트레이딩 접근 방식을 한층 더 향상시키고 싶으신가요? FX Volume 는 소매 트레이더와 브로커의 포지션을 실시간으로 파악할 수 있게 해 줍니다. 이는 COT 같은 지연된 보고서보다 훨씬 빠릅니다. 꾸준한 수익을 추구하는 분이든, 시장에서 더 깊은 우위를 원하시는 분이든, FX Volume 을 통해 대규모 불균형을 찾아내고, 돌파 여부를 확인하며 리스크 관리를 정교화할 수 있습니다. 지금 시작해 보세요! 실제 거래량 데이터가 의사결정을 어떻게 혁신할 수 있는지 직접 경험해 보시기 바랍니다. 1. 트레이더에게 FX Volume이 매우 유익한 이유 탁월한 정확도를 지닌 조기 경보 신호 • 다른 사람들보다 훨씬 앞서, 각 통화쌍을 매수·매도하는 트레이더 수를 거의 실시간으로 파악할 수 있습니다. • FX Volume 은 여러 리테일 브로커에서 추출한 실제 거래량 데이터를 종합해 명확하고 편리한 형태로 제공하는
FX Power MT5 NG
Daniel Stein
5 (11)
FX Power: 통화 강세 분석으로 더 스마트한 거래 결정을 개요 FX Power 는 어떤 시장 상황에서도 주요 통화와 금의 실제 강세를 이해하기 위한 필수 도구입니다. 강한 통화를 매수하고 약한 통화를 매도함으로써 FX Power 는 거래 결정을 단순화하고 높은 확률의 기회를 발견합니다. 트렌드를 따르거나 극단적인 델타 값을 사용해 반전을 예측하고자 한다면, 이 도구는 귀하의 거래 스타일에 완벽히 적응합니다. 단순히 거래하지 말고, FX Power 로 더 스마트하게 거래하세요. 1. FX Power가 거래자에게 매우 유용한 이유 통화와 금의 실시간 강세 분석 • FX Power 는 주요 통화와 금의 상대적 강세를 계산하고 표시하여 시장 역학에 대한 명확한 통찰력을 제공합니다. • 어떤 자산이 앞서고 있고 어떤 자산이 뒤처지는지 모니터링하여 보다 현명한 거래 결정을 내릴 수 있습니다. 포괄적인 멀티 타임프레임 뷰 • 단기, 중기 및 장기 타임프레임에서 통화와 금의 강세를
CBT Quantum Maverick 고효율 바이너리 옵션 거래 시스템 CBT Quantum Maverick는 정밀하고 간단하며 체계적인 거래를 원하는 트레이더를 위해 설계된 고성능 바이너리 옵션 거래 시스템입니다. 사용자 지정이 필요 없으며, 처음부터 최적화된 결과를 제공합니다. 약간의 연습만으로 신호를 쉽게 마스터할 수 있습니다. 주요 특징: 정확한 신호 제공: 현재 봉 데이터를 기반으로 다음 캔들에 대한 신호를 생성하며, 빈번한 재도색이 없습니다. 다양한 시장에 대한 적응성: 바이너리 옵션 거래에 특화되었으며, 여러 브로커 및 자산 클래스와 호환됩니다. 호환 가능: Deriv Synthetic Charts: 모든 시간 프레임에서 사용 가능. OTC 차트: Quotex, PocketOption, Binomo, Stockity, IQOption, Exnova, OlympTrade, Deriv, Binolla, Homebroker 등의 브로커와 호환(MT5로의 무료 데이터 임
TPSproTREND PrO MT5
Roman Podpora
4.69 (16)
TPSpro TREND PRO  - is a trend indicator that automatically analyzes the market and provides information about the trend and each of its changes, as well as giving signals for entering trades without redrawing! The indicator uses each candle, analyzing them separately. referring to different impulses - up or down impulse. Exact entry points into transactions for currencies, crypto, metals, stocks, indices!  ИНСТРУКЦИЯ RUS         INSTRUCTIONS  ENG       R ecommended to use with an indicator   -
FX Dynamic: 맞춤형 ATR 분석으로 변동성과 트렌드를 파악하세요 개요 FX Dynamic 는 Average True Range(ATR) 계산을 활용하여 트레이더에게 일간 및 일중 변동성에 대한 뛰어난 인사이트를 제공하는 강력한 도구입니다. 80%, 100%, 130%와 같은 명확한 변동성 임계값을 설정함으로써 시장이 평소 범위를 초과할 때 빠르게 경고를 받고, 유망한 수익 기회를 재빨리 식별할 수 있습니다. FX Dynamic 는 브로커의 시간대를 인식하거나 수동으로 조정할 수 있으며, 변동성 측정 기준을 일관되게 유지하며, MetaTrader 플랫폼과 완벽하게 연동되어 실시간 분석을 지원합니다. 1. FX Dynamic이 트레이더에게 매우 유용한 이유 실시간 ATR 인사이트 • 하루 및 일중 변동성을 한눈에 모니터링하세요. ATR의 80%, 100%, 130% 임계값이 도달 또는 초과되면, 시장의 중요한 지점에 있음을 알 수 있습니다. • 변동성이 완전히 폭발하기
Entry Points Pro for MT5
Yury Orlov
4.46 (130)
다시 색을 칠하지 않고 거래에 진입할 수 있는 정확한 신호를 제공하는 MT5용 지표입니다. 외환, 암호화폐, 금속, 주식, 지수 등 모든 금융 자산에 적용할 수 있습니다. 매우 정확한 추정값을 제공하고 매수와 매도의 가장 좋은 시점을 알려줍니다. 하나의 시그널로 수익을 내는 지표의 예와 함께 비디오 (6:22)시청하십시오! 대부분의 거래자는 Entry Points Pro 지표의 도움으로 첫 거래 주 동안 트레이딩 결과를 개선합니다. 저희의   Telegram Group 을 구독하세요! Entry Points Pro 지표의 좋은점. 재도색이 없는 진입 신호 신호가 나타나고 확인되면(시그널 캔들이 완성된 경우) 신호는 더 이상 사라지지 않습니다. 여타 보조지표의 경우 신호를 표시한 다음 제거되기 때문에 큰 재정적 손실로 이어집니다. 오류 없는 거래 게시 알고리즘을 통해 트레이드(진입 또는 청산)를 할 이상적인 순간을 찾을 수 있으며, 이를 통해 이를 사용하는 모든 거래자의 성공률이
Basic Harmonic Patterns Dashboard MT5
Mehran Sepah Mansoor
4.57 (7)
이 대시보드는 선택한 심볼에 대해 사용 가능한 최신 고조파 패턴을 표시하므로 시간을 절약하고 더 효율적으로 사용할 수 있습니다 /   MT4 버전 . 무료 인디케이터:   Basic Harmonic Pattern 인디케이터 열 Symbol :   선택한 심볼이 나타납니다 Trend :   강세 또는 약세 Pattern :   패턴 유형(가틀리, 나비, 박쥐, 게, 상어, 사이퍼 또는 ABCD) Entry :   진입 가격 SL:   스톱로스 가격 TP1:   1차 테이크프로핏 가격 TP2:   2차 테이크프로핏 가격 TP3:   3차 테이크프로핏 가격 Current price:   현재 가격 Age (in bars):   마지막으로 그려진 패턴의 나이 주요 입력 Symbols :   "28개 주요 통화쌍" 또는 "선택한 심볼" 중에서 선택합니다. Selected Symbols :   쉼표로 구분하여 모니터링하려는 원하는 심볼("EURUSD,GBPUSD,XAUUSD")을 선택
Matrix Arrow Indicator MT5
Juvenille Emperor Limited
5 (13)
매트릭스 화살표 표시기 MT5 는 외환, 상품, 암호 화폐, 지수, 주식과 같은 모든 기호/도구에 사용할 수 있는 100% 다시 칠하지 않는 다중 기간 표시기를 따르는 고유한 10 in 1 추세입니다.  Matrix Arrow Indicator MT5 는 다음과 같은 최대 10개의 표준 지표에서 정보와 데이터를 수집하여 초기 단계에서 현재 추세를 결정합니다. 평균 방향 이동 지수(ADX) 상품 채널 지수(CCI) 클래식 하이켄 아시 캔들 이동 평균 이동 평균 수렴 발산(MACD) 상대 활력 지수(RVI) 상대 강도 지수(RSI) 포물선 SAR 스토캐스틱 오실레이터 윌리엄스의 백분율 범위 모든 지표가 유효한 매수 또는 매도 신호를 제공하면 강력한 상승/하락 추세를 나타내는 다음 캔들/막대가 시작될 때 해당 화살표가 차트에 인쇄됩니다. 사용자는 사용할 표시기를 선택하고 각 표시기의 매개변수를 개별적으로 조정할 수 있습니다. 매트릭스 화살표 표시기 MT5는 선택한 표시기에서만 정보를 수
Gartley Hunter Multi
Siarhei Vashchylka
5 (9)
Gartley Hunter Multi - An indicator for searching for harmonic patterns simultaneously on dozens of trading instruments and on all possible timeframes. Manual (Be sure to read before purchasing) | Version for MT4 Advantages 1. Patterns: Gartley, Butterfly, Shark, Crab. Bat, Alternate Bat, Deep Crab, Cypher 2. Simultaneous search for patterns on dozens of trading instruments and on all possible timeframes 3. Search for patterns of all possible sizes. From the smallest to the largest 4. All fou
Gold Stuff mt5
Vasiliy Strukov
4.92 (173)
Gold Stuff mt5는 금을 위해 특별히 설계된 추세 지표이며 모든 금융 상품에서도 사용할 수 있습니다. 표시기가 다시 그려지지 않고 지연되지 않습니다. 권장 기간 H1. 설정 및 개인 보너스를 받으려면 구매 후 즉시 저에게 연락하십시오!     강력한 지원 및 트렌드 스캐너 표시기의 무료 사본을 받으실 수 있습니다. 메시지를 보내주세요. 나!   설정 화살표 그리기 - 켜기 끄기. 차트에 화살표 그리기. 경고 - 가청 경고를 끕니다. 이메일 알림 - 켜기 끄기. 이메일 알림. Puch-notification - 켜기 끄기. 푸시 알림. 다음으로 색 영역을 조정합니다. Gold Stuff mt5는 금을 위해 특별히 설계된 추세 지표이며 모든 금융 상품에서도 사용할 수 있습니다. 표시기가 다시 그려지지 않고 지연되지 않습니다. 권장 기간 H1. 설정 및 개인 보너스를 받으려면 구매 후 즉시 저에게 연락하십시오!   설정 화살표 그리기 - 켜기 끄기. 차트에 화살표 그
TPSpro RFI Levels MT5
Roman Podpora
4.53 (19)
지침         러시아   -        영어       표시기와 함께 사용하는 것이 좋습니다   .       -       TPSpro   트렌드 프로 -   MT4 버전         거래에서 핵심 요소는 거래 상품을 매수 또는 매도하기로 결정하는 구역 또는 수준입니다. 주요 업체가 시장에서 자신의 존재를 숨기려는 시도에도 불구하고, 그들은 필연적으로 흔적을 남깁니다. 우리의 과제는 이러한 흔적을 식별하고 올바르게 해석하는 방법을 배우는 것이었습니다. 주요 기능:: 판매자와 구매자를 위한 활성 영역을 표시합니다! 이 지표는 매수 및 매도를 위한 모든 올바른 초기 임펄스 레벨/존을 보여줍니다. 진입점 검색이 시작되는 이러한 레벨/존이 활성화되면 레벨의 색상이 바뀌고 특정 음영으로 채워집니다. 또한 상황을 보다 직관적으로 이해하기 위해 화살표가 나타납니다. 더 높은 시간대의 레벨/존 표시(MTF 모드) 더 높은 시간 간격을 사용하여 레벨/존을 표시하는 기능을 추가했습니다.
Atomic Analyst MT5
Issam Kassas
4.32 (19)
우선적으로 언급할 점은이 거래 지표가 다시 그리지 않고 지연되지 않으며 이를 통해 수동 및 로봇 거래 모두에 이상적이라는 점입니다. 사용자 매뉴얼: 설정, 입력 및 전략. Atomic Analyst는 가격의 강도와 모멘텀을 활용하여 시장에서 더 나은 이점을 찾는 PA Price Action Indicator입니다. 고급 필터를 장착하여 잡음과 거짓 신호를 제거하고 거래 잠재력을 높이는 데 도움이 됩니다. 복잡한 지표의 다중 레이어를 사용하여 Atomic Analyst는 차트를 스캔하고 복잡한 수학적 계산을 간단한 신호와 색상으로 변환하여 초보 트레이더가 이해하고 일관된 거래 결정을 내릴 수 있도록합니다. "Atomic Analyst"는 새로운 및 경험이 풍부한 트레이더를위한 종합적인 거래 솔루션입니다. 프리미엄 지표와 최고 수준의 기능을 하나의 거래 전략에 결합하여 모든 종류의 트레이더에 대한 다재다능한 선택지가되었습니다. 인트라데이 거래 및 스캘핑 전략 : 빠르고 정확한 일일
Bill Williams Advanced
Siarhei Vashchylka
5 (9)
Bill Williams Advanced is designed for automatic chart analysis using Bill Williams' "Profitunity" system. The indicator analyzes four timeframes at once. Manual (Be sure to read before purchasing) Advantages 1. Automatically analyzes the chart using the "Profitunity" system of Bill Williams. The found signals are placed in a table in the corner of the screen. 2. Equipped with a trend filter based on the Alligator indicator. Most of the system signals are recommended to be used only according t
Support And Resistance Screener는 하나의 지표 안에 여러 도구를 제공하는 MetaTrader에 대한 하나의 레벨 지표입니다. 사용 가능한 도구는 다음과 같습니다. 1. 시장 구조 스크리너. 2. 완고한 후퇴 영역. 3. 약세 후퇴 영역. 4. 일일 피벗 포인트 5. 주간 피벗 포인트 6. 월간 피벗 포인트 7. 고조파 패턴과 볼륨에 기반한 강력한 지지와 저항. 8. 은행 수준 구역. LIMITED TIME OFFER : HV 지원 및 저항 표시기는 50 $ 및 평생 동안만 사용할 수 있습니다. ( 원래 가격 125$ ) MQL5 블로그에 액세스하면 분석 예제와 함께 모든 프리미엄 지표를 찾을 수 있습니다. 여기를 클릭하십시오. 주요 특징들 고조파 및 볼륨 알고리즘을 기반으로 하는 강력한 지원 및 저항 영역. Harmonic 및 Volume 알고리즘을 기반으로 한 강세 및 약세 풀백 영역. 시장 구조 스크리너 일간, 주간 및 월간 피벗 포인트. 실제 거래의
Quantum Trend Sniper
Bogdan Ion Puscasu
4.73 (51)
소개       Quantum Trend Sniper Indicator는   추세 반전을 식별하고 거래하는 방식을 변화시키는 획기적인 MQL5 지표입니다! 13년 이상의 거래 경험을 가진 숙련된 트레이더 팀이 개발한       Quantum Trend Sniper 표시기       매우 높은 정확도로 추세 반전을 식별하는 혁신적인 방법으로 거래 여정을 새로운 차원으로 끌어올리도록 설계되었습니다. ***Quantum Trend Sniper Indicator를 구입하면 Quantum Breakout Indicator를 무료로 받을 수 있습니다!*** Quantum Trend Sniper Indicator는 추세 반전을 식별하고 세 가지 이익실현 수준을 제안할 때 경고, 신호 화살표를 제공합니다. 초보자 거래자와 전문 거래자 모두에게 적합합니다. Quantum EA 채널:       여기를 클릭하세요 MT4 버전:       여기를 클릭하세요 추천: 기간:모든 기간.
RelicusRoad Pro MT5
Relicus LLC
4.78 (18)
이제 $ 147 (몇 가지 업데이트 후 $ 499 증가) - 무제한 계정 (PCS 또는 MACS) RelicusRoad 사용 설명서 + 교육 비디오 + 비공개 Discord 그룹 액세스 + VIP 상태 시장을 보는 새로운 방법 RelicusRoad는 외환, 선물, 암호화폐, 주식 및 지수에 대한 세계에서 가장 강력한 거래 지표로서 거래자에게 수익성을 유지하는 데 필요한 모든 정보와 도구를 제공합니다. 우리는 초보자부터 고급까지 모든 거래자가 성공할 수 있도록 기술적 분석 및 거래 계획을 제공합니다. 미래 시장을 예측할 수 있는 충분한 정보를 제공하는 핵심 거래 지표입니다. 우리는 차트에서 말이 안 되는 여러 지표 대신 완전한 솔루션을 믿습니다. 타의 추종을 불허하는 매우 정확한 신호, 화살표 + 가격 조치 정보를 표시하는 올인원 표시기입니다. 강력한 AI를 기반으로 하는 RelicusRoad는 누락된 정보와 도구를 제공하여 교육하고 성공적인 트레이더인 트레이딩 전문가가 되도
Quantum TrendPulse
Bogdan Ion Puscasu
5 (13)
SuperTrend   ,   RSI   ,   Stochastic   의 힘을 하나의 포괄적인 지표로 결합하여 트레이딩 잠재력을 극대화하는 궁극의 트레이딩 도구   인 Quantum TrendPulse를   소개합니다. 정밀성과 효율성을 추구하는 트레이더를 위해 설계된 이 지표는 시장 추세, 모멘텀 변화, 최적의 진입 및 종료 지점을 자신 있게 식별하는 데 도움이 됩니다. 주요 특징: SuperTrend 통합:   주요 시장 추세를 쉽게 따라가고 수익성의 물결을 타세요. RSI 정밀도:   매수 과다 및 매도 과다 수준을 감지하여 시장 반전 시점을 파악하는 데 적합하며 SuperTrend 필터로 사용 가능 확률적 정확도:   변동성이 큰 시장에서 숨겨진 기회를 찾기 위해 확률적 진동   을 활용하고 SuperTrend의 필터로 사용 다중 시간대 분석:   M5부터 H1 또는 H4까지 다양한 시간대에 걸쳐 시장을 최신 상태로 유지하세요. 맞춤형 알림:   맞춤형 거래 조건이 충족되면
TW Trend Scalper Indicator: The TW Scalper Shoot는 최신 거래 전략과 인공지능 기술을 활용하여 독특한 거래 경험을 제공합니다. 이 제품은 두 가지 뚜렷한 신호 범주를 제공하여 스캘퍼 트레이더의 다양한 요구를 충족합니다. 오늘 이 특별한 제품을 테스트하고 트렌드 스캘퍼가 되는 독특한 경험을 시작하세요. 또한, $37 상당의 제품을 선물로 받으세요. 신호 범주: 1. 장기적이고 안전한 신호: 이러한 신호는 가격 행동 전략(스마트 머니 규칙), 피보나치 수준, 지원 및 저항 수준, 이동 평균을 사용하여 식별됩니다. 이 범주의 신호는 빨간색과 파란색 화살표 및 특정 목표와 함께 표시되어 장기적이고 신뢰할 수 있는 거래를 원하는 트레이더에게 이상적입니다. 2. 스캘핑 신호(전문 스캘퍼용): 앞서 언급한 전략 외에도 이러한 신호는 독점적인 Trade Wizards 지표 공식과 AI 노이즈 감소 방법도 활용합니다. 스캘핑 신호는 신뢰할 수 있는
ON Trade Gann Squares MT5
Abdullah Alrai
5 (2)
간 스퀘어 지표는 W.D. 간이 쓴 "시장 예측을 위한 수학적 공식" 기사에 기반한 강력한 시장 분석 도구입니다. 이 도구는 수학적 개념과 간 이론을 사용하여 정확한 시장 분석을 수행합니다. 144, 90, 52의 제곱과 9의 제곱을 사용합니다. 또한 의 9의 제곱근 및 해당 제곱의 채널 및 스타 패턴과의 관련성을 통합합니다. 사용자 메뉴얼 및 적용: 이 지표를 사용하기 전에 사용자 메뉴얼을 읽고 질문이 있을 경우 문의하시기 바랍니다. 전체 메뉴얼은 웹사이트에서 제공됩니다. MT5의 전체 버전을 구매하거나 MT4의 무료 버전을 테스트할 수 있습니다. 두 버전 모두 링크에서 확인하실 수 있습니다. 주요 기능 및 기능: 간 스퀘어 지표는 정확한 결정을 위해 기하학적 개념과 간 이론을 활용하는 시장 분석을 위한 포괄적인 도구 집합을 제공합니다. 주요 기능은 다음과 같습니다. 9의 제곱 분석:   이 지표는 9의 제곱에 대한 수평 선, 스타 패턴, 그리드 및 간 팬을 그릴 수 있습니다. 간
ICT, SMC, SMART MONEY CONCEPTS, SMART MONEY, Smart Money Concept, Support and Resistance, Trend Analysis, Price Action, Market Structure, Order Blocks, BOS/CHoCH,   Breaker Blocks ,  Momentum Shift,   Supply&Demand Zone/Order Blocks , Strong Imbalance,   HH/LL/HL/LH,    Fair Value Gap, FVG,  Premium  &   Discount   Zones, Fibonacci Retracement, OTE, Buy Side Liquidity, Sell Side Liquidity, BSL/SSL Taken, Equal Highs & Lows, MTF Dashboard, Multiple Time Frame, BigBar, HTF OB, HTF Market Structure
BookMap HeatMap
Roberto Spadim
1 (2)
This Indicator creates a heatmap based on depth of market of the current symbol or another symbol. Other symbol is useful when you trade futures market and a contract has 'mini' and 'full' split. For example, in Brazil (B3 - BMF&Bovespa), WDO and DOL are future Forex contract of BRL/USD (where 1 DOL = 5 WDO) and big banks work mostly with DOL (where liquidity is important). Please use with M1 timeframe , objects are too small to be displayed at higher timeframes (MT5 limit). The number of level
Black Dragon indicator mt5
Ramil Minniakhmetov
4.83 (58)
추세 감지 표시기는 모든 전략을 보완하며 독립적인 도구로도 사용할 수 있습니다.   장점 사용하기 쉽고 불필요한 정보로 차트에 과부하가 걸리지 않습니다. 모든 전략에 대한 필터로 사용할 수 있습니다. 기본 제공 수준의 동적 지원 및 저항이 있어 이익을 얻고 손절매를 설정하는 데 모두 사용할 수 있습니다. 촛대가 닫힌 후에도 표시기는 색상을 변경하지 않습니다.  주식 시장, 지수, 석유, 금 및 모든 시간대에서 작동합니다. 토스트 알림, 이메일 알림, 푸시 알림 및 소리 알림 기능이 있습니다. 내 다른 개발은 여기에서 찾을 수 있습니다:   https://www.mql5.com/ko/users/mechanic/seller 입력 매개변수 Alert - 켜기/끄기. 알리다; Push Notification - 켜기/끄기. 푸시 알림; Mail - 켜기/끄기 이메일 알림; Fibo 1,2,3,4,5,6,7,11,21,31,41,51,61,71 - 동적 지원 및 저항 수준 설정.
Berma Bands
Muhammad Elbermawi
5 (3)
Berma Bands(BBs) 지표는 시장 동향을 파악하고 이를 활용하려는 트레이더에게 귀중한 도구입니다. 가격과 BBs 간의 관계를 분석함으로써 트레이더는 시장이 추세 단계인지 범위 단계인지를 분별할 수 있습니다. 자세한 내용을 알아보려면 [ Berma Home Blog ]를 방문하세요. 버마 밴드는 세 개의 뚜렷한 선으로 구성되어 있습니다. 어퍼 버마 밴드, 미들 버마 밴드, 로어 버마 밴드입니다. 이 선들은 가격 주위에 그려져 전체 추세에 대한 가격 움직임을 시각적으로 표현합니다. 이 밴드들 사이의 거리는 변동성과 잠재적인 추세 반전에 대한 통찰력을 제공할 수 있습니다. 버마 밴드 라인이 각각에서 분리될 때, 그것은 종종 시장이 횡보 또는 범위 이동 기간에 접어들고 있음을 시사합니다. 이는 명확한 방향 편향이 없음을 나타냅니다. 트레이더는 이러한 기간 동안 추세를 파악하기 어려울 수 있으며 더 명확한 추세가 나타날 때까지 기다릴 수 있습니다. 버마 밴드 라인이 단일 라인으로
Gold Trend 5
Sergei Linskii
3.5 (2)
금 추세 - 좋은 주식 기술 지표입니다. 인디케이터 알고리즘은 자산의 가격 움직임을 분석하고 변동성과 잠재적 진입 구간을 반영합니다. 최고의 지표 신호: - 매도 = 빨간색 히스토그램 + 빨간색 숏 포인터 + 같은 방향의 노란색 신호 화살표. - 매수 = 파란색 히스토그램 + 파란색 롱 포인터 + 같은 방향의 아쿠아 신호 화살표. 인디케이터의 장점 1. 표시기는 높은 정확도로 신호를 생성합니다. 2. 확인된 화살표 신호는 추세가 바뀔 때만 다시 그릴 수 있습니다. 3. 모든 브로커의 메타트레이더 5 거래 플랫폼에서 거래할 수 있습니다. 4. 모든 자산(통화, 금속, 암호화폐, 주식, 지수 등)을 거래할 수 있습니다. 5. H1 차트주기(중기 트레이딩)에서 거래하는 것이 좋습니다. 6. 지표 설정에서 개별 매개 변수(TF, 색상 등)를 변경할 수 있으므로 각 트레이더가 지표를 쉽게 사용자 지정할 수 있습니다. 7. 이 보조지표는 독립적인 트레이딩 시스템뿐만 아니라 트레이딩
소개       Quantum Breakout PRO   , 브레이크아웃 존 거래 방식을 변화시키는 획기적인 MQL5 지표! 13년 이상의 거래 경험을 가진 숙련된 트레이더 팀이 개발한       퀀텀 브레이크아웃 PRO       혁신적이고 역동적인 브레이크아웃 존 전략으로 거래 여정을 새로운 차원으로 끌어올리도록 설계되었습니다. Quantum Breakout Indicator는 5개의 이익 목표 영역이 있는 브레이크아웃 영역의 신호 화살표와 브레이크아웃 상자를 기반으로 한 손절 제안을 제공합니다. 초보자 거래자와 전문 거래자 모두에게 적합합니다. Quantum EA 채널:       여기를 클릭하세요 중요한! 구매 후 설치 매뉴얼을 받으려면 개인 메시지를 보내주십시오. 추천: 기간: M15 통화쌍: GBPJPY, EURJPY, USDJPY,NZDUSD, XAUUSD 계정 유형: 스프레드가 매우 낮은 ECN, Raw 또는 Razor 브로커 시간: GMT +3 중개인 :
Golden Spikes Detector
Batsirayi L Marango
3.25 (4)
Golden Spikes Detector This indicator is based on an advanced strategy primarily for trading spikes on Boom and Crash Indices. Complex algorithms were implemented to detect high probability entries only. It alerts on potential Buy and Sell entries. To trade spikes on the Deriv or Binary broker, only take Buy Boom and Sell Cash alerts. It was optimised to be loaded on 5-minute timeframe although multiple timeframe analysis is done in the background. Features ·             Desktop pop up and sound
제작자의 제품 더 보기
This MT5 indicator is a conversion of the UT Bot Alerts indicator by @QuantNomad from TradingView. It utilizes ATR to generate custom candles on the chart while providing strong entry signals based on these candles. All buffers, including those for the custom candles and entry signals, are available, making it easy to integrate into any EA. Additionally, various strategies based on this indicator can be found online, or you can contact me for a custom strategy development.
FREE
Order Block by Gerega
Illia Hereha
5 (1)
The  Order Block Indicator for MT5  is a powerful tool designed for traders who use smart money concepts and institutional trading strategies. It automatically detects key order blocks on the chart, helping traders identify high-probability reversal and continuation zones. Key Features: • Automatic Order Block Detection – Highlights strong buying and selling zones based on price action and volume. • Multi-Timeframe Support – Analyze order blocks across different timeframes for better market in
FREE
The  Linear Regression Candles  indicator is a powerful tool that enhances traditional candlestick analysis by incorporating linear regression techniques. It helps traders visualize market trends more clearly by smoothing price movements and reducing noise. Unlike standard candles, Linear Regression Candles are dynamically calculated based on statistical regression, providing a clearer picture of the prevailing market direction. Key Features: • Trend Identification – Highlights the overall mar
FREE
The   Chandelier Exit Indicator   for MT5 is a powerful tool designed to help traders manage trades by dynamically adjusting stop-loss levels based on market volatility. It is based on the   Average True Range (ATR)   and follows the trend, placing stop-loss levels above or below price action, depending on the trend direction. This makes it an effective tool for   trend-following strategies, breakout trading, and risk management . Key Features: •   Dynamic Stop-Loss Placement   – Adjusts stop-
FREE
The  Kijun-Sen Envelope  is a powerful trend-following indicator based on the  Kijun-Sen  line from the Ichimoku Kinko Hyo system. This tool creates dynamic upper and lower bands around the Kijun-Sen, forming an envelope that helps traders identify market trends, potential reversals, and overbought/oversold conditions. Key Features: • Trend Confirmation – Helps determine whether the market is in a strong uptrend, downtrend, or ranging phase. • Support & Resistance Zones – The envelope acts as
FREE
The  Nadaraya-Watson Envelope  is a non-parametric regression-based indicator that helps traders identify trends, support, and resistance levels with smooth adaptive bands. Unlike traditional moving averages or standard deviation-based envelopes, this indicator applies the Nadaraya-Watson kernel regression , which dynamically adjusts to price movements, reducing lag while maintaining responsiveness. Key Features: • Adaptive Trend Detection – Smooths price action while remaining responsive to m
FREE
The  Andean Oscillator  is a powerful momentum-based indicator designed to help traders identify trends, reversals, and market strength with high precision. Inspired by traditional oscillators like the MACD and RSI, this unique tool smooths out price fluctuations and provides clearer signals for both entry and exit points. Key Features: • Momentum & Trend Detection – Helps traders spot bullish and bearish momentum shifts early. • Smoothed Oscillator – Reduces noise and provides more reliable t
FREE
The  Supertrend Indicator for MT5  is a powerful trend-following tool designed to help traders identify market direction with precision. Based on the Average True Range (ATR), it dynamically adjusts to price movements, making it suitable for various trading styles, including scalping, day trading, and swing trading. Key Features: • Accurate Trend Detection – Clearly identifies bullish and bearish trends with a color-coded trend line. • ATR-Based Volatility Adjustment – Adapts to market conditi
FREE
The  Average Force Indicator  is a technical analysis tool designed to measure the strength of price movements by analyzing both momentum and volatility. This indicator is based on the  Force Index , which combines price changes and volume data, but with a smoothing mechanism to provide a clearer and more stable reading of market dynamics. Key Features: • Momentum and Trend Strength Measurement – Helps traders identify the intensity of buying or selling pressure. • Smoothed Force Index Calcula
FREE
The ATR Indicator Based on Heiken Ashi is a unique volatility analysis tool that combines the Average True Range (ATR) with Heiken Ashi candlestick calculations to provide a smoother and more reliable measure of market volatility. Unlike the traditional ATR, which uses standard candlesticks, this indicator applies the Heiken Ashi formula to filter out market noise and deliver a clearer volatility signal. Key Features: • ATR Calculation Based on Heiken Ashi Candlesticks – Offers a more stable v
FREE
The  Zero Lag Least Squares Moving Average (ZLSMA)  is an advanced moving average indicator designed to provide  fast and smooth trend analysis  while eliminating lag. It is based on the  Least Squares Moving Average (LSMA)  but incorporates a zero-lag calculation, making it highly responsive to price changes. This indicator helps traders identify trend direction with minimal delay, making it ideal for both short-term and long-term trading strategies. Key Features: • Zero-Lag Calculation – Red
FREE
The  ATR Finder  indicator for MT5 is a powerful tool designed to help traders analyze market volatility using the  Average True Range (ATR) . This indicator calculates and displays ATR values dynamically, allowing traders to identify periods of high and low volatility, optimize stop-loss and take-profit levels, and refine their trading strategies. Key Features: • Real-time ATR Calculation – Continuously updates ATR values to reflect current market conditions. • Customizable Settings – Adjust
FREE
The   MAAOS Expert Advisor   is a powerful automated trading system that combines   Moving Averages (MA)   and the   Andean Oscillator (AO)   to generate high-probability trading signals. By leveraging these two indicators, MAAOS identifies trend directions and momentum shifts with precision, allowing traders to enter and exit trades at optimal points. Key Features: •   Dual Indicator Strategy   – Uses Moving Averages to determine the overall trend and the Andean Oscillator to confirm entry an
The Dual MACD & Stochastic Expert Advisor (EA)  is a fully automated trading system that utilizes two  MACD (Moving Average Convergence Divergence) indicators along with the  Stochastic Oscillator  to identify high-probability trading opportunities. By combining trend confirmation from MACD with momentum analysis from Stochastic, this EA provides precise entry and exit points for optimized trading performance. Key Features: • Dual MACD Strategy – Uses two MACD indicators with different setting
The  Momentum & EMA Expert Advisor (EA)  is a fully automated trading system that combines  two Momentum indicators  with  Exponential Moving Averages (EMA)  to identify high-probability trade opportunities. This EA leverages momentum strength and trend confirmation to execute precise entries and exits. Key Features: • Dual Momentum Strategy – Uses two Momentum indicators with different periods to confirm price acceleration. • EMA Trend Confirmation – Trades are opened only when the EMAs align
The  Triple MACD Scalping EA  is a fully automated trading system designed for high-frequency scalping. It utilizes three different  MACD indicators  with varying settings to confirm strong market momentum and optimize entry and exit points. This strategy is ideal for short-term traders looking for quick profits in volatile market conditions. Key Features: • Triple MACD Confirmation – Uses three MACDs with different periods to filter false signals and confirm strong trends. • High-Frequency Sc
This strategy combines  three Moving Averages (MAs)  with  Williams Fractals  to identify strong trends and optimal trade entry points. It is designed for traders looking for a simple yet effective approach to follow market trends and capture profitable opportunities. How It Works: • Three Moving Averages (fast, medium, and slow) help determine the overall trend direction. • Williams Fractals identify local highs and lows, signaling potential reversals or trade entries. • Trade Entry occurs wh
This strategy integrates the   Average Force Indicator ,   Andean Oscillator , and   MACD   to identify strong trends, momentum shifts, and optimal trade entry points. It is designed for traders who seek a balanced approach between trend-following and momentum trading. How It Works: •   Average Force Indicator   measures market strength, filtering out weak trends and confirming strong movements. •   Andean Oscillator   identifies momentum shifts and trend continuation signals. •   MACD (Moving
This strategy is designed for  high-frequency scalping , utilizing the  Daily High/Low  levels and the  Andean Oscillator  to identify optimal trade opportunities. It works best in volatile market conditions where price frequently reacts to key levels. How It Works: • Daily High/Low Levels act as dynamic support and resistance zones where price often consolidates or reverses. • Andean Oscillator measures momentum shifts and trend strength, confirming entries with high precision. • Trade Entry:
This strategy combines Linear Regression Candles with UT Bot Alerts to identify high-probability trading opportunities. It is designed for trend-following and breakout trading , making it suitable for multiple timeframes and market conditions. How It Works: • Linear Regression Candles smooth out price action, providing a clear visualization of the trend and reducing market noise. • UT Bot Alerts generate precise entry and exit signals by detecting strong momentum shifts. • Trade Entry: • Buy:
This strategy combines  Bollinger Bands  and the  Relative Strength Index (RSI)  to identify optimal trade opportunities. It is designed for  mean-reversion and trend-following trading , making it effective in various market conditions. How It Works: • Bollinger Bands help determine volatility and overbought/oversold conditions. • RSI  measures momentum and confirms potential reversals. • Trade Entry: • Buy: When the price touches or moves below the lower Bollinger Band, and the RSI is in the
This strategy integrates the  Nadaraya-Watson Envelope , Relative Strength Index (RSI) ,and  ATR Stop Loss Finder to identify high-probability trade setups with dynamic stop-loss placement. It is suitable for both  trend-following and mean-reversion trading styles . How It Works: • Nadaraya-Watson Envelope: A non-parametric regression-based indicator that smooths price action and identifies dynamic support and resistance zones. • RSI: Measures momentum and helps detect overbought/oversold cond
필터:
리뷰 없음
리뷰 답변