RSI back arrows
- 지표
- Smaylle Rafael Coelho Mariano
- 버전: 1.0
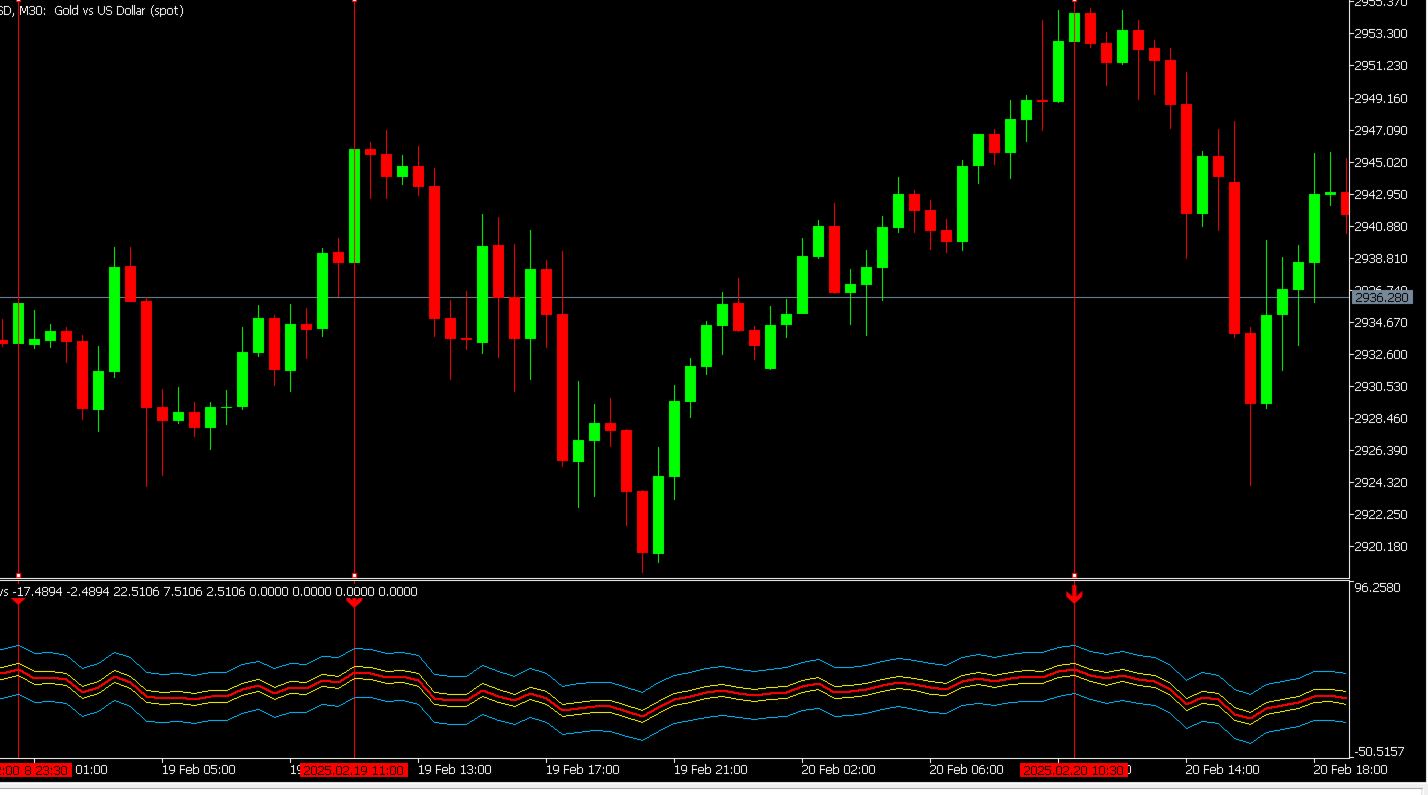
The RSI Back Arrows indicator is a powerful tool designed for traders who rely on the Relative Strength Index (RSI) to identify potential market reversals. This indicator specifically highlights when the RSI has exited the oversold or overbought zones, providing clear visual signals to inform trading decisions.
Key Features:
- Visual Cues: The indicator marks arrows on the chart when the RSI crosses back into a neutral zone, making it easy to spot potential entry and exit points.
- Oversold and Overbought Alerts: Arrows appear when the RSI moves back from levels below 30 (oversold) or above 70 (overbought), indicating possible trend reversals.
- User-Friendly: Designed for traders of all experience levels, the RSI Back Arrows indicator simplifies RSI analysis, allowing for quick decision-making based on market conditions.