• 미리보기
  • 리뷰
  • 코멘트

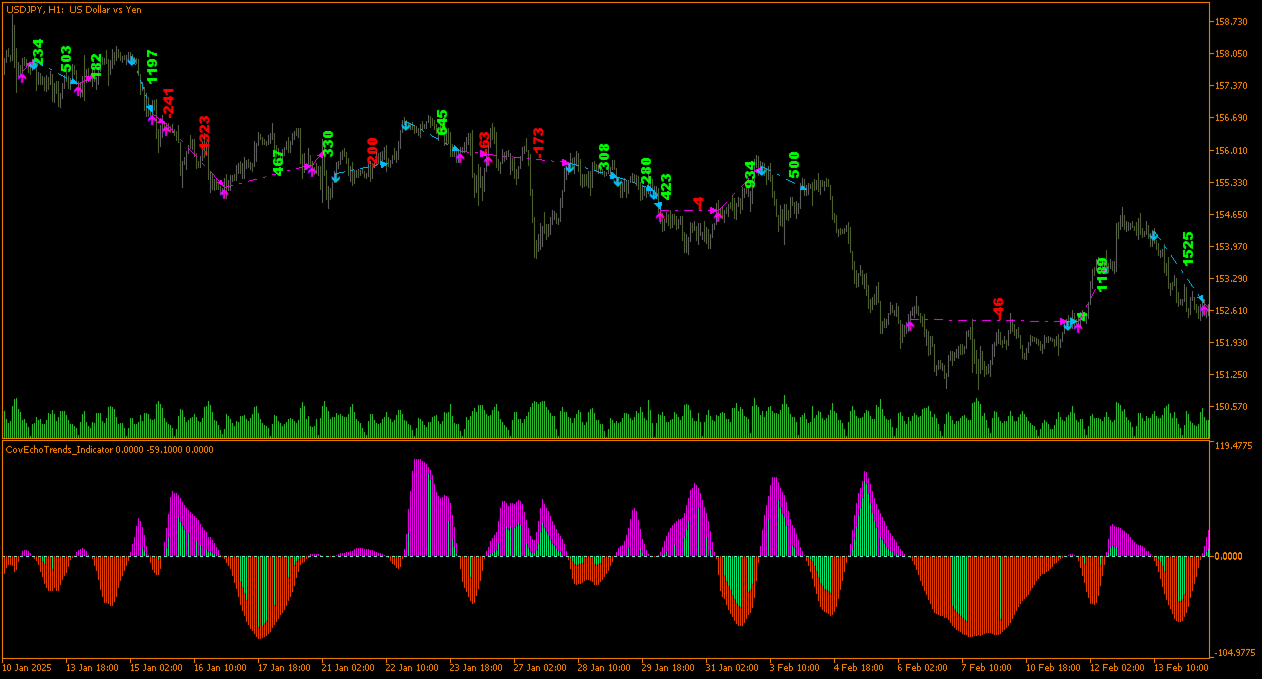
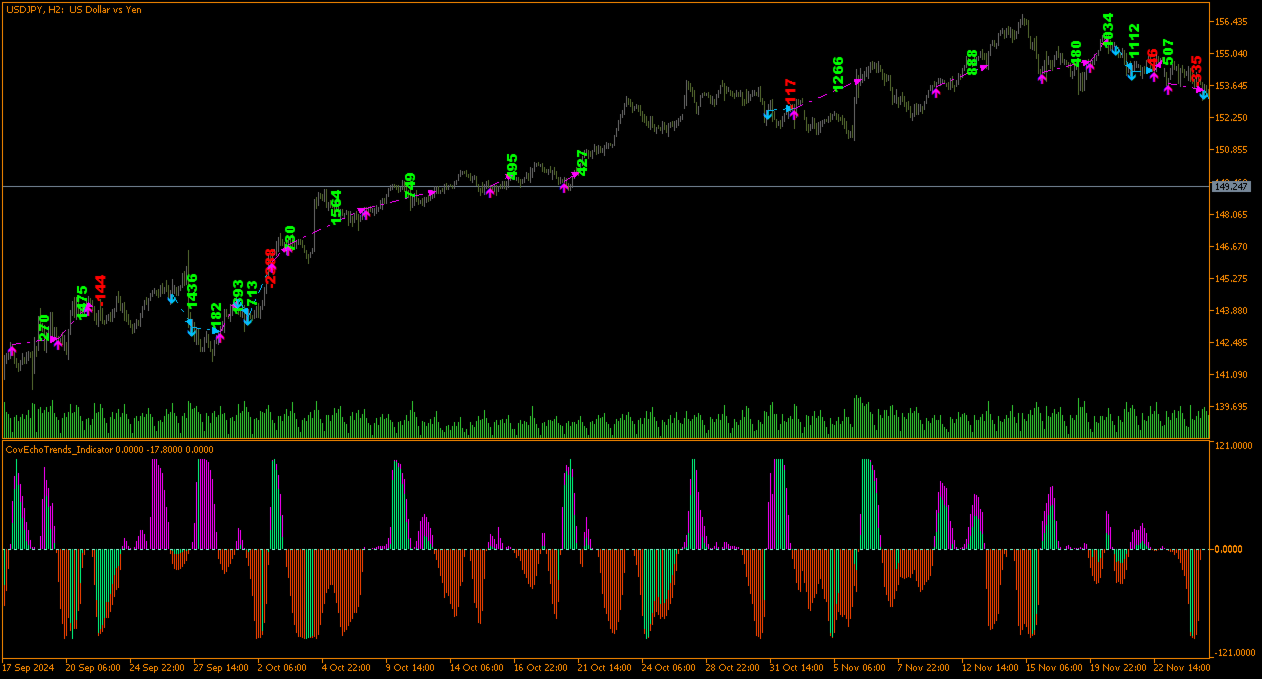
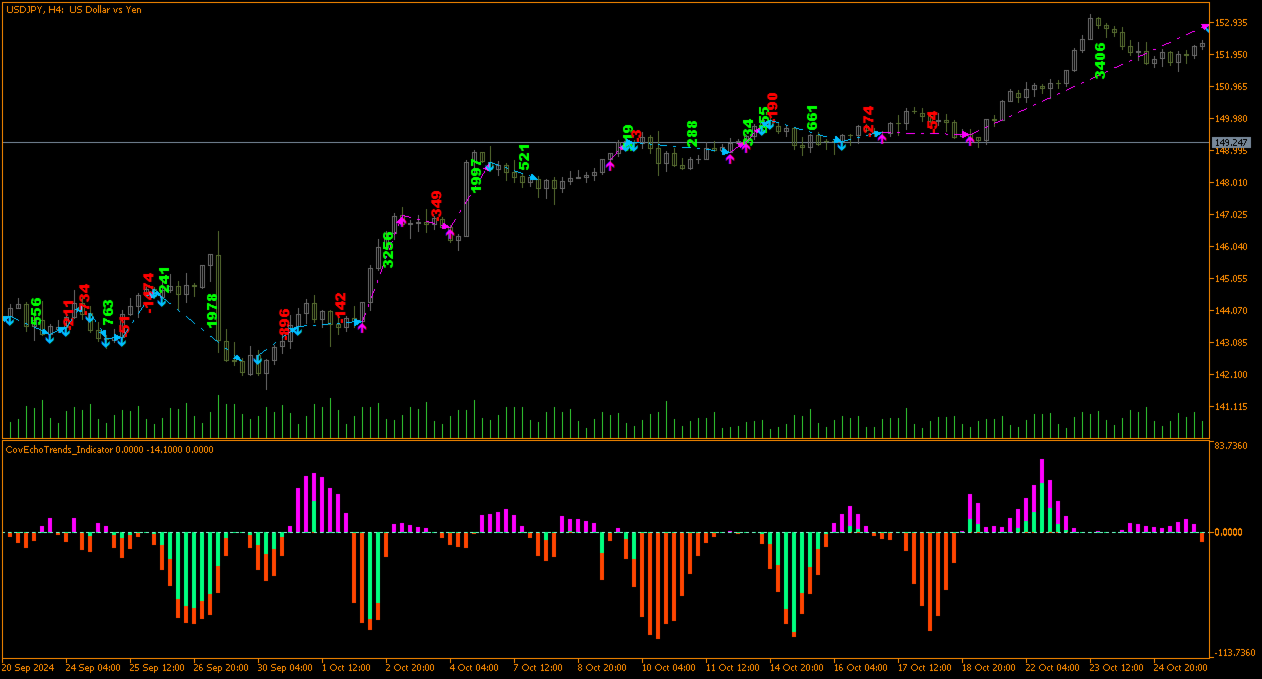
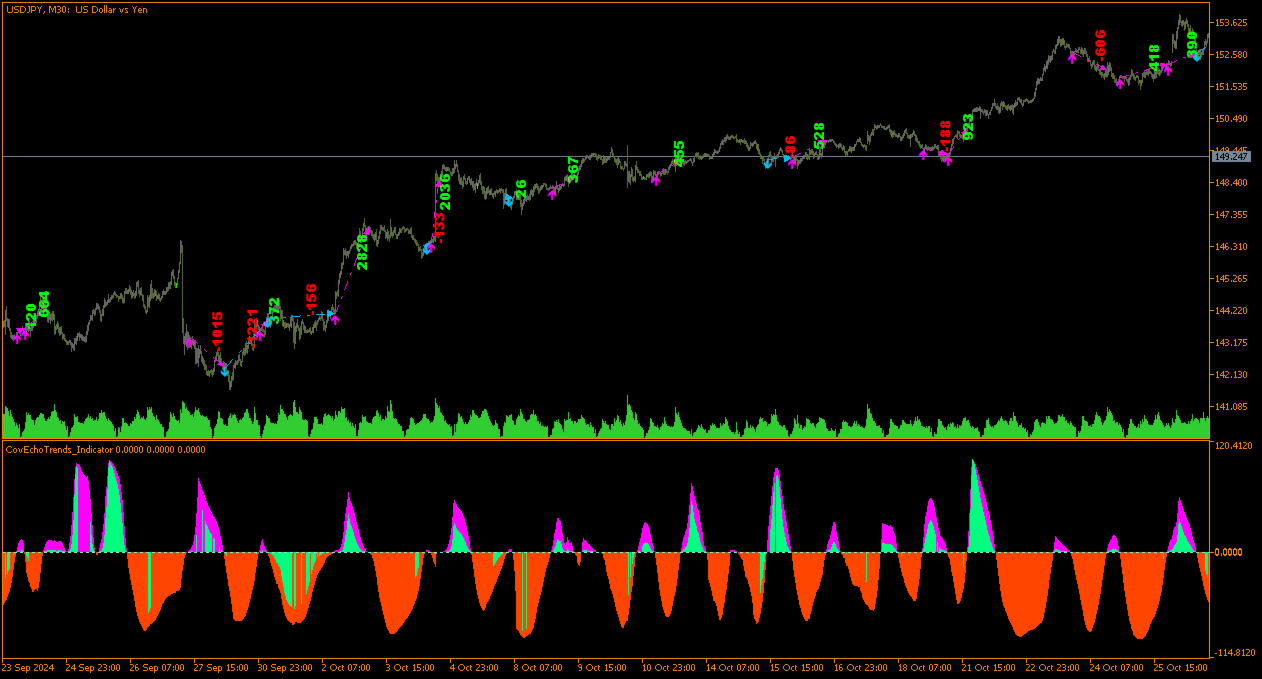
Cov echo trends indicator

Manyal trading system, CovEchoTrend Robot, focuses on reliability and flexibility. By employing statistical analysis methods to study the relationships between the base indicator and market patterns, the system enables a deeper understanding of market processes.

  • Intelligent pattern analysis: The application of statistical data processing helps identify key trend reversal points more accurately, signaling significant market shifts.
  • Informed decision-making is based on the intersection of indicators derived from complex mathematical calculations. This approach minimizes subjective influences and emotional biases, ensuring maximum precision in selecting optimal entry points.
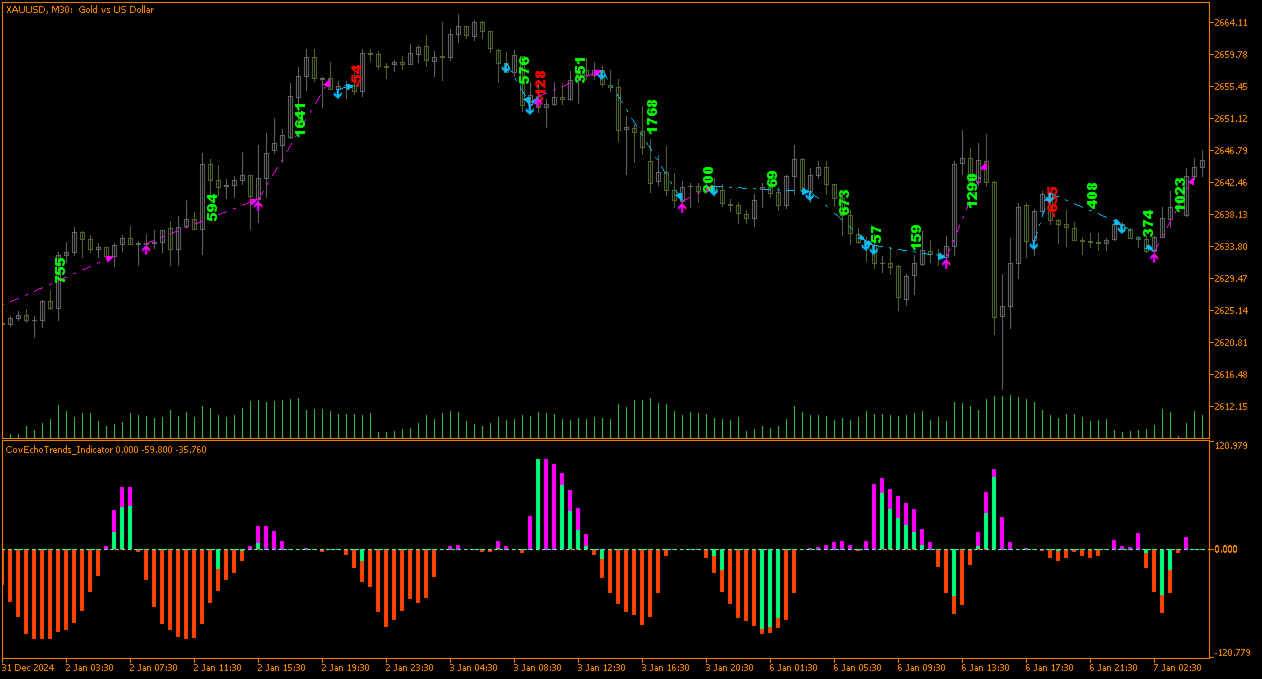
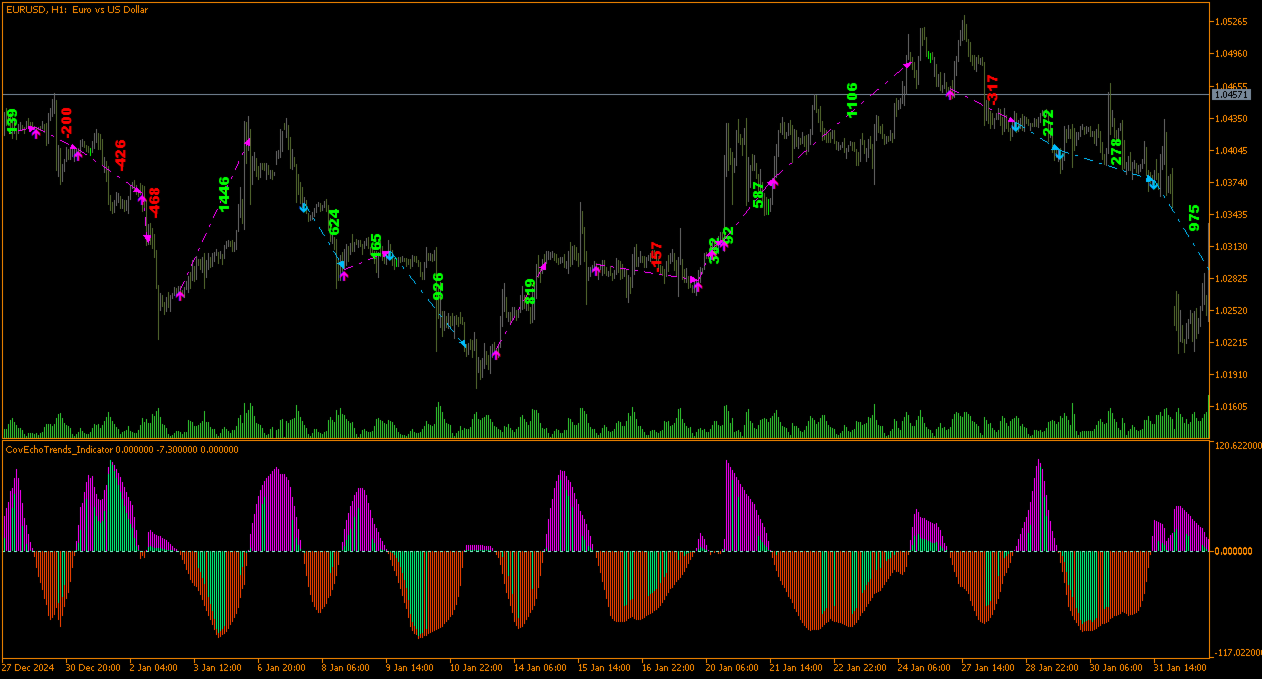
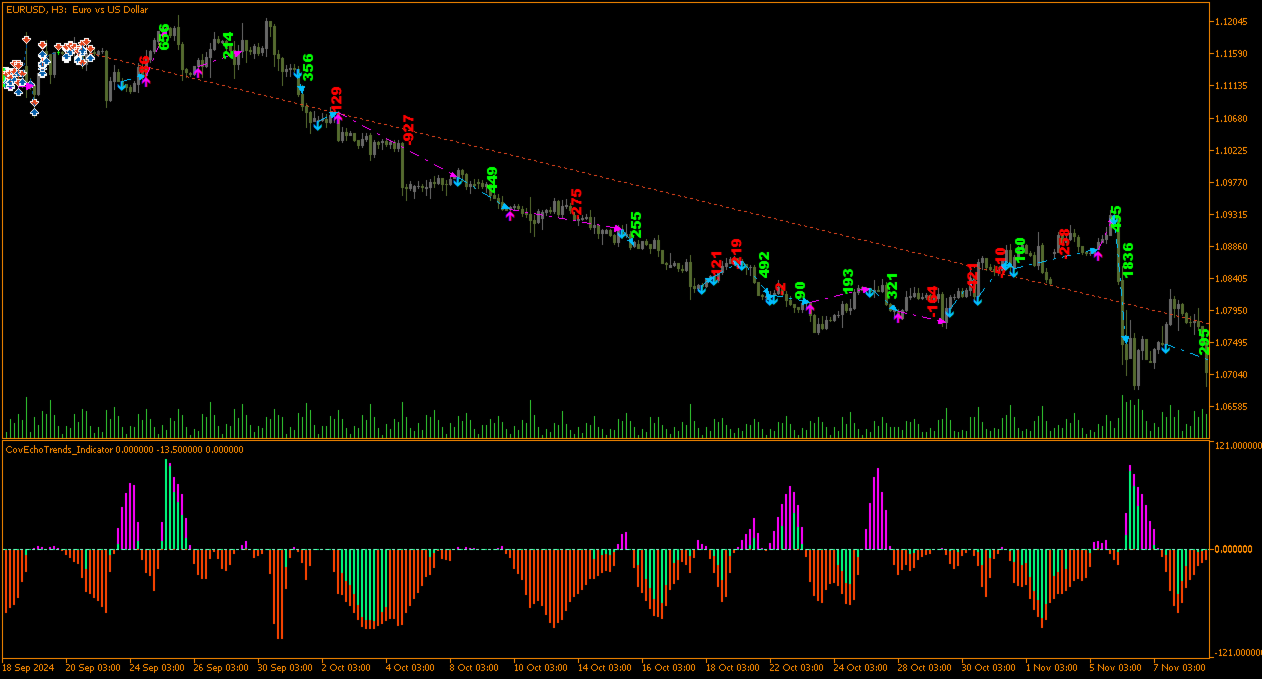
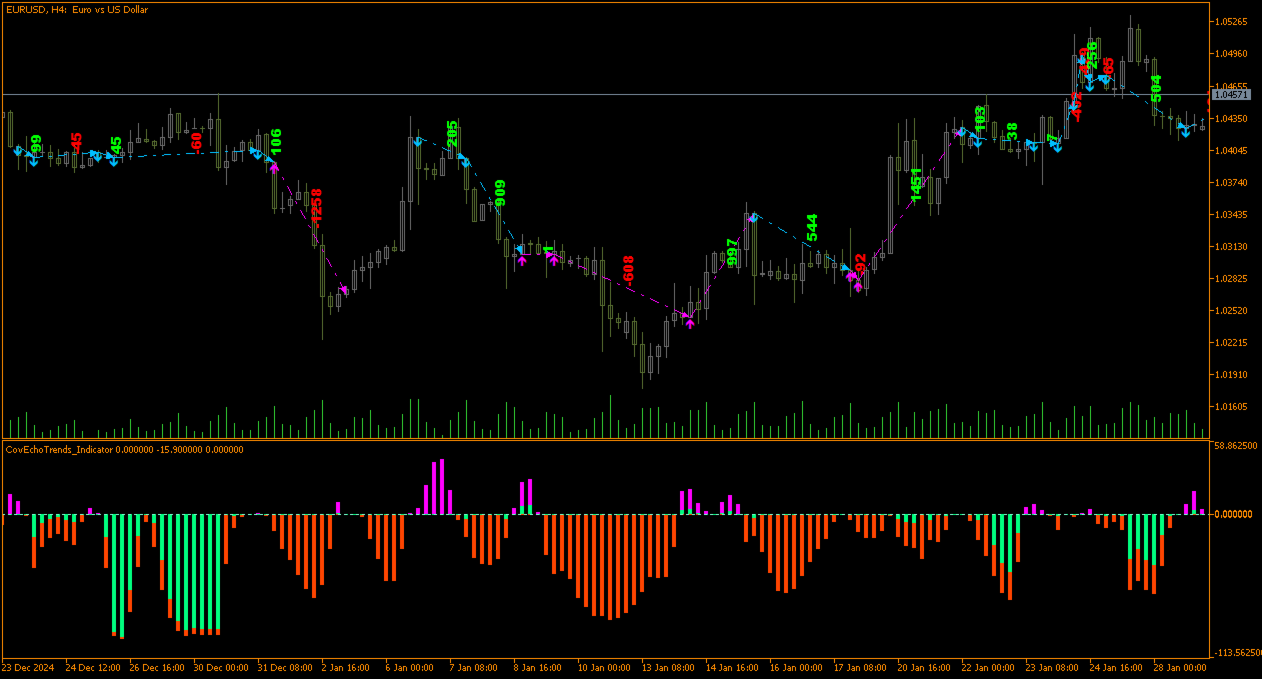
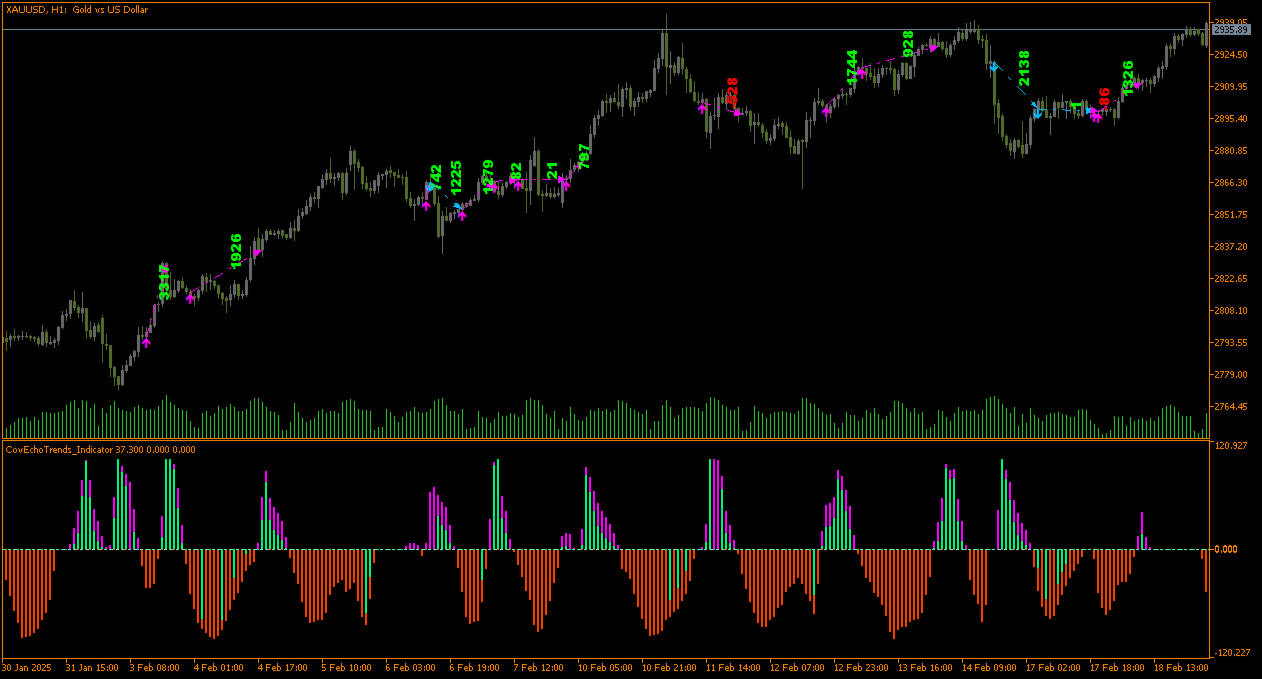
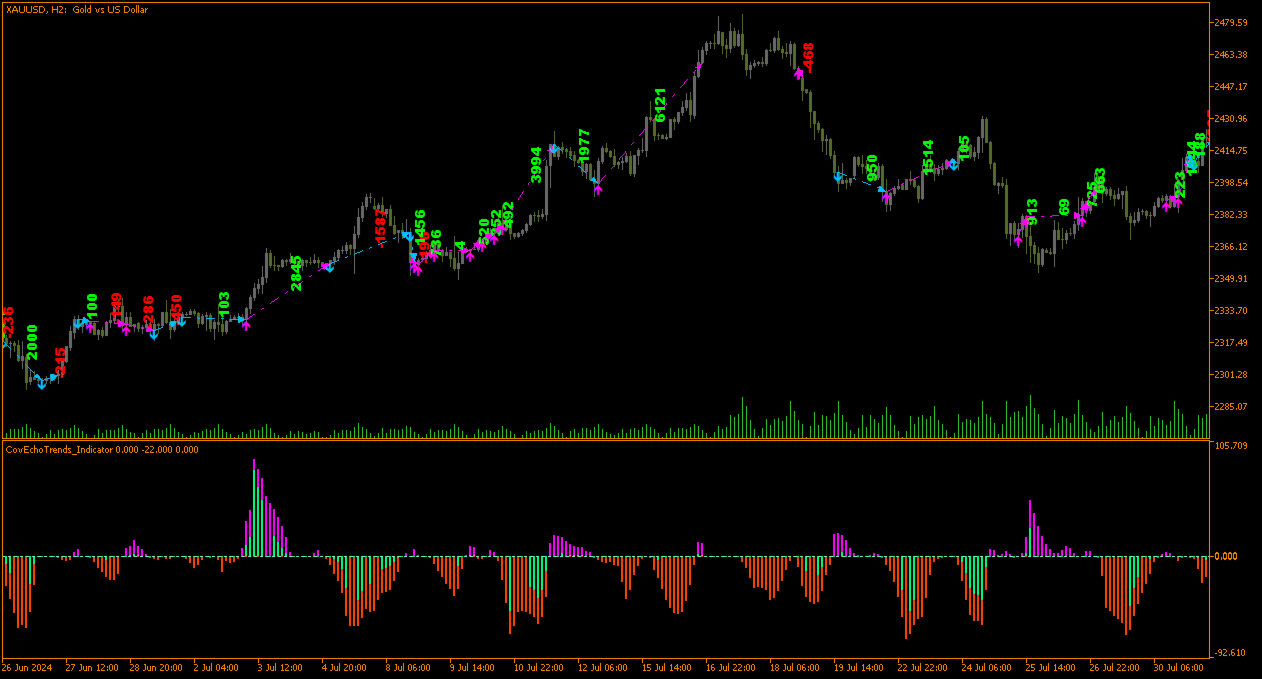
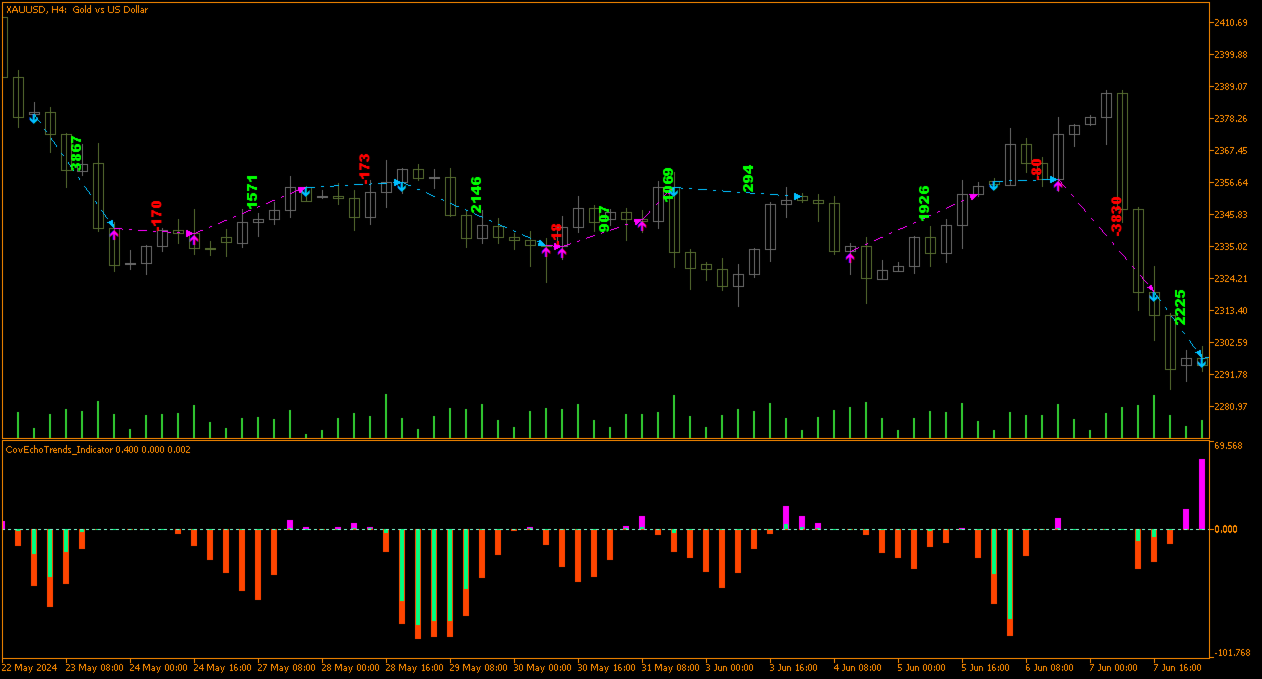
  • Adaptability to dynamic markets: The advisor is optimized for use with XAUUSD, EURUSD, and USDJPY - instruments known for their high volatility and clear trend responsiveness.
  • At the same time, it maintains maximum flexibility in choosing timeframes: M30, H1, H2, H3, and H4.
  • Combining correlation-covariance statistical analysis techniques allows tracking both short-term market fluctuations (linear regression links) and long-term trends (slow covariance grid). This comprehensive system filters out random fluctuations while focusing on meaningful events, enhancing the reliability of decisions made.

CovEchoTrend System is not just software - it's an effective tool for in-depth market analysis. It combines mathematical rigor with real-time market sensitivity, becoming your trusted companion in dynamic market conditions where reliability and adaptability are paramount. Through the use of statistically processed data, this advisor opens up unique perspectives for exploring the market.

추천 제품
Visual Range Directional Force Indicator
AL MOOSAWI ABDULLAH JAFFER BAQER
Range Directional Force Indicator – Designed for You to Optimize! The Range Directional Force Indicator is a cutting-edge tool designed to empower traders by visualizing market dynamics and directional strength. Built to offer insights into market trends and reversals, this indicator is an invaluable asset for traders seeking precision in their strategies. However, it is important to note that this indicator is not optimized , leaving room for you to tailor it to your unique trading preferenc
Ugenesys AI MT5
Odaine Ramon Mcmillan
uGenesys AI - 90% Accurate Daytrading Indicator Introducing the ultimate forex trading indicator system, uGenesys AI, powered by cutting-edge AI technology and advanced analytical techniques, including Time-Series Analysis and Genetic Algorithms. Our AI-powered trading system leverages the power of time-series analysis to identify trends and patterns in historical price data, allowing traders to make informed predictions about future market movements. By analyzing vast amounts of data, our syst
Based on the trading model/strategy/system of gold double-position hedging and arbitrage launched by Goodtrade Brokers, problems encountered in daily operations: 1. Account B immediately places an order immediately following account A. 2: After account A places an order, account B will automatically copy the stop loss and take profit. 3: Account A closes the position of Account B and closes the position at the same time. 4: When account B closes the position, account A also closes the position.
Expert. Automatic and manual trading. Ready-made trading system based on Elliott waves and Fibonacci retracement levels . It is simple and affordable. Display of the marking of Elliott waves (main or alternative option) on the chart. Construction of horizontal levels, support and resistance lines, a channel. Superposition of Fibonacci levels on waves 1, 3, 5, A Alert system (on-screen, E-Mail, Push notifications).    visual panel for opening orders in manual trading. visual panel for setting up
Antique Trend
Nadiya Mirosh
The Antique Trend Indicator is a revolutionary trend trading and filtering solution with all the important features of a trend tool built into one tool! The Antique Trend indicator is good for any trader, suitable for any trader both for Forex and binary options. There is no need to configure anything, everything has been perfected by time and experience, it works great during flats and trends. The Antique Trend indicator is a tool for technical analysis of financial markets, reflecting curren
General Description In the simplest terms this is a contrarian intra-day scalping system. Built to try and let correct trades run as far as possible and flip the trade when indicated. The indicator looks at historical daily trading ranges to lay out levels at which it takes long and short positions based on the statistical levels. The indicator is built around index futures, mainly around S&P and the DOW but can be used an any futures contract mainly using AMP Futures to trade. The indicator is
The key logic of SignalTech is generated by Artificial Intelligence. The machine learning module should continue optimizing the core logic on the server side to guarantee that SignalTech System can accurately track the market's movement.  SignalTech can generate AI based signals with Buy/Sell Arrows and Pop-Up/Sound Alerts. Each signal has clear Entry and stop Loss levels, which should be automatically flagged on the chart, as well as potential Targets 1, 2, and 3. SignalTech can work on EURU
To download MT4 version please click here . - This is the exact conversion from TradingView: "Trend Direction Force Index - TDFI [wm]" By "causecelebre". - The screenshot shows similar results from tradingview and Metatrader when tested on ICMarkets on both platforms. - This indicator uses multiple levels of averaging to detect trend strength. - You can optimize filter low and filter high levels to achieve best results. - You have access to buffers to use in EAs. - This is a light-load processin
Noize Absorption Index
Ekaterina Saltykova
Noize Absorption Index - is the manual trading system that measures the difference of pressure between bears forces and bulls forces. Green line - is a noize free index that showing curent situation. Zero value of index shows totally choppy/flat market.Values above zero level shows how powerfull bullish wave is and values below zero measures bearish forces.Up arrow appears on bearish market when it's ready to reverse, dn arrow appears on weak bullish market, as a result of reverse expectation.
Premium level Pro
Dmitriy Kashevich
Premium level is a unique indicator with more than 80% accuracy of correct predictions! This indicator has been tested for more than two months by the best Trading Specialists! The author's indicator you will not find anywhere else! From the screenshots you can see for yourself the accuracy of this tool! 1 is great for trading binary options with an expiration time of 1 candle. 2 works on all currency pairs, stocks, commodities, cryptocurrencies Instructions: As soon as the red arrow app
VI Vortex
Fernando Lahude Ritter
4.75 (4)
Description : Enhance Your Trading Strategy with the Advanced Vortex Indicator for MT5! Discover the power of the Vortex Indicator (VI), a robust technical analysis tool now available for MetaTrader 5. This custom-built indicator is designed to help traders identify trends and reversals, offering a critical edge in the dynamic Forex market. Key Features: Dynamic Trend Identification : With the VI's unique calculations of VI+ (positive) and VI- (negative) lines, you can easily spot trend strength
FREE
FlowVol AllinOne
Thalles Nascimento De Carvalho
FlowVol All-in-One: DOM, VSA 및 Times and Sales를 통한 완벽한 흐름 분석 MT5에서 주문 흐름 분석을 한 단계 끌어올릴 준비가 되셨나요? FlowVol All-in-One은 주문 흐름 트레이더를 위한 궁극적인 도구로, 세 가지 주요 볼륨 분석 기술(DOM, VSA, Times and Sales)을 하나의 강력한 지표로 결합합니다. 이 도구의 모든 잠재력을 활용하려면 브로커의 주문서에 접근할 수 있어야 합니다. 스캘퍼와 단기 트레이더에게 이상적인 이 지표는 정확한 진입과 퇴출을 위한 중요한 통찰을 제공하며, 시장에서 기회를 빠르게 파악하는 데 도움을 줍니다. 정확하게 가격 변동 식별하기 FlowVol All-in-One은 고급 주문서 분석을 통해 주문서의 불균형을 식별하고, 빠르고 정확한 결정을 내릴 수 있는 자세한 정보를 제공합니다. 이 지표는 주문 흐름과 거래량에 대한 완전한 분석을 제공하여, 시장의 전략적이고 미세한 움직임을 포착
Supply and Demand Indicator + FREE Currency Strength Meter ADD-ON Looking for a powerful tool that can help you identify the most reactive zones in the forex market? Our supply and demand indicator for MetaTrader 4 and 5 is exactly what you need. With its advanced algorithms and real-time analysis, this indicator helps traders of all experience levels make informed trading decisions. The supply and demand indicator is a cutting-edge tool that helps traders identify areas where buyers and sellers
Trend Catcher with Alert MT5
Issam Kassas
4.71 (78)
트렌드 캐쳐: 알림 인디케이터와 함께 하는 트렌드 캐쳐 전략은 시장 트렌드와 잠재적인 진입 및 체크 포인트를 식별하는 데 도움이 되는 다목적 기술 분석 도구입니다. 이는 시장 상황에 적응하여 트렌드 방향을 명확하게 시각적으로 표현하는 동적 트렌드 캐쳐 전략을 제공합니다. 트레이더는 선호도와 위험 허용도에 맞게 매개변수를 사용자 정의할 수 있습니다. 이 인디케이터는 트렌드 식별을 지원하고 잠재적인 반전을 신호로 제공하며 트레일링 스탑 메커니즘으로 작동하며 실시간 경고를 제공하여 신속한 시장 대응을 돕습니다. 특징: - 트렌드 식별: 상승 트렌드와 하락 트렌드를 신호합니다. - 트렌드 반전: 양봉 색상이 상승에서 하락으로 변경되거나 그 반대의 경우 잠재적인 반전을 경고합니다. - 실시간 경고: 새로운 트렌드 식별을 위한 경고를 생성합니다. 추천사항: - 통화 및 페어: EURUSD, AUDUSD, XAUUSD 등... - 시간 프레임: H1. - 계정 유형: 모든 ECN 계정
FREE
To download MT4 version please click here . This is the exact conversion from TradingView: "WaveTrend [LazyBear]" By "zeusuk3". One of the coolest indicators out there to detect overbought and oversold zones. It can be used as a part of more complicated strategy and for confirming a potential trade setup. There are buffers to use in EAs also. The indicator is loaded light and non-repaint. - You can message in private chat for further changes you need. Thanks for downloading 
ROMAN5 Time Breakout Indicator automatically draws the boxes for daily support and resistance breakouts. It helps the user identifying whether to buy or sell. It comes with an alert that will sound whenever a new signal appears. It also features an email facility. Your email address and SMTP Server settings should be specified in the settings window of the "Mailbox" tab in your MetaTrader 5. Blue arrow up = Buy. Red arrow down = Sell. You can use one of my Trailing Stop products that automatical
FREE
Stormer RSI 2
Ricardo Rodrigues Lucca
This strategy was learned from Stormer to be used on B3. Basically, 15 minutes before closing the market, it will check RSI and decided if it will open an position. This strategy do not define a stop loss. If the take profit reach the entry price it will close at market the position. The same happens if the maximal number of days is reached. It is created to brazilian people, so all configuration are in portuguese. Sorry Activations allowed have been set to 50.
Diamond Scalping Forex
Lo Thi Mai Loan
4.6 (5)
Diamond Scalping Forex에 오신 것을 환영합니다 런칭 프로모션 현재 가격으로 남은 2개만 판매 중!  다음 가격: $1993.99   이 EA는 100% 가격 행동 기반 전략을 사용하며, 돌파, 되돌림, 실패한 돌파와 같은 작은 기술들을 통해 최고 승률을 가진 진입점을 찾습니다. EA는 각 거래에 대해 항상 고정된 손절매(SL)를 설정합니다. EA는 마팅게일(Martingale)이나 그리드(Grid)와 같은 위험한 전략을 사용하지 않으며, 계좌 안전을 보장합니다. EA는 추적 손절매(Trailing Stop)를 사용하여 이익을 잠금합니다. --- 왜 Diamond Scalping Forex를 선택해야 하나요? - EA는 EURUSD, USDJPY, GBPUSD와 같은 여러 통화쌍으로 거래할 수 있습니다. - EA는 US30, Nas100과 같은 인덱스 쌍으로도 거래할 수 있습니다. - EA는 GOLD/XAU로도 거래할 수 있습니다. - 특히, EA는 10
My Trendline
Ashok Kumar Singha
My Trendline is an Indicator based on Upper and Lower Trendline which will Plot Automatically into the Chart. This Indicator will perfectly indicate you the Trend of the Market. It can be use in any Time Frame. The Indicator will automatically adjust according to the Current Time Frame. Steps to Setup the Indicator: Install the Custom Indicator; Set all the Inputs, Line Color, Width and Styles etc. (Can use the Default Setting also); Set visualization to All Timeframe; and DONE It can
Live signal https://www.mql5.com/en/users/datbh/seller [MT4 version: https://www.mql5.com/en/market/product/93601 ] ! Next price --> $699 and final: 1779$ This is a smart grid-based automated trading system, meticulously developed from over a decade of trading experience. The system leverages quantitative analysis, trend evaluation, and key resistance levels to execute precise entries. Our EA specializes in trading three major currency pairs: AUDCAD NZDCAD AUDNZD Designed with both efficiency a
Introducing to your attention an innovative expert advisor created specifically for the most juicy and volatility    currency     basket: GBPUSD, XAUUSD and EURJPY. This system is designed using the main features of this market's movement, making it an ideal choice for dynamic trading on high-trending and medium-volatile pairs.   The signals are focused on minimizing trading risks, aiming to reduce losses to a minimum. Main features ESignals is designed to show open and close arrows at the beg
숫자 시퀀스 중 하나를 "산불 시퀀스"라고 합니다. 가장 아름다운 새로운 시퀀스 중 하나로 인식되었습니다. 주요 특징은 이 시퀀스가 ​​가장 짧은 경우에도 선형 추세를 피한다는 것입니다. 이 지표의 기초를 형성한 것은 이 속성입니다. 금융 시계열을 분석할 때 이 지표는 가능한 모든 추세 옵션을 거부하려고 합니다. 그리고 그가 실패하는 경우에만 그는 추세의 존재를 인식하고 적절한 신호를 제공합니다. 이 접근 방식을 통해 새로운 트렌드가 시작되는 순간을 정확하게 결정할 수 있습니다. 그러나 거짓 긍정도 가능합니다. 숫자를 줄이기 위해 이 표시기에 추가 필터가 추가되었습니다. 새 막대가 열리면 신호가 생성됩니다. 어떤 경우에도 다시 그리기가 발생하지 않습니다. 표시 매개변수: Applied Price   - 적용된 가격 상수. Period Main   - 표시기의 기본 기간, 유효한 값은 5 - 60 이내입니다. Period Additional   - 추가 기간, 이 매개변수의 유효한
PipFinite Exit EDGE MT5
Karlo Wilson Vendiola
4.86 (29)
Did You Have A Profitable Trade But Suddenly Reversed? In a solid strategy, exiting a trade is equally important as entering. Exit EDGE helps maximize your current trade profit and avoid turning winning trades to losers. Never Miss An Exit Signal Again Monitor all pairs and timeframes in just 1 chart www.mql5.com/en/blogs/post/726558 How To Trade You can close your open trades as soon as you receive a signal Close your Buy orders if you receive an Exit Buy Signal. Close your Sell orders if
Riko Trend mt5
Nadiya Mirosh
The Riko Trend indicator is a revolutionary trend trading and filtering solution with all the important features of a trend tool built into one tool! The Riko Trend indicator is good for any trader, suitable for any trader for both forex and binary options. You don’t need to configure anything, everything is perfected by time and experience, it works great during a flat and in a trend. The Riko Trend indicator is a technical analysis tool for financial markets that reflects the current price f
Trend Turn
Ivan Simonika
The implementation of the Trend Turn trend indicator is simple - in the form of lines of two colors. The indicator algorithm is based on standard indicators as well as its own mathematical calculations. The indicator will help users determine the direction of the trend. It will also become an indispensable advisor for entering the market or closing a position. This indicator is recommended for everyone, both beginners and professionals. How to interpret information from the indicator. We sell
GCA Scalping Ranges EA
James Peyton Jr Page
General Description In the simplest terms this is a contrarian intra-day scalping system. Built to try and let correct trades run as far as possible and flip the trade when indicated. Join the conversation over at our Discord channel  -  https://discord.gg/ScsdkTnwyA I will do my best to be around to answer any questions and help set up. If you want to add your settings screenshots its more than welcome! The EA looks at historical daily trading ranges to lay out levels at which it takes long an
Meet the new generation ichimoku cloud. You can develop hundreds of strategies on it. Or you can open a trade directly by looking at whether it is above or below the cloud. Now it is much easier to know the trend... Once you get used to this cloud, you won't be able to look at the graphics without it. The calculation logic is completely different and you will experience the privilege of looking at the market from a different perspective. By looking at the chart, set the appropriate paramete
Owl Smart Levels MT5
Sergey Ermolov
4.1 (29)
MT4 버전  |  FAQ Owl Smart Levels Indicator 는 Bill Williams 의 고급 프랙탈, 시장의 올바른 파동 구조를 구축하는 Valable ZigZag, 정확한 진입 수준을 표시하는 피보나치 수준과 같은 인기 있는 시장 분석 도구를 포함하는 하나의 지표 내에서 완전한 거래 시스템입니다. 시장과 이익을 취하는 장소로. 전략에 대한 자세한 설명 표시기 작업에 대한 지침 고문-거래 올빼미 도우미의 조수 개인 사용자 채팅 ->구입 후 나에게 쓰기,나는 개인 채팅에 당신을 추가하고 거기에 모든 보너스를 다운로드 할 수 있습니다 힘은 단순함에 있습니다! Owl Smart Levels 거래 시스템은 사용하기 매우 쉽기 때문에 전문가와 이제 막 시장을 연구하고 스스로 거래 전략을 선택하기 시작한 사람들 모두에게 적합합니다. 전략 및 지표에는 눈에 보이지 않는 비밀 공식 및 계산 방법이 없으며 모든 전략 지표는 공개되어 있습니다. Owl Smart Levels를 사
GoldTrader
Yashar Seyyedin
Please backtest with the exact balance of your live account before applying to real money. ==> If account balance is too low it may not trade at all! For MT4 version please contact via private message. martingale version is available here . Strategy description - Detect trend based on EMA18-EMA50-SMA200 alignment in three time frames: M15, H1, H4 - Trade in trend direction and exit when above alignment is broken. - The bot is tuned to trade XAUUSD(Gold). - The bot output is break even in rangin
FREE
Trend Lines Supports and Resistances is an indicator that analyses the market structure, identifies Pivot Points, displays active Support/Resistance zones and trend levels. Main Features: Defining and displaying Pivot Points. Analyse Pivot Points to build and display trend lines. Setting up visual display of trend lines. Setting up trend lines broken notifications. Analyse Pivot Points to define and display support and resistance levels. Setting up visual display of support and resistance leve
이 제품의 구매자들이 또한 구매함
AriBot
Arman Belassarov
AriMax   – AI-Powered Trading Robot AriMax is a cutting-edge AI-powered trading robot designed to help traders maximize profits while minimizing risk. Utilizing advanced machine learning algorithms and real-time market analysis, AriMax identifies high-probability trade opportunities with precision and speed. Key Features:     AI-Driven Market Analysis   – Analyzes market trends and patterns to make data-driven trading decisions.     Automated Execution   – Places trades seamlessly with optimiz
CBT Quantum Maverick 고효율 바이너리 옵션 거래 시스템 CBT Quantum Maverick는 정밀하고 간단하며 체계적인 거래를 원하는 트레이더를 위해 설계된 고성능 바이너리 옵션 거래 시스템입니다. 사용자 지정이 필요 없으며, 처음부터 최적화된 결과를 제공합니다. 약간의 연습만으로 신호를 쉽게 마스터할 수 있습니다. 주요 특징: 정확한 신호 제공: 현재 봉 데이터를 기반으로 다음 캔들에 대한 신호를 생성하며, 빈번한 재도색이 없습니다. 다양한 시장에 대한 적응성: 바이너리 옵션 거래에 특화되었으며, 여러 브로커 및 자산 클래스와 호환됩니다. 호환 가능: Deriv Synthetic Charts: 모든 시간 프레임에서 사용 가능. OTC 차트: Quotex, PocketOption, Binomo, Stockity, IQOption, Exnova, OlympTrade, Deriv, Binolla, Homebroker 등의 브로커와 호환(MT5로의 무료 데이터 임
IVISTscalp5
Vadym Zhukovskyi
5 (6)
당신에게 소개하는 iVISTscalp5 지표는 독특하면서도 거래 작업에서 효과적입니다. 이 지표는 시간 데이터를 기반으로 하며 금융 시장의 많은 경험과 깊은 분석의 결과입니다. iVISTscalp5 지표는 수동 거래에 뛰어난 도구입니다. 편리성, 간단함 및 시각화 - 모든 복잡성은 숨겨져 있습니다. 우리는 iVISTscalp5 지표의 설정과 사용을 최대한 단순화했습니다. 이 지표는 MT5 터미널에서 가지고 있는 모든 금융 상품에 적합합니다. 시간 기준으로 작동하는 시간은 4am에서 8pm (UTC+3)입니다. iVISTscalp5 지표 메뉴 (스크린샷 1 참조): History - 표시할 주간 수 계산 dT_min - 시간 설정 간격 선택 (분) TFline - 수평 볼륨 생성 (타임프레임) BARSline - 수평 볼륨 생성 (바 수) TFtrend1 - 매일 채널 생성 (타임프레임) BARStrend1 - 매일 채널 생성 (바 수) TFtrend2 - 주간 채널 생성 (타임프레임
WanaScalper
Isaac Wanasolo
1 (1)
A scalping indicator based on mathematical patterns, which on average gives signals with relatively small SL, and also occasionally helps to catch big moves in the markets (more information in the video) This indicator has three main types of notifications: The first type warns of a possible/upcoming signal on the next bar The second type indicates the presence of a ready signal to enter the market/open a position The third type is for SL and TP levels - you will be notified every time price re
EXCLUSIVE! JUST  10 COPIES  AVAILABLE!   BONUS AUX VIP Club 2024 : Include EA CAP, CEP, LDH, PSC307 & AO4C to enhance the performance of this tool to its maximum potential  Click Here to Download Files   ( for users only ) FREE Trading Education Available Daily via Zoom --- For More Info or Instant Message Click link ---  https://t.me/abcdwave Transform your trading with the "Five Magic Bullets" Indicator, tailored for traders who embrace the power of Elliott Wave Chaos Theory.
물론입니다. 아래는 제공해주신 텍스트의 한국어 번역입니다: MT4용 천문학 지표 소개: 귀하의 최상급 하늘 트레이딩 동반자 트레이딩 경험을 천체의 높이로 끌어올리기 준비가 되셨나요? MT4용 천문학 지표를 소개합니다. 이 혁신적인 도구는 복잡한 알고리즘의 힘을 활용하여 탁월한 천문학적 통찰과 정밀한 계산을 제공합니다. 정보의 우주를 손에 담다:   천문학적 데이터의 보물함을 드러내는 포괄적인 패널을 살펴보세요. 행성의 지오/헬리오센트릭 좌표, 태양/지구 거리, 크기, 길이, 별자리, 황도 좌표 및 적도 좌표, 심지어 수평 좌표 등 각각이 정밀하게 계산되고 아름답게 제시됩니다. 지표에 의해 생성된 수직선은 시간 값에 해당하여 트레이딩 여정에 우주적인 시각을 부여합니다. 행성 라인과 관계:   수정 가능한 스케일과 각도로 차트를 장식하는 행성 라인의 마법을 경험해보세요. 직관적인 컨트롤 패널을 통해 각 행성의 라인의 가시성을 손쉽게 전환할 수 있습니다. 쥰션이나 섹스타일, 사분각, 삼분
The indicator is designed to close positions on the market in time. For example: to take profits ahead of schedule if the price has not reached TakeProfit, and the market is turning around. The indicator analyzes the momentum, not the trend. He does not give any information about the trend. The indicator is well suited for finding divergence. The Ershov 38 Parrots indicator dynamically adjusts to the market and detects price movement impulses of medium and high amplitude. It almost does not rea
VTrende Pro
Andrii Diachenko
5 (1)
VTrende Pro - MTF indicator for trend trading with a display panel for MT5 *** Videos can be translated into any language using subtitles (video language - Russian) Although the signals of the VTrende Pro indicator can be used as signals of a full-fledged trading system, it is recommended to use them in conjunction with the Bill Williams TS. VTrende Pro is an extended version of the VTrende indicator. Difference between Pro version and VTrende: - Time zones - Signal V - signal 1-2 waves -    S
Price Action Scanner Pro is an indicator that identifies price behaviors and provides alerts, offering more features and customization compared to Price Action Scanner. This indicator can simultaneously detect signals for up to 15 symbols across different timeframes. You can configure it to detect signals during specific trading sessions such as Asian, European, and US sessions, using different timeframes. This allows you to use lower timeframes for active trading periods and higher timeframes
Smooth price for Monarch
Konstantin Gruzdev
5 (1)
The Smooth Price technical indicator is used for plotting a smoothed line as close to the price of the financial instrument as possible, and serves to eliminate its noise components. The indicator is part of the Monarch trading system, but here it is presented as an independent technical analysis tool. The indicator is based on the cluster digital filter , which, unlike the ClusterSMA , is applied directly to the price time series. Smooth Price does not redraw (except the very last, zero bar) an
Классификатор силы тренда. Показания на истории не меняет. Изменяется классификация только незакрытого бара. По идее подобен полной системе ASCTrend, сигнальный модуль которой, точнее его аппроксимация в несколько "урезанном" виде, есть в свободном доступе, а также в терминале как сигнальный индикатор SilverTrend . Точной копией системы ASCTrend не является. Работает на всех инструментах и всех временных диапазонах. Индикатор использует несколько некоррелируемых между собой алгоритмов для класси
Pendiente de Precio
Cesar Juan Flores Navarro
Indicador en base a la pendiente de la linea de precio, dibuja una línea de color cuando sube a base de los precios que previamente has sido procesados o linealizados, y cuando baja la pendiente la linea linealizada toma otro color. En este caso se a considerado 6 lineas de diferentes procesos desde pendientes largas hacia las cortas, observándose que cuando coincidan las pendientes se produce un máximo o mínimo, lo que a simple vista nos permitirá hacer una COMPRA O VENTA.
Индикатор Coefficient Of Determination (COD) представляет собой значение коэффициента детерминации или квадрат коэффициента корреляции между зависимой переменной — ценой и объясняющей переменной — тиковым объемом. Что это дает нам на практике? COD отлично распознает кульминацию трендовых движений, что позволяет подбирать оптимальные точки и ловить развороты рынка. Как использовать индикатор: Наиболее популярная торговая стратегия строится совместно с трендовым индикатором Moving Average (MA), пе
Fibonacci Multiple 12
Cesar Juan Flores Navarro
Fibonacci Múltiple 12, utiliza la serie fibonacci plasmado en el indicador fibonacci, aumentadolo 12 veces según su secuencia. El indicador fibonacci normalmente muestra una vez, el presente indicador se mostrara 12 veces empezando el numero que le indique siguiendo la secuencia. Se puede utilizar para ver la tendencia en periodos cortos y largos, de minutos a meses, solo aumentado el numero MULTIPLICA.
Recommended TimeFrame >= H1. 100% Non Repainted at any moment.  Use it carefully, only with Trend Direction. Trading Usage: 2 Variants: as Range System or as BreakOut System (Both Only With Trend Direction)::: (Always use StopLoss for minimise Risk); [1] as Range System: (Recommended) in UP TREND:  - BUY in Blue Line , then if price goes down by 50 points (on H1) open Second BUY.   Close in any Profit you wish: TrailingStop(45 points) or Close when Price touches upper Gold Line. in DOWN TREND
Linea Horizontal Inteligente
Cesar Juan Flores Navarro
En base a cálculos matemáticos de determino una linea Horizontal que cruza a todas las señales de trading, mostrando los máximos y mínimos. La linea horizontal parte en dos las subidas y bajadas de las señales de trading, de tan manera que es fácil identificar los máximos y mínimos, y es inteligente por que es sensible a las subidas y bajadas, afín de no quedarse en un solo lado por siempre, trabaja excelentemente con otros indicadores suavizadores ya que les garantiza que en un intervalo de tie
Spike Detector
Tete Adate Adjete
this indicator is a Spike detector indicator, it is specially designed to trade Boom 1000, Boom 500, Crash 1000 and Crash 500 We recommend using it on Deriv Boom and Crash indices only Its setting is intuitive, familiar, easy to use it has notification functions; audible notifications and push notifications. this tool is simple to use, easy to handle This update is based on different strategies for spikes
AutoSignals Trend Panel
Danilo Maia Siqueira
The indicator tracks the trend in 5 different chart times for the same asset, based on 6 signals for each chart time. The main objective of the indicator is to show us the majority trend of the financial asset in which it was placed. The system transmits the information of the trends in several graphical times, in this way the user is able to have a wide view of the movement of the asset, this type of tool makes the user have a higher hit rate by helping the operator to execute orders in favo
Limitless MT5
Dmitriy Kashevich
Limitless MT5 is a universal indicator suitable for every beginner and experienced trader. works on all currency pairs, cryptocurrencies, raw stocks Limitless MT5 - already configured and does not require additional configuration And now the main thing Why Limitless MT5? 1 complete lack of redrawing 2 two years of testing by the best specialists in trading 3 the accuracy of correct signals exceeds 80% 4 performed well in trading during news releases Trading rules 1 buy signal - the ap
Panel Visao axetrend
Danilo Maia Siqueira
trend view panel; AutoSignals Trend The indicator tracks the trend in 5 different chart times for the same asset, based on 6 signals for each chart time. The main objective of the indicator is to show us the majority trend of the financial asset in which it was placed. The system transmits the information of the trends in different graphic times, in this way the user is able to have a wide view of the movement of the asset, this type of tool makes the user have a higher hit rate by helping
Escalera Inteligente
Cesar Juan Flores Navarro
Indicador en MQL5, recibe la información del precio SUAVIZADO, lo procesa anulando los picos inteligentemente, y el resultado lo envía al desarrollo de la escalera que iniciara y subirá o bajara según el peldaño o INTERVALO ingresado Ingreso PERIODO = 50 (variar segun uso) Ingreso MULTIPLICA AL PERIODO = 1 (variar segun uso) Segun la configuración la escalera puede pegarse o separarse de los precios,, Se aplica toda la linea de tiempo, y a todas las divisas, etc.  
Fibonacci Suavizado
Cesar Juan Flores Navarro
Indicador en MQL5, que obtiene el promedio de 10 EMAS, que son alineadas según Fibonacci, obteniendo un promedio, que sera suavizado.  Se puede ingresar un numero desde 2 a N, que multiplica a los EMA-Fibonacci. Funciona en cualquier criptomoneda, etc. etc... pudiendo calcular el futuro segun la tendencia de las EMAS. Funciona excelentemente en tramos largos, determinando exactamente el mejor inicio/salida. El precio inicial por apertura sera por un periodo de tiempo, luego aumentará.
QuantXSTocks Trading Range Indicator for MT5: INSTRUCTIONS TO USE OUR INDICATOR:- User needs to take trade on Arrow or after an Arrow CandleStick, You can achieve up-to 35-125 pips target by this Indicator. Best Timeframes for Stocks and Indices are M30 and H1: AMAZON M30 (50 pips) TESLA M30 (50 pips) APPLE M30 (50 pips) ADOBE M30 (50 pips) NASDAQ100 H1 (125 pips) The above are the approximate amount of pips you can achieve by this Indicator, Green arrow appears to be buy arrow while the Red ar
Super Suavizador
Cesar Juan Flores Navarro
Indicador en MQL5 que obtiene el promedio de 10 EMAS que son alineadas y procesadas según Fibonacci luego el promedio es suavizado"  Se ingresa un número de 2 a N que multiplica los EMA-Fibonacci y por consiguiente aumenta los fibonacci, resultando un promedio.   Se ingresa un número que suaviza los EMA-Fibonacci. Considerando los números 1/1 seria la suavización minima. Considerando los números 3/5 seria la suavización media. Considerando los números 10/30 seria la suavización alta.....etc
Trend and Signals MT5  indicator scans  30 trading Instruments (Forex, Metals and Indices).     It uses special algorithm on the  current market   based on   Pure Price Action   and display the overall trend and signal on the dashboard. When signals are produced the indicator sends alert and notification. Strategy for Signals This indicator uses the daily timeframe to determine the direction of the trend. The hourly timeframe is used to identify possible entries. Main trend and is determined by
Cycles Forecast
Pooriya Alirezaee
This indicator is based on a mathematical formula and an ANN combined, designed to make a model(using previous prices) of the most recent market condition (any chart*) in order to use the model as a forecasting tool. *This indicator can operate on any chart/timeframe, but it's suggested you use multiple timeframes for each trade because this method relies solely on the time factor, you can not use this indicator to predict price volatility, but if it's fit correctly it will show you when the nex
BC Scalper Aroow
Tete Adate Adjete
This indicator is based on the crossing of two Moving Average with the RSI It is intended for scalpers Specially designed for Boom and Crash syhtetic indices from Binary.com/Deriv.com It is easy to use and intuitive. We recommend its use on M1 and is equipped with three types of notification Email alert Sound notification Push notification these parameters can be activated and deactivated.
이 인디케이터는 "회귀 채널 도구" 개념을 기반으로 한 강력한 시장 분석 방법을 제공합니다. 이 도구를 활용하여 트레이더는 차트의 회귀 채널을 탁월하게 제어하고 보다 근거 있는 거래 결정을 할 수 있습니다. 회귀 채널 도구는 트레이더 도구 상자 내에서 강력한 도구입니다. 가격 트렌드와 잠재적인 지지 및 저항 수준에 대한 유용한 통찰력을 제공하는 것을 목표로합니다. 이 도구는 특히 트렌드 내의 수정 웨이브를 시각화하는 데 효과적이며 가격 역학의 포괄적인 전망을 제공합니다. 이제 이 인디케이터의 주요 기능과 이점에 대해 더 자세히 살펴보겠습니다: 채널 수준 및 지지/저항:   이 인디케이터의 주요 장점 중 하나는 동적인 지지 및 저항 영역으로 작동하는 채널 수준을 생성할 수 있는 능력입니다. 이러한 수준은 잠재적인 진입 및 이탈 포인트를 식별하는 데 중요하며 거래 전략의 정밀도를 향상시킵니다. 수정 웨이브 수준:   수정 웨이브 수준을 활성화하여 트레이더는 큰 트렌드 내에서 잠재적인
Use with JUMP 25. However it can can with the volatility indices as well because it is a modified version. It is advisable to use create a healthy account management. Measure your risk and happy trading. Other experts to be loaded soon. These are modified in order to optimise profits. Ideal candidates are high risk, high returns individuals who hold trades at a maximum of 1 - 2 hours
This indicator is a scalping indicator intended solely for the Boom and Crash indices of the Deriv Limited market It supports Boom 500, Boom 1000, Crash 500 and Crash 1000 Not repaint and no bug The settings are intuitive and easy to use The product activation number is 20 The Time Frame used depends on the user If you are an aggressive scalper then just use M1 For long trades use M15 If you are conservative use M5 Please contact me for more details of its use
제작자의 제품 더 보기
Reverse side scalper is the manual trading system, that works on choppy(anti-trend) market. As a rule markets are on 80% choppy and only 20% is trend phase. System is based on custom step Moving and RSI and reverse pattern. System defines up movement, down movement, trend / choppy phases. Indicator plots Buy signal arrow when current direction is down and phase is trend, Sell signal arrow is plotted when currently is up movement and phase is trend. As a rule it allows to "catch" local maximum/mi
Pips Hunter Robot
Ekaterina Saltykova
This EA is based on Grid Martingail method, and it has made a huge evolution with this method of trading.   It does not use directly the "classic" Grid Martingail method. EA waits exact points to add new orders in case of initial order goes loss direction. It has smart method to define follow up position points, that allows EA to stand up HUGE one side market's price direction. During high - impact News, highg-volatility time most of Grid systems, if it was not turned off, successfully blows tr
Golden section price action indicator - is a trend-scalping complete system with enter and exit points. Indicator is based on most powerfull price action japan patterns that are filtered by volume, volatility, market phase. Pattern is not a simple combinations of candles. Patterns must have "weight" to move market in right direction. "Weight" - is the summary of pattern's volume, the size of pattern candles according to last average volatility and ofcourse pattern must appear in correct market p
Balance Weighted Moving Hedge System- is the trend following manual system for forex/crypto market. Indicator represents custom balance-weighted moving average indicator. The main advantagies : very stable moving with really early signals, defines current trend power, ignores market noise. The more width of indicator line - the more expressive trend is. On the other hand thin moving line shows unstable / choppy market. Indicator can be used as single b alance weighted moving or with hedge strate
SupportResistancePeaks Indicator indicator - is the combination of dynamic support/resitance and price action pattern. As a rule support/resistance indicators uses already calculated, history levels. The most disadvantage of this method - new(incomming) levels always are not the same as were on history, in other words accuracy is not so high as expected. My indicator is looking for dynamic/live levels that are forming right now after trend lost it's power and choppy market starts. As a rule exac
Trend deviation scalper - is the manual system to scalp choppy market places. Indicator defines bull/bear trend and it's force. Inside exact trend system also defines "weak" places, when trend is ready to reverse. So as a rule, system plots a sell arrow when bull trend becomes weak and possibly reverses to bear trend. For buy arrow is opposite : arrow is plotted on bear weak trend. Such arrangement allows you to get a favorable price and stand up market noise. Loss arrows are closing by common p
Trend driver bars is the manual trading system, which defines current trend continue or it's pull-back/reverse. "Driver" bars - are price action patterns that has powerfull affect on market, defining it's near future direction. Generally, driver bars represents trend "skeleton" and often anticipates new market impulse. System plots arrows when market shows 3 pattenrs in a row(most powerfull combo-pattern), and makes fast scalping of incomming movement. Loss positions closes by common profit. Lot
Wave Impulse OmegaScalper - is the manual system for scalping. In many cases Indicator "eats" almost all possible trend wave. System defines up price wave and down price wave. Inside the exact wave - system defines true trend movement and choppy market. Indicator plots signals while market is trending, powerfull and has quiet good volatility. This is complete system with enter and exit points. Main Indicator's Features Signals are not repaint,non-late or disappear(exept cases when system recalcu
Binary step clouds - is the complete trading system with enter and exit points. System is based on double smoothed exponential step moving and volume weighted simple step moving.Generally each movings define trend direction and places when trend is in active phase. Signals plots when both movings approache to active trend phase and market speed is high.  Main Indicator's Features Signals are not repaint,non-late or disappear(exept cases when system recalculates all history datas,refreshing main
Acceleration Force Meter Indicator - is a trend system that join market in trend phase and after trend pull-back. AFM indicator - is the system that watchs market phases from flat to extreme volatility and prefers to enter in market when it's active, more volatility, ignoring most flat places. This is 100% complete trading system including enter and exit points. It works well with profitable trades - maximizing take profit targets(analysis of recent market volatility, its pips range to adapt cur
Market Chopper Indicator - is the manual system for market scalping. Indicator uses most accurate points to enter, when current trend has lost it's power and new one starts. Indicator shows : Enter points(buy/sell arrows), Exit points(Stoploss/Takeprofit arrows). Indicator makes market analysis and adapts to any market, any timeframe showing most relevant strategy for exact conditions. Main Indicator's Features Signals are NOT repaint, late or disappear; Every signal comes at the open of new bar
ImbaTrend Runner - is the trend following manual system for forex/crypto market. It defines medium-term trends and works with it in intraday mode. System shows enter points, profit and loss targets. As a rule profit targets are 2-3 X bigger than loss targets. Indicator is AutoAdaptive and it automatically updates it's settings during trading. Indicator is sensitive to market changes, regular updates helps to stay in relevant trend. Main Indicator's Features Signals are not repaint, late or disap
Early WPR divergence - is the manual system to define trend reverse. Green histogram shows main trend, Orange one - shows "short"/local trend. System is looking for clear divergence between both trends and pick up position(plot buy/sell arrows). When main trend is up, but local trend reverses to bearish trend and get's big power - sell arrow is plotted;    When main trend is down, but local trend reverses to bullish trend and get's big power - buy arrow is plotted;  Main inputs are : mediumTrend
Trend Gain Oscillator - is the manual system for defining trend phase(bullish/bearish). When histogramm is pink - market is up/bullish and when histogramm is blue - market is down/bearish. Arrows is plotted on zero cross, in case if additionally market has power for future movement. Main inputs are : trendPeriod- main indicator's period for trend calculation; trendPowerPeriod - period for market's power(volatility+volume) calculation ; trendPowerTrigger - arrows is not plotted if market's power
Bull bear pressure indicator - is the manual system which defines bull/bear market. When lines is above zero level - market is strong bullish, and when lines below zero level - market is bearish. First line represents global trend and second one are smoothed and shows local market's mood. Main inputs are : MainPeriod- main indicator's period for global trend calculation; SignalPeriod - period for   smoothed and shows local market's trend; Main Indicator's Features Signals are not repaint,non-la
ROC acceleration-deceleration is the manual system for medium-term scalping. Indicator based on custom ROC system which defines bullish/bearish market and especially  acceleration-deceleration of tendention in the market's main direction. Buy arrow is plotted during bearish market when current trend decelerates and sell  arrow is plotted during bullish market when current trend decelerates. Main Indicator's Features Signals are not repaint,non-late or disappear(exept cases when system recalculat
ASI fractals with DPO filter - is the manual trend-following system. ASI fractals are the base of every trend. System plots an arrow when fractal pattern appears on ASI indcator and DPO direction is same as incomming signal. System has several ways of usage : simply indicator, indicator with suggested arrows, arrows with single targets and arrows with common profit targets. User can simply switch indicator's modes directly from chart. Main Indicator's Features Signals are not repaint,non-late or
Trend reversal index - is the manual trading system that works with overbought , oversold levels and reversal patterns. Sell arrow is plotted when indicator is higher than overbought level and here forms reversal pattern, all pattern points  located higher than overbought level. Opposite with buy arrow : ndicator is lower than oversold level and here forms reversal pattern, all pattern points located lower than overbought level.  Main Indicator's Features Signals are not repaint, late or disapp
Dema divergence points - is the manual trading system based on double exponental moving divergence. Histogram represents 4 colors : yellow - strong up trend, orange - up movement, blue - down movement and aqua - strong down trend.  Up arrow is poltted when dema crosses current price up - but phase is still strong down (aqua color), down arrow is poltted when dema crosses current price down - but phase is still strong up (yellow color). Main inputs :  mainPeriod - main dema calculation period; f
Demarker pullback system - is the manual trading system for choppy markets. It show 2 colored histogram.  When histogram is blue - market is quite bullish, when histogram ir orange - market is more bearish. Up arrow is plotted when histogram is in oversold zone but blue color. Down arrow is plotted when histogram is in overbought zone but orange color. These patterns shows false breakout and possible soon reverse(price is overbought but shows bearish signs and price is oversold but shows bullis
TPM cross indicator MT4
Ekaterina Saltykova
TPM Cross (trend power moving cross) - is a trend following strategy based on custom signal points. Indicator consists from main custom moving chart line and trend power line. Indicator defines up and down movements by it's trend power and custom moving direction. When current market's trend looses it's power and opposite trend starts - power trend line  crosses moving and indicator plots an arrow.  Main indicator's adjustable inputs : movingPeriod - period of moving line  trendPeriod  - period
Impulse fractals indicator - is counter-trend oriented complex market fractal pattern.  Market creates bull/bear impulse, trend starts, fractals on impulsed wave are an agressive pullback signals. Buy arrow is plotted when market is bearish and it's impulse showed up-side fractal, and sell arrow is plotted when market is bullish and it's impulse showed dn-side fractal. Main indicator's adjustable inputs : impulsePeriod - main period of impulse histogram  filterPeriod  - smoothes impulse accordi
Triple trend index MT4
Ekaterina Saltykova
Triple trend index is the manual trading system/indicator. It looks for trend reversal points according to main trend index datas. Indicator represents  4 lines. 3 lines shows trend power by main market's parametres. 4th line (OrangeRed) is the main index. When line is above zero level - market is bullish, value below zero show bearish pressure. Indicator "looks" for weak places(reversal points) on bullish market to plot a sell arrow and weak places(reversal points) on bearish market to plot a
Floating peaks oscillator - it the manual trading system. It's based on Stochastik/RSI type of oscillator with dynamic/floating  overbought and oversold levels. When main line is green - market is under bullish pressure, when main line is red - market is under bearish pressure. Buy arrow appears at the floating bottom and sell arrow appears at floating top. Indicator allows to reverse signal types. Main indicator's adjustable inputs : mainTrendPeriod; signalTrendPeriod; smoothedTrendPeriod; tre
Trend speed vector - is the oscillator for manual trading. System measures trend direction and it's speed. Histogram shows 4 colors: Lime --> Strong up movement with good gain speed; Green --> Up movement with low gain speed Red --> Strong down movement with good gain speed; Orange --> Down movement with low gain speed Green and Orange histograms show weak market's movements and thуese places excluded from signal points. Buy arrow is plotted during strong down movement when bearish gain speed i
Floating gain meter MT4
Ekaterina Saltykova
Floating gain meter is the manual trading system that works with local trends and it's scalping. Histogram represents  bull/bear floating trend gain. Green color histogram shows choppy market with bullish pressure, Orange - shows choppy market with bearish pressure. Lime and Red colors shows "boiled" places in market. As a rule buy arrow is placed after strong Down movement when it's power becomes weak and choppy market starts. And sell arrow is plotted after strong Up movement when it's power
Pullback points indicator - is the manual trading system, that shows most popular market prices. Indicator measures bull/bear waves pressure and looks for "consensus" prices. As a rule these points are crossed up and down very often and opened trade has several chances to be closed in positive zone. Mainly, such points is the good base for "common profit" types of strategies. Indicator also represents   "common profit"  scalping method of trading as default one.  Main Indicator's Features Signa
Noize Absorption Index MT4
Ekaterina Saltykova
5 (1)
Noize Absorption Index - is the manual trading system that measures the difference of pressure between bears forces and bulls forces. Green line - is a noize free index that showing curent situation. Zero value of index shows totally choppy/flat market.Values above zero level shows how powerfull bullish wave is and values below zero measures bearish forces.Up arrow appears on bearish market when it's ready to reverse, dn arrow appears on weak bullish market, as a result of reverse expectation. S
Looking for EA to automate your trading strategy on the Forex market? TrendRocWaves Robot — your faithful companion in the world of trading! This 100% automated EA offers unique features: - works exclusively on high timeframes (H1 and H4) for confirmed response to market changes. - uses the most popular and liquid currency pairs such as EURUSD,GBPUSD with minimal spreads and fast transaction execution. - applies a scalping method based on a medium-term trend to achieve local goals and reduce r
Introducing the trading system Dynamic Trend Cycles Robot  — a powerful tool for H1-H4 trading with volatility pairs! Technical capabilities - pairs to trade : EURUSD,GBPUSD,XAUUSD;  - timeframes : M30,H1,H4; Why Choose Dynamic Trend Cycles Robot (DTC)? - Accurate Trend Analysis: DTC adapts to current market volatility, providing precise tracking of price trends. This allows you to confidently open positions in line with the main trend and maximize your profits. - Filtering False Signals: In t
필터:
리뷰 없음
리뷰 답변