Scan pattern
- 지표
- VLADISLAV AKINDINOV
- 버전: 1.10
- 업데이트됨: 20 2월 2025
- 활성화: 5
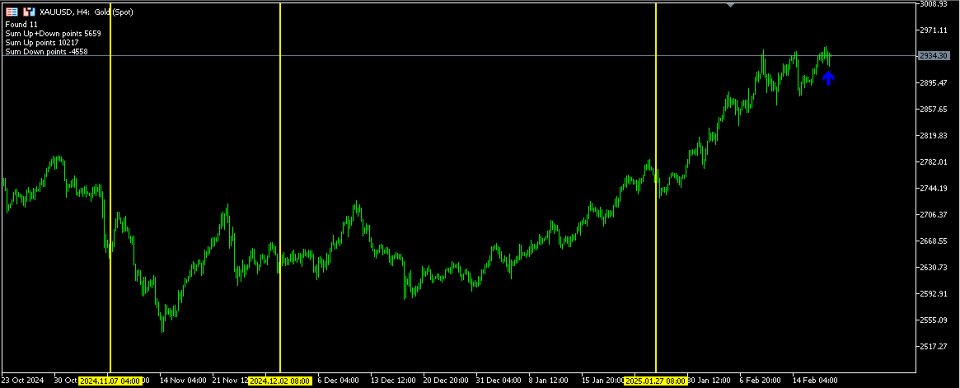
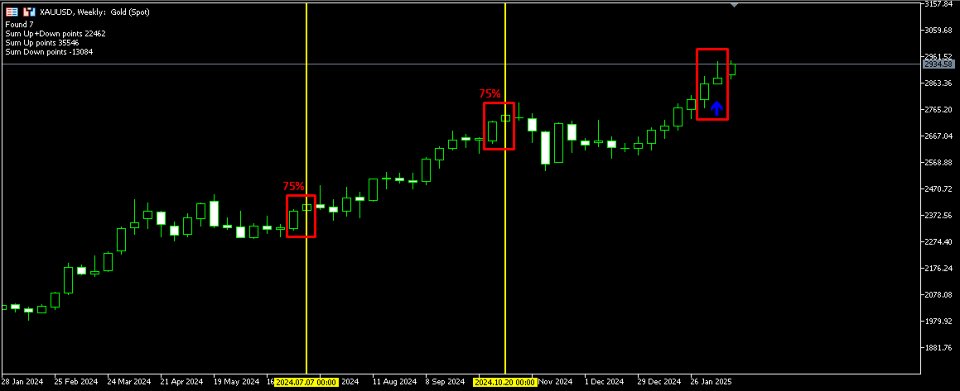
The indicator is designed to help in making a decision on the direction of trading (buy or sell). It is a history scanner that searches for matches of the current pattern (combination of several current bars) with historical data in percentage terms by the relative vertical position of candles relative to each other, the size of each candle, the size of the candle body and the candle shadows. In history, the matches found are indicated by vertical lines on the candle of the beginning of the sought pattern. After each pattern found in history, the points passed by the price of a given number of bars after it are counted, all the points are summed up in each direction and the difference between the points passed by the price in buy and sell is found. When a given number of the sought pattern is found in history and a given threshold of difference in points in buy and sell is passed, an arrow of the prevailing direction by points is drawn and a signal is issued.

