Dynamic RS Indicator
- 지표
- Irvan Trias Putra
- 버전: 1.0
- 활성화: 15
This indicator automatically identifies and plots key support/resistance (S/R) levels on price charts using a hybrid algorithm combining fractal detection, price touch validation, and dynamic level managemen.
Key Features
-
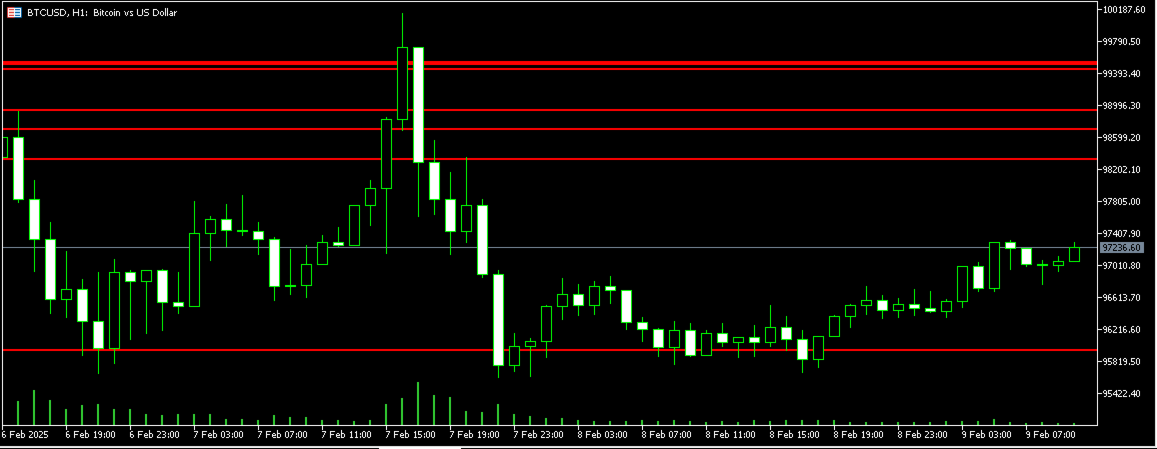
Support and Resistance Levels:
-
Support levels and Resistance levels are drawn in red.
-
-
Fractal-Based Detection:
-
Levels are identified based on fractal highs and lows.
-
-
Efficient Memory Handling:
-
The number of levels is limited to 100 to avoid clutter.
-
-
Cleanup on Deletion:
-
All levels are removed when the indicator is deleted from the chart.
-
How It Works
-
Fractal Detection:
-
Fractal highs and lows are identified based on the FractalPeriod .
-
-
Level Validation:
-
A level is confirmed if the price touches it at least MinimumTouch times.
-
-
Distance Filtering:
-
Levels must be at least MinDistance pips apart.
-
-
Cleanup:
-
All levels are removed when the indicator is deleted from the chart.
-
Input Parameters
| Parameter | Default Value | Description |
|---|---|---|
| FractalPeriod | 2 | Number of bars to identify fractal highs/lows. |
| MinimumTouch | 2 | Minimum touches to confirm a level. |
| MinDistance | 0.001 | Minimum distance between levels (in pips). |
| BarsToCheck | 100 | Number of historical bars to analyze. |
Advantages Over Existing Indicators
-
Precision:
-
Levels are drawn only near the current price, avoiding irrelevant zones.
-
-
Flexibility:
-
Users can adjust MinDistance and MinimumTouch to suit their trading style.
-
-
Efficiency:
-
The indicator is optimized for real-time performance.
-
-
Clean Chart:
-
Only valid and active levels are displayed, reducing clutter.
-