TW Support Resistance Level MT5
- 지표
- Altan Karakaya
- 버전: 3.0
- 업데이트됨: 2 2월 2025
- 활성화: 15
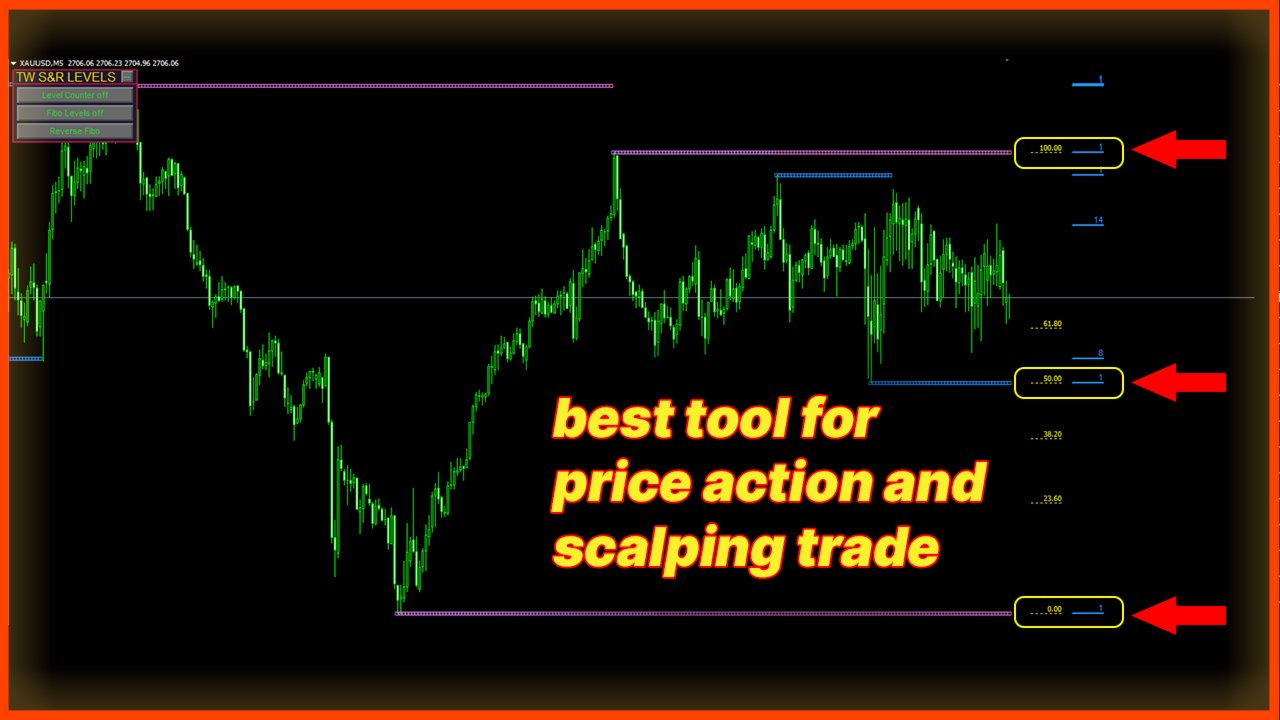
support resistance levels indicator mt5:
이 도구는 차트에서 지원 및 저항선과 피보나치 수준을 식별하고 플롯하는 다중 시간대 지표로, 인간의 눈과 동일한 정확도로 작동합니다. TW 외환 지원 및 저항 수준은 복잡한 알고리즘을 갖추고 있어 차트를 스캔하여 이전 가격 안정화 및 반등 수준을 식별하고 터치 횟수를 기록합니다.
수동으로 지원 및 저항 수준과 피보나치 되돌림을 그리는 데 지치셨습니까?
이 제품의 기능을 확인해 보세요. 놀라울 것입니다.
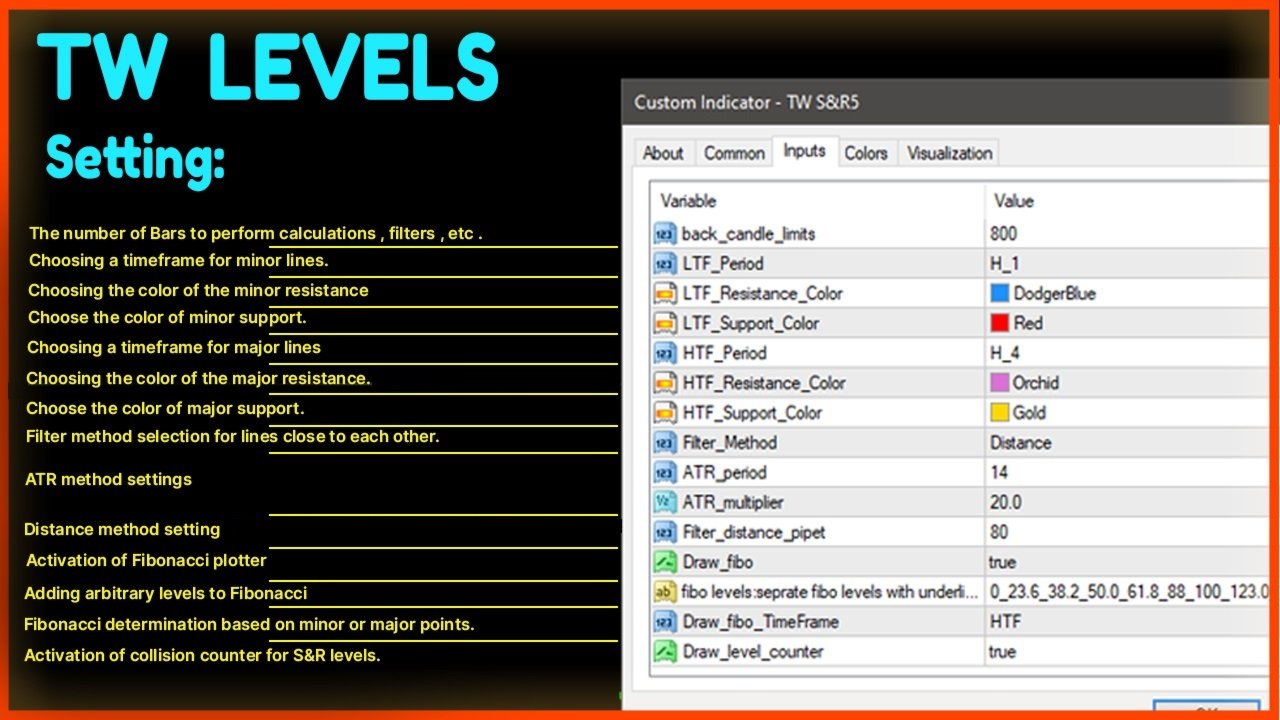
제품 특징:
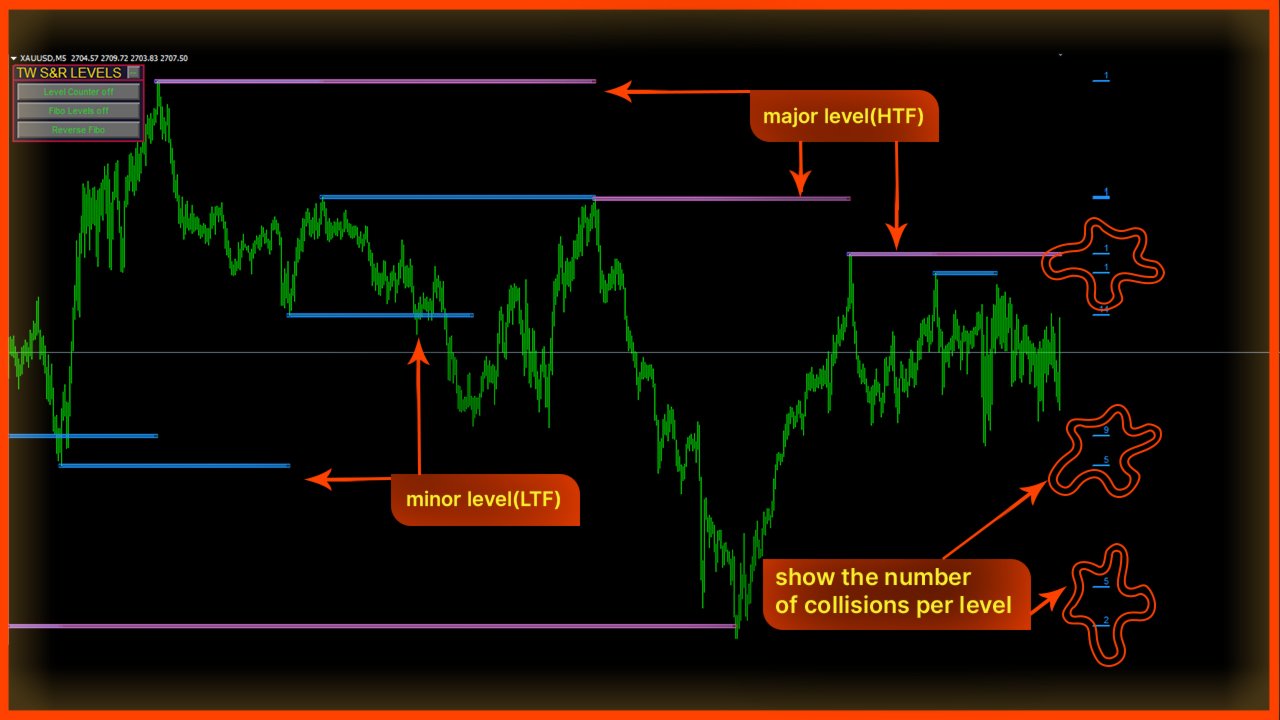
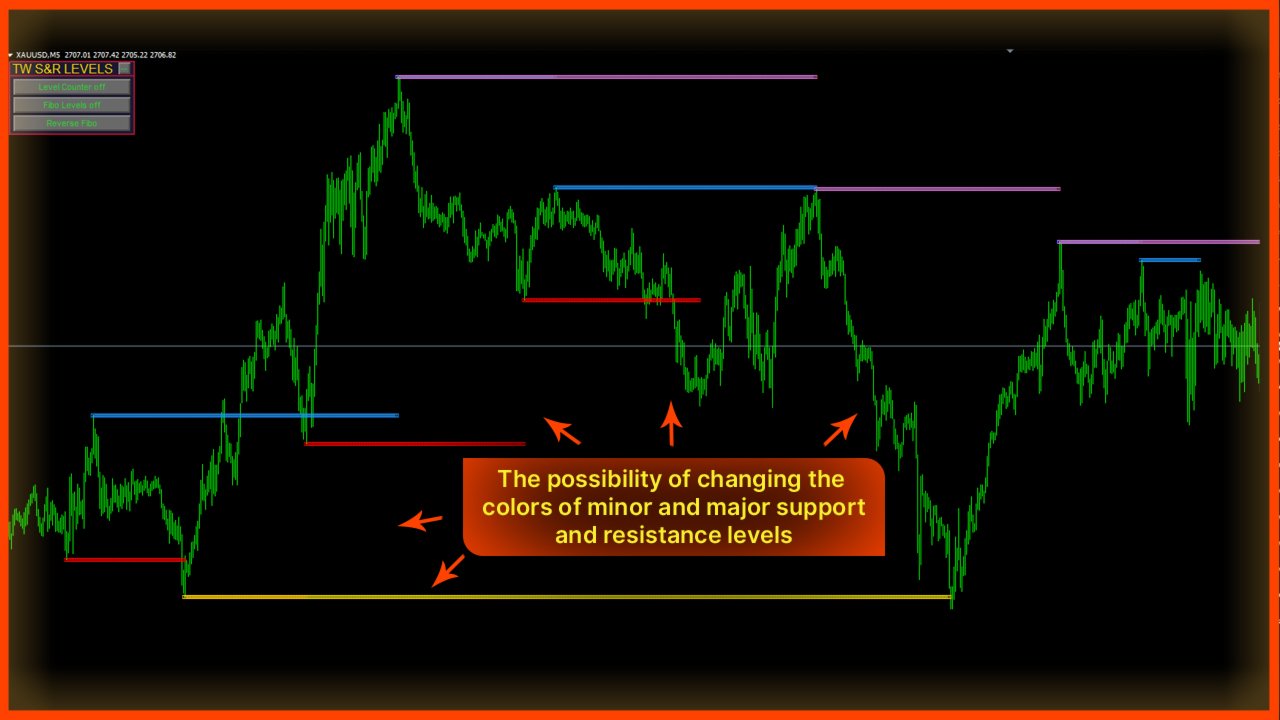
1. 소규모 및 대규모 수준: 고급 알고리즘을 사용하여 소규모 및 대규모 수준을 사용자 취향에 맞게 사용자 정의하고 추가 수준을 제거할 수 있습니다.
2. 수준 터치 횟수: TW 지원 저항 수준과 브레이크 mt5, 각 수준이 과거에 몇 번 터치되었는지 계산하여 제공하여 각 수준의 강도를 평가할 수 있습니다.
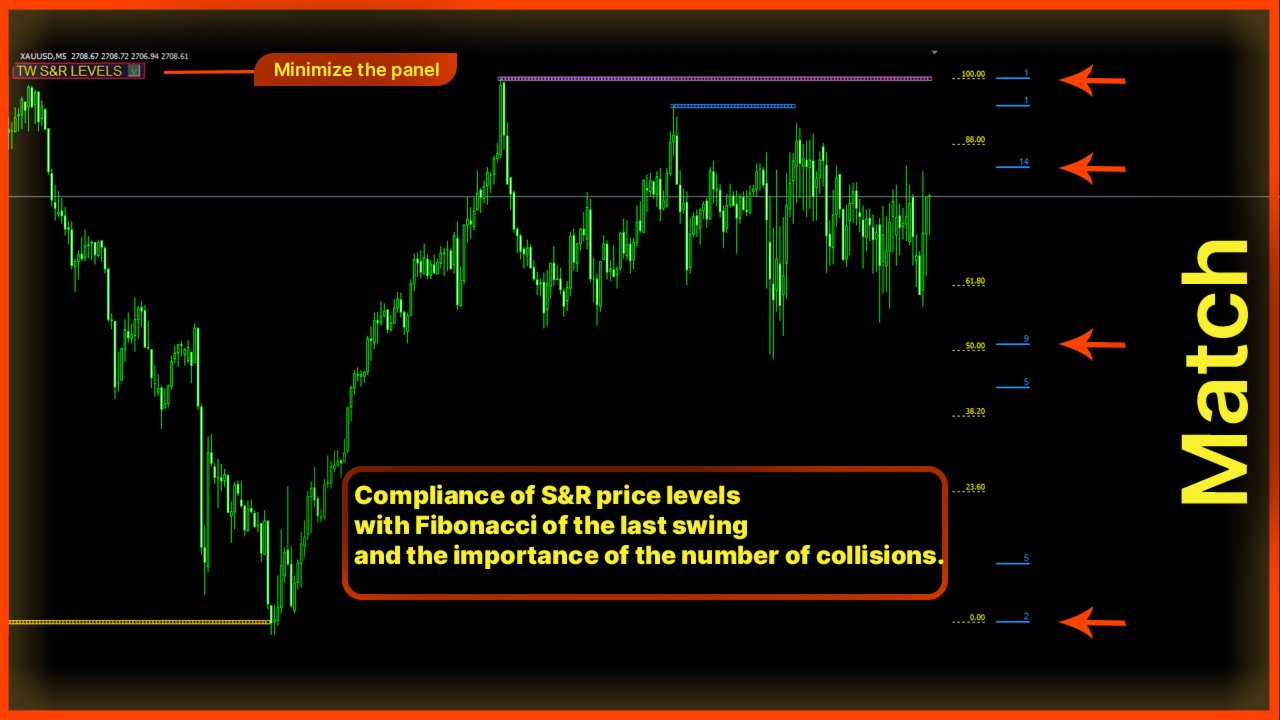
3. 피보나치 수준: 마지막 파도의 피보나치 수준이 동적으로 그려져, 이러한 수준이 정적 지원 및 저항 수준 계산기에서 얻은 값과 정렬되는지 확인할 수 있습니다.
4. 개발자를 위한 버퍼: 이 제품에는 거래 전략 개발에 필요한 버퍼가 포함되어 있습니다.
5. 모든 통화 및 시간대에서 사용 가능: TW 지원 및 저항 수준을 금, 유로, 파운드, 달러 등에서 사용할 수 있습니다.
6. 간단하고 사용자 정의 가능한 사용자 인터페이스: 이 제품의 사용자 인터페이스는 매우 간단하고 사용자 정의 가능하여 색상과 항목을 개인화하거나 비활성화할 수 있습니다.
이 제품을 사용하면:
• 분석 시간을 줄일 수 있습니다.
• 분석의 정확성을 높일 수 있습니다.
• 거래 전략을 개선할 수 있습니다.
• 더 나은 거래 결정을 내릴 수 있습니다.
이 제품을 테스트하려면 테스트기에서 틱 모델링을 "모든 틱" 모드로 설정하세요.
이 제품의 기능과 응용 프로그램에 대해 더 깊이 이해하려면 기사를 읽고 무료로 사용해 보세요.