• 미리보기
  • 리뷰 (1)
  • 코멘트 (2)
  • 새 소식

Triple Moving Average

5
Trading setup could be a simple thing.
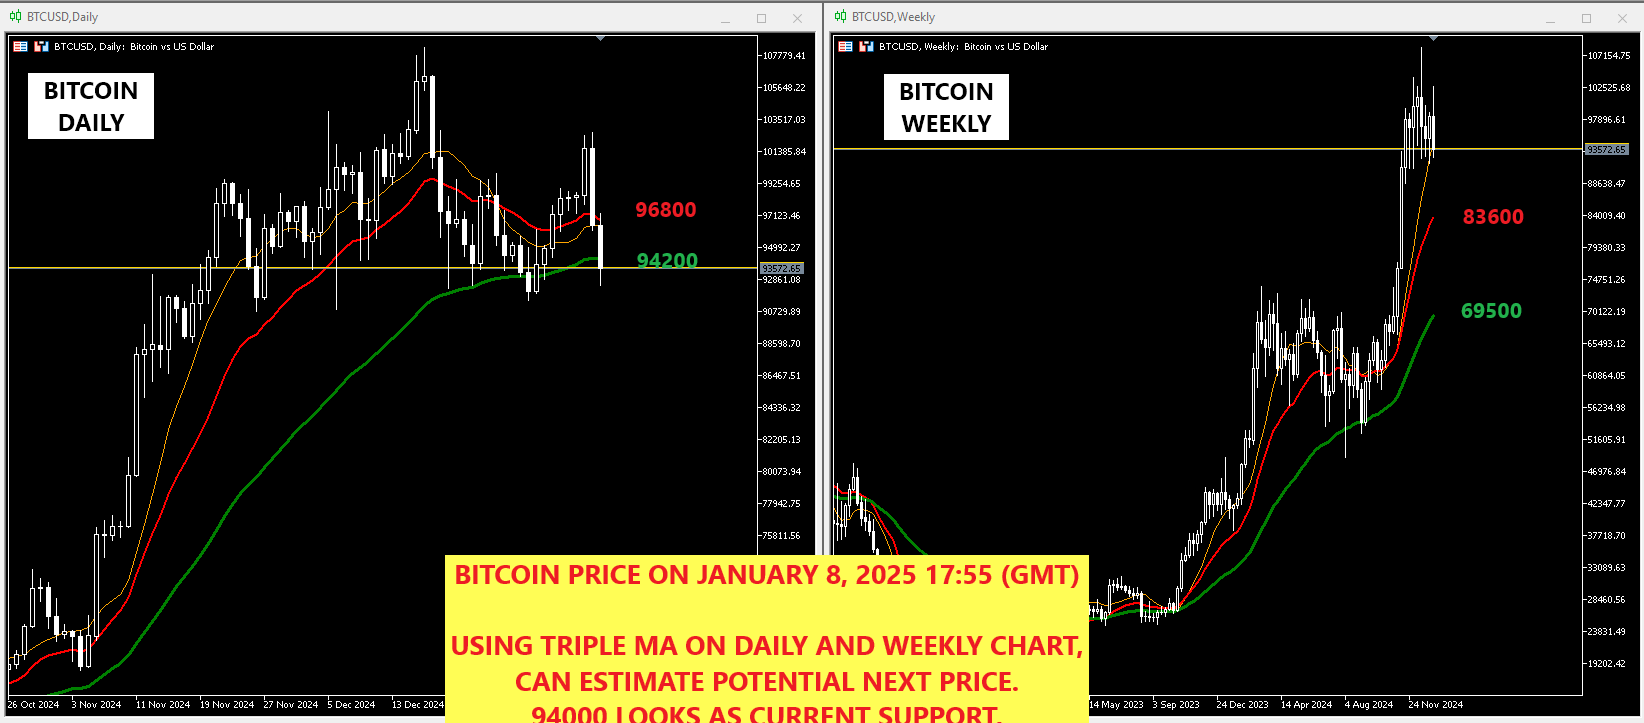
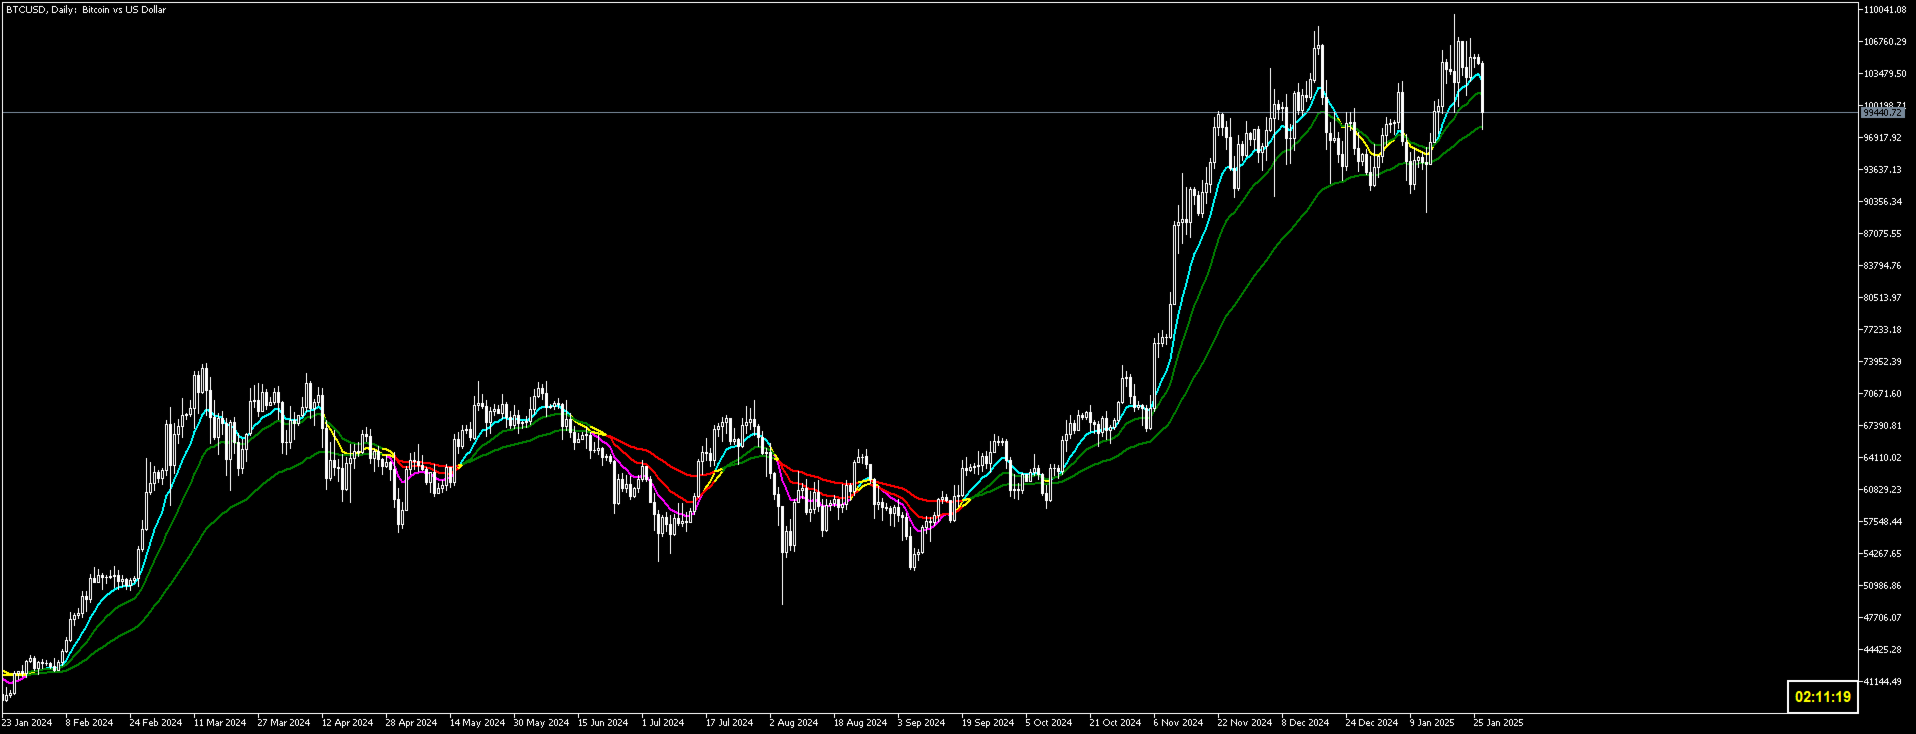
  • Triple Moving Average is a popular trading strategy to analyze market trends.
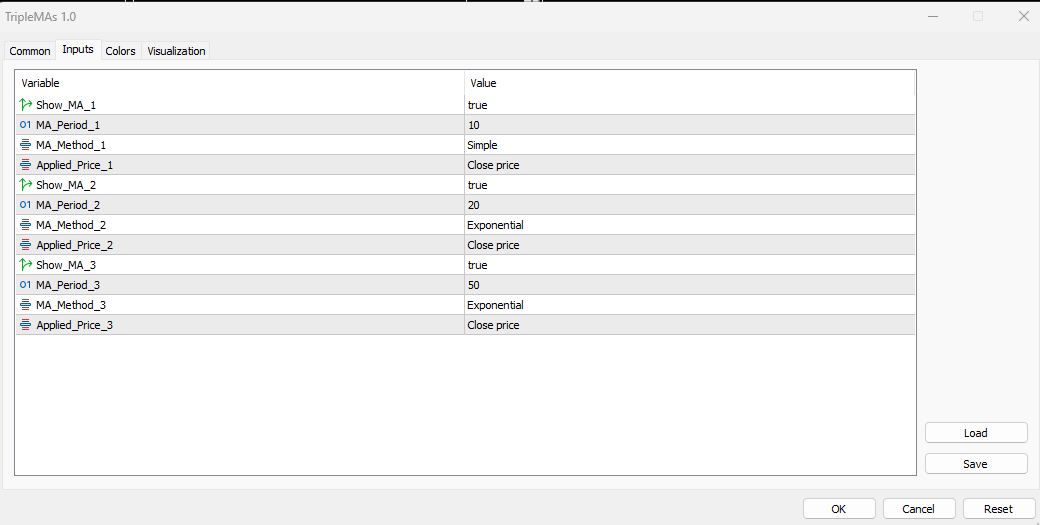
  • It provides clear signals for identifying uptrends and downtrends based on the relative positioning and crossovers of short-term, medium-term, and long-term.
  • Comparing Triple MA of two different time frame, provide a comprehensive look of price movement.


리뷰 1
dafi7
392
dafi7 2025.01.28 18:30 
 

Highly recommended indicator Thank you

추천 제품
Market tops are characterized by Volume Climax Up bars, High Volume Churn and Low Volume Up bars (also called Testing). Market bottoms are characterized by Volume Climax Down bars, High Volume Churn and Low Volume Down bars (Testing). Pullbacks, in either up or down trends, are similar to market topping or bottoming patterns, but shorter in duration and with simpler volume patterns.
FREE
Custom Spread Indicator MT5
Ritter Jozsef
4.84 (25)
Custom Spread Indicator *Please write a review, thanks! Also MT4 version is available Spread Indicator show the current spread in pips with color codes. Handle 3 levels, Low, Medium, High. You can set levels and colors for each level (eg. Low: Green, Medium: Orange, High: Red), and can choose display position on the chart. There is two spread calculation mode:  -> Server spread value   -> Ask - Bid value Can set opacity, for better customization. When spread jump bigger, then display do not
FREE
Nyse Usdxy
Mitchell Dean Ede
5 (1)
Displays a USD DXY chart in a seperate window below the main chart. YOUR BROKER MUST HAVE THESE SYMBOLS FOR THE INDICATOR TO WORK Based on EUR/USD, USD/JPY, GBP/USD, USD/CAD, USD/CHF and USD/SEK All these pairs must be added to Market Watch for the indicator to work correctly As this is calculated using a formula based on the 6 pairs it will only work when the market is open. YOUR BROKER MUST HAVE THESE SYMBOLS FOR THE INDICATOR TO WORK Displays a USD DXY chart in a seperate window below the m
FREE
Haven Volume Profile
Maksim Tarutin
3.5 (2)
Haven Volume Profile은 거래량 분포를 기반으로 중요한 가격 수준을 식별하는 데 도움이 되는 다기능 볼륨 프로파일 분석 지표입니다. 시장을 더 잘 이해하고 중요한 진입 및 퇴장 지점을 식별하려는 전문 트레이더를 위해 설계되었습니다. 기타 제품 ->  여기 주요 기능: Point of Control (POC) 계산 - 최대 거래 활동 수준으로, 가장 유동성이 높은 수준을 식별하는 데 도움이 됩니다 Value Area 정의 (높은 활동 영역) 및 사용자 지정 가능한 거래량 비율로 거래 범위를 보다 정확하게 평가할 수 있습니다 틱 거래량과 실제 거래량 모두 지원, 다양한 시장 유형과 거래 전략에 적합 계산 기간(일 수)의 유연한 설정으로 모든 시간 프레임에 도구를 적용할 수 있습니다 터미널의 밝은 테마와 어두운 테마에 자동 적응하여 사용자 인터페이스의 시각적 경험을 향상시킵니다 레벨 시각화가 명확하고 스타일과 색상을 사용자 지정할 수 있어 빠른 의사 결정을 돕습니다 이 지표
FREE
BoxInside MT5
Evgeny Shevtsov
5 (4)
This indicator calculates the volume profile and places labels that correspond to the VAH, VAL and POC levels, for each candle individually. Indicator operation features The indicator works on the timeframes from M3 to MN, but it uses the history data of smaller periods: M1 - for periods from M3 to H1, M5 - for periods from H2 to H12, M30 - for the D1 period, H4 - for the W1 period, D1 - for the MN period. The color and location of the VAL, VAH and POC labels on the current candle are considere
FREE
Blahtech Moving Average MT5
Blahtech Limited
5 (3)
Blahtech Moving Average indicator is a multitimeframe version of the standard Moving Average indicator. It is also enhanced with customisable alerts, period breaks and other configuration options. The 50 day and 200 day moving averages are widely followed by investors and traders, with breaks above and below the MA lines considered to be signals of interest. Links [  Install  |  Update  |   Training   |   All Products  ] Feature Highlights Up to three timeframes Configurable calculation variabl
FREE
Reclaimed Order Block ICT Indicator MT5 Built upon the ICT trading principles, the Reclaimed Order Block ICT Indicator MT5 for MetaTrader 5 pinpoints essential price areas where an order block is initially breached, leading to a structural shift and the formation of a new trend. As the price revisits these levels post-breakout, the indicator generates strategic buy and sell signals, assisting traders in making data-driven decisions. «Indicator Installation & User Guide» MT5 Indicator Installatio
FREE
AvgVolumes
Marco Montemari
5 (1)
This indicator is based on Volumes standard indicator, calculates the average of Volumes based on the last N bars set by users, and if the value of the volume is bigger then a set % respect the average a different color will be used. The indicator is shown in a separate indicator window. This version has now a limitation in setting the % about the threshold. If you are interested to set threshold consider to buy the PRO version ( https://www.mql5.com/en/market/product/35925 ) If you want to use
FREE
Echelon EA
Daniel Suk
5 (1)
Echelon EA – Chart Your Unique Trading Constellation Like the celestial guides that lead explorers through the vast universe, Echelon EA empowers you to create and optimize your very own trading strategies. This versatile system combines advanced grid and martingale techniques with cutting‐edge indicators, offering you an endless palette for designing a strategy that is truly your own. Craft Your Personal Strategy: Infinite Possibilities – Customize every parameter to build a trading system t
FREE
This indicator uses a different approach from the previous version to get it's trendlines. This method is derived from Orchard Forex, and the process of making the indicator is demonstrated in there video   https://www.youtube.com/watch?v=mEaiurw56wY&t=1425s . The basic idea behind this indicator is it draws a   tangent line   on the highest levels and lowest levels of the bars used for calculation, while ensuring that the lines don't intersect with the bars in review (alittle confusing? I know
FREE
Price Alert Panel MT5
Issam Kassas
5 (5)
Description:  For a comprehensive understanding of our indicators, we invite you to explore the entire Q&A section within this MQL5 blog post   here . The "Moving Average Lines Crossover with Alert" is a valuable technical analysis tool designed to help traders identify potential trend reversals and trading opportunities. Seamlessly integrated into your trading platform, this indicator empowers you with essential data to make well-informed trading decisions. Spot Trend Reversals: Utilize the pow
FREE
Donchian Pro
Paulo Henrique Faquineli Garcia
5 (3)
The Donchian Channel Channels are among the most popular tools of technical analysis, as they visually convey to the analyst the limits within which most price movement tends to occur. Channel users know that valuable information can be obtained at any time, whether prices are in the central region of a band or close to one of the border lines. One of the best known techniques to explore these concepts is Bollinger Bands. However, John Bollinger was not the only one to research the application
FREE
Dual RSI
Paul Conrad Carlson
3 (1)
Indicator alerts for Dual Relative strength index rsi. Large rsi preset at 14 is below 30 small rsi preset at 4 is below 10 for buy bullish signals . Large rsi preset are 14 is above 70 small rsi preset at 4 is above 90 for sell bearish signals . Includes mobile and terminal alerts. draws lines when alerts. This indicator can help identify extremes and then the tops or bottoms of those extremes .
FREE
Supertrend by Mauroserranoq
Andres Mauricio Serrano Quintero
SuperTrend Indicator Code Description This code defines a custom indicator for the MetaTrader 5 platform called SuperTrend. The indicator is based on the Average True Range (ATR) to identify upward and downward trends in the market. Code Sections: Indicator Information: Defines the indicator's name, copyright, link, version, etc. Configures the indicator to be displayed in a separate window and have 9 internal buffers and 2 visible plots. Sets the properties of the plots (name, drawing type, col
FREE
Spread And Candle Timer
Issam Kassas
4.33 (9)
Description:  For a comprehensive understanding of our indicators, we invite you to explore the entire Q&A section within this MQL5 blog post   here . The "Show TP and SL Values" Indicator is a valuable technical analysis tool designed to enhance your trading experience by displaying the  (TP) and  (SL) levels directly on your chart. This simple yet effective tool provides traders with crucial information, allowing for better decision-making and risk management. Key Features: TP and SL Display:
FREE
React Fibonacci Chart
Kim Yonghwa
4.91 (11)
기능 피보나치 리트레이스먼트 트레이딩을 위한 지표 1H, 4H, 1D 및 1W 중에서 선택한 이전 바를 기반으로 피보나치 차트가 그려집니다. 시장 가격이 피보나치 레벨에 닿으면 색상이 변경되고 닿은 시간이 표시됩니다. -23.6, 0, 23.6, 38.2, 50, 61.8, 76.4, 100 및 123.6 레벨에 피보나치 그래프가 그려지며, 바가 업데이트될 때마다 차트가 새로 고침됩니다. 변수 타임프레임: 1H, 4H, 1D 및 1W 중에서 선택한 타임프레임으로 피보나치 차트가 그려집니다. FiboWidth: 레벨의 두께를 결정합니다. FiboStyle: 피봇 레벨의 스타일을 설정합니다. TouchedColor: 닿았을 때 변경되는 색상입니다. 오류가 있거나 개선 사항이 있다면 의견을 남겨주세요. 평가는 개발자에게 큰 도움이 됩니다. 만족하셨다면 5성을 부여해 주시기 바랍니다.
FREE
Ota A2
Sander Maehle Andresen
OTA A2 - 고급 터미널 최적화 도구 중요한 시장 순간에 트레이딩 터미널이 느려지는 이유가 궁금하셨나요? OTA A2는 이러한 일반적인 문제에 대한 해답이며, 트레이딩 터미널 최적화의 혁신적인 진보를 보여줍니다. 왜 OTA A2인가? 오늘날의 시장 거래는 최고의 성능을 요구합니다. 여러 전략을 동시에 실행하거나, 집중적인 백테스트를 수행하거나, 수많은 차트를 관리할 때도 모든 밀리초가 중요합니다. OTA A2는 압박 상황에서도 일관된 성능을 유지할 수 있는 솔루션이 필요한 전문 트레이더들의 실제 요구에서 탄생했습니다. 핵심 기능 동적 메모리 회수 - 거래 요구에 맞춰 조정되는 지능형 리소스 관리 캐시 시스템 최적화 - 데이터 접근 속도를 향상시키는 고급 캐싱 알고리즘 작업 세트 관리 - 최적의 성능 수준을 유지하는 정교한 메모리 할당 터미널 리소스 강화 - 최고 거래 조건을 위한 종합적인 시스템 최적화 기술 혁신 OTA A2는 직접적인 시스템 통합을 통해 최첨단 최적화 기술을
FREE
Trend Catcher with Alert MT5
Issam Kassas
4.71 (85)
트렌드 캐쳐: 알림 인디케이터와 함께 하는 트렌드 캐쳐 전략은 시장 트렌드와 잠재적인 진입 및 체크 포인트를 식별하는 데 도움이 되는 다목적 기술 분석 도구입니다. 이는 시장 상황에 적응하여 트렌드 방향을 명확하게 시각적으로 표현하는 동적 트렌드 캐쳐 전략을 제공합니다. 트레이더는 선호도와 위험 허용도에 맞게 매개변수를 사용자 정의할 수 있습니다. 이 인디케이터는 트렌드 식별을 지원하고 잠재적인 반전을 신호로 제공하며 트레일링 스탑 메커니즘으로 작동하며 실시간 경고를 제공하여 신속한 시장 대응을 돕습니다. 특징: - 트렌드 식별: 상승 트렌드와 하락 트렌드를 신호합니다. - 트렌드 반전: 양봉 색상이 상승에서 하락으로 변경되거나 그 반대의 경우 잠재적인 반전을 경고합니다. - 실시간 경고: 새로운 트렌드 식별을 위한 경고를 생성합니다. 추천사항: - 통화 및 페어: EURUSD, AUDUSD, XAUUSD 등... - 시간 프레임: H1. - 계정 유형: 모든 ECN 계정
FREE
The indicator works with the following strategies: https://www.mql5.com/en/users/marku5trading/seller#!category=1 This indicator is designed to detect potential trend reversals in the forex market by analyzing price movements across three different timeframes: H4 (4-hour), H1 (1-hour), and M30 (30-minute). Core Functionality The indicator works by: Tracking Sequential Price Movements : It counts consecutive bullish (green) and bearish (red) candles based on a comparison of current close prices
FREE
Aggression Volume
Flavio Javier Jarabeck
4.14 (14)
Aggression Volume Indicator is the kind of indicator that is rarely found in the MQL5 community because it is not based on the standard Volume data provided by the Metatrader 5 platform. It requires the scrutiny of all traffic Ticks requested on the platform... That said, Aggression Volume indicator requests all Tick Data from your Broker and processes it to build a very special version of a Volume Indicator, where Buyers and Sellers aggressions are plotted in a form of Histogram. Additionally,
FREE
VisualVol EURUSD
Maxim Kuznetsov
The indicator highlights the points that a professional trader sees in ordinary indicators. VisualVol visually displays different volatility indicators on a single scale and a common align. Highlights the excess of volume indicators in color. At the same time, Tick and Real Volume, Actual range, ATR, candle size and return (open-close difference) can be displayed. Thanks to VisualVol, you will see the market periods and the right time for different trading operations. This version is intended f
FREE
The Periodic ATR Indicator visually compares the ATR values of each bar to the average ATR values for the same time of day over previous days. By contrasting the current ATR value with the historical average, this tool allows traders to identify exceptionally strong or weak market movements. It also helps to contextualize each market movement within the broader framework of long-term market behavior. This versatile indicator is compatible with all timeframes, including higher ones such as 4-hou
FREE
Moving Average Force
Lorenzo Marchesin
5 (2)
Scalp using the behavior of a short moving average, the indicator gives the slope and identifies the "hyper" moments. Operational advice: Use   M1   chart. Period 20 : open buy after two rising lows; sell after two max downhill; avoid countertrend openings; when the line goes flat put a stop at the opening price. Avoid actions in low volatility timeslots. When the curve that draws the min / max is very flat, it is better to postpone at least 15'. Period 50 : matches the trend, when it is at
FREE
CYCLE WAVE OSCILLATOR indicator is an indicator based on cyclical price fluctuations. This indicator can help you determine overbought and oversold levels, and help you predict price trends within the cycle. MT4 Version here! You can combine it with our indicators below to make your trading decisions more accurate: Supply Demand Ribbon MT5 Basic Feature: - Three Trend Types: + Zero + Basic + Advanced
FREE
YY Mono Waves MT5
Yuryi Yatsenko
3 (1)
The Mono Waves indicator is designed to display the wave behavior of the market on a chart. Its appearance is presented on slide 1.   This indicator uses the PPPC (Point-Percent Price Channel) indicator, which can be downloaded for free from the  Market .              When the market moves up, the upper border of the price channel is built on High candlestick prices (for more details, see the description of the PPPC indicator at the link given above). The higher the High prices rise
FREE
WindFlow HTF is a useful tool suited to use in conjunction together with my WindFlow indicator. This indicator will give you a background vision about the price action trend on a higher timeframe, so when it runs with the WindFlow indicator you have an almost complete trading solution. At this point, you only need some support/resistance analysis and a bit of focus to become a consistent trader. The metaphorical "wind's ballet" Professional traders know that every timeframe is governed by its o
FREE
Hull MA
Flavio Javier Jarabeck
4.59 (17)
The Hull Moving Average is not very well know in novice and maybe in intermediate trading circles, but it is a very nice solution created by the trader Alan Hull - please visit www.AlanHull.com for full details of his creation. The purpose of this moving average is to solve both problems that all famouse and common moving averages have: Lag and Choppiness . The implementation we did has, apart of the Period configuration and Price type to use in the calculations, a "velocity" factor, which could
FREE
Trend Line Finder MT5
Stephen Reynolds
5 (2)
Trend Line Finder will project forward a support and resistance lines using 2 previous highs for resistance and 2 previous lows for support.  It will then signal to the trader by alert making the trader more aware that a possible good move is about to happen.     This is not a stand-alone trading system but is very useful in finding key areas of support resistance levels where price will usually either rebound from or breakthrough. Its down to the trader to decide what to do with use of other s
FREE
This indicator will mirror the assets in use in another metatrader, being able to choose the timeframe and a template. This is the Metatrader 5 Client, it needs the Metatrader 4 or 5 Server versions: Metatrader 4 Mirror Chart Server:   https://www.mql5.com/en/market/product/88644 Metatrader 5 Mirror Chart Server: https://www.mql5.com/en/market/product/88652 Details of how it works in the video.
FREE
Follow The Line MT5
Oliver Gideon Amofa Appiah
4.52 (29)
This indicator obeys the popular maxim that: "THE TREND IS YOUR FRIEND" It paints a GREEN line for BUY and also paints a RED line for SELL. (you can change the colors). It gives alarms and alerts of all kinds. IT DOES NOT REPAINT and can be used for all currency pairs and timeframes. Yes, as easy and simple as that. Even a newbie can use it to make great and reliable trades. NB: For best results, get my other premium indicators for more powerful and reliable signals. Get them here: https://www.m
FREE
이 제품의 구매자들이 또한 구매함
Trend Screener Pro MT5
STE S.S.COMPANY
4.85 (79)
트렌드 표시기, 트렌드 트레이딩 및 필터링을 위한 획기적인 고유 솔루션, 하나의 도구 안에 내장된 모든 중요한 트렌드 기능! Forex, 상품, 암호 화폐, 지수 및 주식과 같은 모든 기호/도구에 사용할 수 있는 100% 다시 칠하지 않는 다중 시간 프레임 및 다중 통화 표시기입니다. Trend Screener는 차트에 점이 있는 화살표 추세 신호를 제공하는 효율적인 지표 추세 추종 지표입니다. 추세 분석기 표시기에서 사용할 수 있는 기능: 1. 트렌드 스캐너. 2. 최대 이익 분석이 있는 추세선. 3. 추세 통화 강도 측정기. 4. 경고가 있는 추세 반전 점. 5. 경고가 있는 강력한 추세 점. 6. 추세 화살표 Trend Screener Indicator가 있는 일일 분석 예, 일일 신호 성능...등은 여기에서 찾을 수 있습니다. 여기를 클릭하십시오. LIMITED TIME OFFER : Trend Screener Indicator는 50$ 및 평생 동안만 사용할 수 있습니다.
Описание индикатора MONEY Индикатор MONEY предназначен для анализа волатильности и выявления значительных рыночных движений (всплесков). Он использует ATR (Average True Range) для определения момента, когда цена выходит за пределы обычного диапазона, и сигнализирует об этом трейдеру с помощью стрелок на графике. Основные параметры: • Минимальное количество свечей – задает период для анализа всплесков. • Алерты (уведомления) – включение или отключение звуковых и текстовых сигналов. • Период AT
Golden Trend Indicator MT5
Noha Mohamed Fathy Younes Badr
4.88 (17)
Golden Trend indicator  is The best indicator for predicting trend movement this indicator never lags and never repaints and never back paints    and give  arrow buy and sell    before the candle appear  and it will help you and  will make your trading decisions clearer its work on all currencies and  gold and crypto and all time frame This unique  indicator uses very secret algorithms to catch the  trends, so you can trade using this indicator and see the trend clear on charts  manual guide and
Algo Pumping
Ihor Otkydach
5 (4)
PUMPING STATION – 당신만을 위한 올인원(All-in-One) 전략 PUMPING STATION은 당신의 외환 거래를 더욱 흥미롭고 효과적으로 바꿔줄 혁신적인 인디케이터입니다. 단순한 보조 도구가 아니라, 강력한 알고리즘을 갖춘 완전한 거래 시스템으로서 보다 안정적인 트레이딩을 시작할 수 있도록 도와줍니다. 이 제품을 구매하시면 다음의 혜택을 무료로 받으실 수 있습니다: 전용 설정 파일: 자동 설정으로 최대의 퍼포먼스를 제공합니다. 단계별 동영상 가이드: PUMPING STATION 전략으로 거래하는 법을 배워보세요. Pumping Utility: PUMPING STATION과 함께 사용하도록 설계된 반자동 거래 봇으로, 거래를 더욱 쉽고 편리하게 만들어줍니다. ※ 구매 후 바로 저에게 메시지를 보내주세요. 추가 자료에 대한 접근 권한을 제공해드립니다. PUMPING STATION은 어떻게 작동하나요? 트렌드 컨트롤: 시장의 추세 방향을 즉시 파악합니다. 추세는 최고의
FX Power MT5 NG
Daniel Stein
5 (13)
FX Power: 통화 강세 분석으로 더 스마트한 거래 결정을 개요 FX Power 는 어떤 시장 상황에서도 주요 통화와 금의 실제 강세를 이해하기 위한 필수 도구입니다. 강한 통화를 매수하고 약한 통화를 매도함으로써 FX Power 는 거래 결정을 단순화하고 높은 확률의 기회를 발견합니다. 트렌드를 따르거나 극단적인 델타 값을 사용해 반전을 예측하고자 한다면, 이 도구는 귀하의 거래 스타일에 완벽히 적응합니다. 단순히 거래하지 말고, FX Power 로 더 스마트하게 거래하세요. 1. FX Power가 거래자에게 매우 유용한 이유 통화와 금의 실시간 강세 분석 • FX Power 는 주요 통화와 금의 상대적 강세를 계산하고 표시하여 시장 역학에 대한 명확한 통찰력을 제공합니다. • 어떤 자산이 앞서고 있고 어떤 자산이 뒤처지는지 모니터링하여 보다 현명한 거래 결정을 내릴 수 있습니다. 포괄적인 멀티 타임프레임 뷰 • 단기, 중기 및 장기 타임프레임에서 통화와 금의 강세를
Grabber System MT5
Ihor Otkydach
5 (5)
탁월한 기술적 지표인 Grabber를 소개합니다. 이 도구는 즉시 사용 가능한 “올인원(All-Inclusive)” 트레이딩 전략으로 작동합니다. 하나의 코드 안에 강력한 시장 기술 분석 도구, 매매 신호(화살표), 알림 기능, 푸시 알림이 통합되어 있습니다. 이 인디케이터를 구매하신 모든 분들께는 다음의 항목이 무료로 제공됩니다: Grabber 유틸리티: 오픈 포지션을 자동으로 관리하는 도구 단계별 영상 매뉴얼: 설치, 설정, 그리고 실제 거래 방법을 안내 맞춤형 세트 파일: 인디케이터를 빠르게 자동 설정하여 최고의 성과를 낼 수 있도록 도와줍니다 다른 전략은 이제 잊어버리세요! Grabber만이 여러분을 새로운 트레이딩의 정점으로 이끌어 줄 수 있습니다. Grabber 전략의 주요 특징: 거래 시간 프레임: M5부터 H4까지 거래 가능한 자산: 어떤 자산이든 사용 가능하지만, 제가 직접 테스트한 종목들을 추천드립니다 (GBPUSD, GBPCAD, GBPCHF, AUDCAD, AU
Support And Resistance Screener는 하나의 지표 안에 여러 도구를 제공하는 MetaTrader에 대한 하나의 레벨 지표입니다. 사용 가능한 도구는 다음과 같습니다. 1. 시장 구조 스크리너. 2. 완고한 후퇴 영역. 3. 약세 후퇴 영역. 4. 일일 피벗 포인트 5. 주간 피벗 포인트 6. 월간 피벗 포인트 7. 고조파 패턴과 볼륨에 기반한 강력한 지지와 저항. 8. 은행 수준 구역. LIMITED TIME OFFER : HV 지원 및 저항 표시기는 50 $ 및 평생 동안만 사용할 수 있습니다. ( 원래 가격 125$ ) MQL5 블로그에 액세스하면 분석 예제와 함께 모든 프리미엄 지표를 찾을 수 있습니다. 여기를 클릭하십시오. 주요 특징들 고조파 및 볼륨 알고리즘을 기반으로 하는 강력한 지원 및 저항 영역. Harmonic 및 Volume 알고리즘을 기반으로 한 강세 및 약세 풀백 영역. 시장 구조 스크리너 일간, 주간 및 월간 피벗 포인트. 실제 거래의
FX Volume MT5
Daniel Stein
4.82 (17)
FX Volume: 브로커 시각에서 바라보는 진짜 시장 심리 간단 요약 트레이딩 접근 방식을 한층 더 향상시키고 싶으신가요? FX Volume 는 소매 트레이더와 브로커의 포지션을 실시간으로 파악할 수 있게 해 줍니다. 이는 COT 같은 지연된 보고서보다 훨씬 빠릅니다. 꾸준한 수익을 추구하는 분이든, 시장에서 더 깊은 우위를 원하시는 분이든, FX Volume 을 통해 대규모 불균형을 찾아내고, 돌파 여부를 확인하며 리스크 관리를 정교화할 수 있습니다. 지금 시작해 보세요! 실제 거래량 데이터가 의사결정을 어떻게 혁신할 수 있는지 직접 경험해 보시기 바랍니다. 1. 트레이더에게 FX Volume이 매우 유익한 이유 탁월한 정확도를 지닌 조기 경보 신호 • 다른 사람들보다 훨씬 앞서, 각 통화쌍을 매수·매도하는 트레이더 수를 거의 실시간으로 파악할 수 있습니다. • FX Volume 은 여러 리테일 브로커에서 추출한 실제 거래량 데이터를 종합해 명확하고 편리한 형태로 제공하는
FX Levels MT5
Daniel Stein
5 (4)
FX Levels: 모든 시장을 위한 뛰어난 정확도의 지지와 저항 간단 요약 통화쌍, 지수, 주식, 원자재 등 어떤 시장이든 믿을 만한 지지·저항 레벨을 찾고 싶나요? FX Levels 는 전통적인 “Lighthouse” 기법과 첨단 동적 접근을 결합해, 거의 보편적인 정확성을 제공합니다. 실제 브로커 경험을 반영하고, 자동화된 일별 업데이트와 실시간 업데이트를 결합함으로써 FX Levels 는 가격 반전 포인트를 파악하고, 수익 목표를 설정하며, 자신 있게 트레이드를 관리할 수 있게 돕습니다. 지금 바로 시도해 보세요—정교한 지지/저항 분석이 어떻게 여러분의 트레이딩을 한 단계 끌어올릴 수 있는지 직접 확인하세요! 1. FX Levels가 트레이더에게 매우 유용한 이유 뛰어난 정확도의 지지·저항 존 • FX Levels 는 다양한 브로커 환경에서도 거의 동일한 존을 생성하도록 설계되어, 데이터 피드나 시간 설정 차이로 인한 불일치를 해소합니다. • 즉, 어떤 브로커를 사용하
Gold Stuff mt5
Vasiliy Strukov
4.93 (178)
Gold Stuff mt5는 금을 위해 특별히 설계된 추세 지표이며 모든 금융 상품에서도 사용할 수 있습니다. 표시기가 다시 그려지지 않고 지연되지 않습니다. 권장 기간 H1. 설정 및 개인 보너스를 받으려면 구매 후 즉시 저에게 연락하십시오!     강력한 지원 및 트렌드 스캐너 표시기의 무료 사본을 받으실 수 있습니다. 메시지를 보내주세요. 나!   설정 화살표 그리기 - 켜기 끄기. 차트에 화살표 그리기. 경고 - 가청 경고를 끕니다. 이메일 알림 - 켜기 끄기. 이메일 알림. Puch-notification - 켜기 끄기. 푸시 알림. 다음으로 색 영역을 조정합니다. Gold Stuff mt5는 금을 위해 특별히 설계된 추세 지표이며 모든 금융 상품에서도 사용할 수 있습니다. 표시기가 다시 그려지지 않고 지연되지 않습니다. 권장 기간 H1. 설정 및 개인 보너스를 받으려면 구매 후 즉시 저에게 연락하십시오!   설정 화살표 그리기 - 켜기 끄기. 차트에 화살표 그
TPSpro RFI Levels MT5
Roman Podpora
4.55 (20)
지침         러시아   -        영어       표시기와 함께 사용하는 것이 좋습니다   .       -       TPSpro   트렌드 프로 -   MT4 버전         거래에서 핵심 요소는 거래 상품을 매수 또는 매도하기로 결정하는 구역 또는 수준입니다. 주요 업체가 시장에서 자신의 존재를 숨기려는 시도에도 불구하고, 그들은 필연적으로 흔적을 남깁니다. 우리의 과제는 이러한 흔적을 식별하고 올바르게 해석하는 방법을 배우는 것이었습니다. 주요 기능:: 판매자와 구매자를 위한 활성 영역을 표시합니다! 이 지표는 매수 및 매도를 위한 모든 올바른 초기 임펄스 레벨/존을 보여줍니다. 진입점 검색이 시작되는 이러한 레벨/존이 활성화되면 레벨의 색상이 바뀌고 특정 음영으로 채워집니다. 또한 상황을 보다 직관적으로 이해하기 위해 화살표가 나타납니다. 더 높은 시간대의 레벨/존 표시(MTF 모드) 더 높은 시간 간격을 사용하여 레벨/존을 표시하는 기능을 추가했습니다.
Basic Harmonic Patterns Dashboard MT5
Mehran Sepah Mansoor
4.13 (8)
이 대시보드는 선택한 심볼에 대해 사용 가능한 최신 고조파 패턴을 표시하므로 시간을 절약하고 더 효율적으로 사용할 수 있습니다 /   MT4 버전 . 무료 인디케이터:   Basic Harmonic Pattern 인디케이터 열 Symbol :   선택한 심볼이 나타납니다 Trend :   강세 또는 약세 Pattern :   패턴 유형(가틀리, 나비, 박쥐, 게, 상어, 사이퍼 또는 ABCD) Entry :   진입 가격 SL:   스톱로스 가격 TP1:   1차 테이크프로핏 가격 TP2:   2차 테이크프로핏 가격 TP3:   3차 테이크프로핏 가격 Current price:   현재 가격 Age (in bars):   마지막으로 그려진 패턴의 나이 주요 입력 Symbols :   "28개 주요 통화쌍" 또는 "선택한 심볼" 중에서 선택합니다. Selected Symbols :   쉼표로 구분하여 모니터링하려는 원하는 심볼("EURUSD,GBPUSD,XAUUSD")을 선택
TPSproTREND PrO MT5
Roman Podpora
4.72 (18)
VERSION MT4        —        ИНСТРУКЦИЯ RUS           —        INSTRUCTIONS  ENG 주요 기능: 렌더링 없이 정확한 입력 신호! 신호가 나타나면 관련성은 유지됩니다! 이는 신호를 제공한 후 변경하여 예금 자금 손실을 초래할 수 있는 다시 그리기 지표와의 중요한 차이점입니다. 이제 더 큰 확률과 정확도로 시장에 진입할 수 있습니다. 화살표가 나타난 후 목표에 도달(이익실현)하거나 반전 신호가 나타날 때까지 캔들을 색칠하는 기능도 있습니다. STOP LOSS / TAKE PROFIT 구역 표시 진입점 검색 시 시각적 명확성을 높이기 위해 시장 진입을 위한 최적 지점이 검색되는 BUY/SELL 영역을 초기에 표시하는 모듈을 만들었습니다. 정지 손실 수준 작업을 위한 추가 지능형 논리는 시간이 지남에 따라 크기를 줄이는 데 도움이 되므로 거래에 들어갈 때 초기 위험을 줄이는 데 도움이 됩니다(move sl). 더 높은 기간의 MIN
IX Power MT5
Daniel Stein
4.86 (7)
IX Power: 지수, 원자재, 암호화폐 및 외환 시장 통찰력을 발견하세요 개요 IX Power 는 지수, 원자재, 암호화폐 및 외환 시장의 강도를 분석할 수 있는 다목적 도구입니다. FX Power 는 모든 가용 통화 쌍 데이터를 사용하여 외환 쌍에 대해 가장 높은 정확도를 제공하는 반면, IX Power 는 기초 자산 시장 데이터에만 초점을 맞춥니다. 이로 인해 IX Power 는 비외환 시장에 이상적이며, 다중 쌍 분석이 필요하지 않은 간단한 외환 분석에도 신뢰할 수 있는 도구입니다. 모든 차트에서 매끄럽게 작동하며, 거래 결정을 향상시키기 위한 명확하고 실행 가능한 통찰력을 제공합니다. 1. IX Power가 트레이더에게 유용한 이유 다양한 시장 강도 분석 • IX Power 는 지수, 원자재, 암호화폐 및 외환 심볼의 강도를 계산하여 각 시장에 맞는 통찰력을 제공합니다. • US30, WTI, 금, 비트코인 또는 통화 쌍과 같은 자산을 모니터링하여 거래 기회를 발견
Matrix Arrow Indicator MT5
Juvenille Emperor Limited
5 (13)
매트릭스 화살표 표시기 MT5 는 외환, 상품, 암호 화폐, 지수, 주식과 같은 모든 기호/도구에 사용할 수 있는 100% 다시 칠하지 않는 다중 기간 표시기를 따르는 고유한 10 in 1 추세입니다.  Matrix Arrow Indicator MT5 는 다음과 같은 최대 10개의 표준 지표에서 정보와 데이터를 수집하여 초기 단계에서 현재 추세를 결정합니다. 평균 방향 이동 지수(ADX) 상품 채널 지수(CCI) 클래식 하이켄 아시 캔들 이동 평균 이동 평균 수렴 발산(MACD) 상대 활력 지수(RVI) 상대 강도 지수(RSI) 포물선 SAR 스토캐스틱 오실레이터 윌리엄스의 백분율 범위 모든 지표가 유효한 매수 또는 매도 신호를 제공하면 강력한 상승/하락 추세를 나타내는 다음 캔들/막대가 시작될 때 해당 화살표가 차트에 인쇄됩니다. 사용자는 사용할 표시기를 선택하고 각 표시기의 매개변수를 개별적으로 조정할 수 있습니다. 매트릭스 화살표 표시기 MT5는 선택한 표시기에서만 정보를 수
Trend Line Map Pro MT5
STE S.S.COMPANY
4.09 (11)
트렌드 라인 맵 표시기는 트렌드 스크리너 표시기의 애드온입니다. Trend screener(Trend Line Signals)에 의해 생성된 모든 신호에 대한 스캐너로 작동합니다. Trend Screener Indicator 기반의 Trend Line Scanner입니다. Trend Screener Pro 표시기가 없으면 Trend Line Map Pro가 작동하지 않습니다. It's a Trend Line Scanner based on Trend Screener Indicator. If you don't have Trend Screener Pro Indicator,     the Trend Line Map Pro will not work . MQL5 블로그에 액세스하여 추세선 지도 표시기의 무료 버전을 다운로드할 수 있습니다. Metatrader Tester 제한 없이 구매하기 전에 사용해 보십시오. : 여기를 클릭하세요 1. 쉽게 얻을 수 있는 이점 통화 및 시간 프레
Quantum TrendPulse
Bogdan Ion Puscasu
5 (13)
SuperTrend   ,   RSI   ,   Stochastic   의 힘을 하나의 포괄적인 지표로 결합하여 트레이딩 잠재력을 극대화하는 궁극의 트레이딩 도구   인 Quantum TrendPulse를   소개합니다. 정밀성과 효율성을 추구하는 트레이더를 위해 설계된 이 지표는 시장 추세, 모멘텀 변화, 최적의 진입 및 종료 지점을 자신 있게 식별하는 데 도움이 됩니다. 주요 특징: SuperTrend 통합:   주요 시장 추세를 쉽게 따라가고 수익성의 물결을 타세요. RSI 정밀도:   매수 과다 및 매도 과다 수준을 감지하여 시장 반전 시점을 파악하는 데 적합하며 SuperTrend 필터로 사용 가능 확률적 정확도:   변동성이 큰 시장에서 숨겨진 기회를 찾기 위해 확률적 진동   을 활용하고 SuperTrend의 필터로 사용 다중 시간대 분석:   M5부터 H1 또는 H4까지 다양한 시간대에 걸쳐 시장을 최신 상태로 유지하세요. 맞춤형 알림:   맞춤형 거래 조건이 충족되면
FourAverageMT5
Mikhail Sergeev
5 (2)
포라 평균은 트렌드 탐지의 새로운 단어입니다. 정보 기술의 발전과 많은 참가자들로 인해 금융 시장은 구식 지표에 의한 분석에 덜 민감해지고 있습니다. 이동 평균이나 정작과 같은 기존의 기술적 분석 도구는 순수한 형태로 추세의 방향이나 역전 방향을 결정할 수 없습니다. 하나의 지표가 14 년의 역사를 기반으로 매개 변수를 변경하지 않고 미래 가격의 올바른 방향을 나타낼 수 있습니까? 동시에,옆으로 시장의 움직임과 적절성을 잃지 않는다? 답변:예,할 수 있습니다. 우리 팀은 변화하는 시장 상황에 적응하기 위해 상당히 강력하고 효과적인 메커니즘을 가진 지표를 개발했습니다. 2025 년에 선도적 인 추세 지표"평균"은 새로운 개발 단계에 진입하고 있습니다. 현대 암호 화폐 및 주식 시장은이 지표를 위해 만들어진 것 같습니다. 고유 한 스무딩 공식을 사용하면 통화 쌍 또는 기타 악기의 모든 기능에 대한 표시기를 조정(패턴 식별)할 수 있습니다. 지금,이익을 만들기 위해,하나의 지표는 충분하다
FX Dynamic: 맞춤형 ATR 분석으로 변동성과 트렌드를 파악하세요 개요 FX Dynamic 는 Average True Range(ATR) 계산을 활용하여 트레이더에게 일간 및 일중 변동성에 대한 뛰어난 인사이트를 제공하는 강력한 도구입니다. 80%, 100%, 130%와 같은 명확한 변동성 임계값을 설정함으로써 시장이 평소 범위를 초과할 때 빠르게 경고를 받고, 유망한 수익 기회를 재빨리 식별할 수 있습니다. FX Dynamic 는 브로커의 시간대를 인식하거나 수동으로 조정할 수 있으며, 변동성 측정 기준을 일관되게 유지하며, MetaTrader 플랫폼과 완벽하게 연동되어 실시간 분석을 지원합니다. 1. FX Dynamic이 트레이더에게 매우 유용한 이유 실시간 ATR 인사이트 • 하루 및 일중 변동성을 한눈에 모니터링하세요. ATR의 80%, 100%, 130% 임계값이 도달 또는 초과되면, 시장의 중요한 지점에 있음을 알 수 있습니다. • 변동성이 완전히 폭발하기
CBT Quantum Maverick 고효율 바이너리 옵션 거래 시스템 CBT Quantum Maverick는 정밀하고 간단하며 체계적인 거래를 원하는 트레이더를 위해 설계된 고성능 바이너리 옵션 거래 시스템입니다. 사용자 지정이 필요 없으며, 처음부터 최적화된 결과를 제공합니다. 약간의 연습만으로 신호를 쉽게 마스터할 수 있습니다. 주요 특징: 정확한 신호 제공: 현재 봉 데이터를 기반으로 다음 캔들에 대한 신호를 생성하며, 빈번한 재도색이 없습니다. 다양한 시장에 대한 적응성: 바이너리 옵션 거래에 특화되었으며, 여러 브로커 및 자산 클래스와 호환됩니다. 호환 가능: Deriv Synthetic Charts: 모든 시간 프레임에서 사용 가능. OTC 차트: Quotex, PocketOption, Binomo, Stockity, IQOption, Exnova, OlympTrade, Deriv, Binolla, Homebroker 등의 브로커와 호환(MT5로의 무료 데이터 임
- Lifetime update free Contact me for instruction, any questions! Related Product:  Gold Trade Expert MT5 - Non-repaint - I just sell my products in Elif Kaya Profile, any other websites are stolen old versions, So no any new updates or support. Introduction The breakout and retest strategy is traded support and resistance levels. it involves price breaking through a previous level.  The break and retest strategy is designed to help traders do two main things, the first is to avoid false breako
우선적으로, 이 거래 도구는 전문적인 거래에 이상적인 비-다시 그리기 및 지연되지 않는 지표입니다.  온라인 강좌, 사용자 매뉴얼 및 데모. 스마트 가격 액션 컨셉트 인디케이터는 신규 및 경험 많은 트레이더 모두에게 매우 강력한 도구입니다. Inner Circle Trader Analysis 및 Smart Money Concepts Trading Strategies와 같은 고급 거래 아이디어를 결합하여 20가지 이상의 유용한 지표를 하나로 결합합니다. 이 인디케이터는 스마트 머니 컨셉트에 중점을 두어 대형 기관의 거래 방식을 제공하고 이동을 예측하는 데 도움을 줍니다.  특히 유동성 분석에 뛰어나 기관이 어떻게 거래하는지 이해하는 데 도움을 줍니다. 시장 트렌드를 예측하고 가격 변동을 신중하게 분석하는 데 탁월합니다. 귀하의 거래를 기관 전략에 맞추어 시장의 동향에 대해 더 정확한 예측을 할 수 있습니다. 이 인디케이터는 시장 구조를 분석하고 중요한 주문 블록을 식별하고 다양
Trend Hunter MT5
Andrey Tatarinov
5 (2)
Trend Hunter 는 Forex, 암호화폐 및 CFD 시장에서 작업하기 위한 추세 지표입니다. 이 지표의 특별한 특징은 가격이 추세선을 약간 돌파할 때 신호를 변경하지 않고 자신있게 추세를 따른다는 것입니다. 표시기는 다시 그려지지 않으며 막대가 닫힌 후에 시장 진입 신호가 나타납니다. 추세를 따라 이동할 때 표시기는 추세 방향에 대한 추가 진입점을 표시합니다. 이러한 신호를 바탕으로 작은 StopLoss로 거래할 수 있습니다. Trend Hunter 는 정직한 지표입니다. 표시 신호 위로 마우스를 가져가면 신호의 잠재적 이익과 가능한 중지가 표시됩니다. 새로운 신호가 나타나면 다음 알림을 받을 수 있습니다. 알리다 푸시 알림 이메일로 알림 텔레그램 알림 차트 스크린샷도 텔레그램으로 전송되므로 거래 결정을 내리기 위해 단말기를 열 필요가 없습니다. 표시 신호는 텔레그램 채널 https://www.mql5.com/ko/market/product/11085#!tab=com
우선 이 거래 시스템이 리페인팅, 리드로잉 및 레이그 인디케이터가 아니라는 점을 강조하는 것이 중요합니다. 이는 수동 및 로봇 거래 모두에 이상적인 것으로 만듭니다. 온라인 강좌, 설명서 및 프리셋 다운로드. "스마트 트렌드 트레이딩 시스템 MT5"은 새로운 및 경험이 풍부한 트레이더를 위해 맞춤형으로 제작된 종합적인 거래 솔루션입니다. 10개 이상의 프리미엄 인디케이터를 결합하고 7개 이상의 견고한 거래 전략을 특징으로 하여 다양한 시장 조건에 대한 다목적 선택이 가능합니다. 트렌드 추종 전략: 효과적인 트렌드 추이를 타기 위한 정확한 진입 및 손절 관리를 제공합니다. 반전 전략: 잠재적인 트렌드 반전을 식별하여 트레이더가 범위 시장을 활용할 수 있게 합니다. 스캘핑 전략: 빠르고 정확한 데이 트레이딩 및 단기 거래를 위해 설계되었습니다. 안정성: 모든 인디케이터가 리페인팅, 리드로잉 및 레이그가 아니므로 신뢰할 수 있는 신호를 보장합니다. 맞춤화: 개별 거래 선호도를 고려한 맞춤
Royal Scalping Indicator M5
Vahidreza Heidar Gholami
5 (6)
Royal Scalping Indicator is an advanced price adaptive indicator designed to generate high-quality trading signals. Built-in multi-timeframe and multi-currency capabilities make it even more powerful to have configurations based on different symbols and timeframes. This indicator is perfect for scalp trades as well as swing trades. Royal Scalping is not just an indicator, but a trading strategy itself. Features Price Adaptive Trend Detector Algorithm Multi-Timeframe and Multi-Currency Trend Low
Gold Trend 5
Sergei Linskii
3.5 (2)
금 추세 - 좋은 주식 기술 지표입니다. 인디케이터 알고리즘은 자산의 가격 움직임을 분석하고 변동성과 잠재적 진입 구간을 반영합니다. 최고의 지표 신호: - 매도 = 빨간색 히스토그램 + 빨간색 숏 포인터 + 같은 방향의 노란색 신호 화살표. - 매수 = 파란색 히스토그램 + 파란색 롱 포인터 + 같은 방향의 아쿠아 신호 화살표. 인디케이터의 장점 1. 표시기는 높은 정확도로 신호를 생성합니다. 2. 확인된 화살표 신호는 추세가 바뀔 때만 다시 그릴 수 있습니다. 3. 모든 브로커의 메타트레이더 5 거래 플랫폼에서 거래할 수 있습니다. 4. 모든 자산(통화, 금속, 암호화폐, 주식, 지수 등)을 거래할 수 있습니다. 5. H1 차트주기(중기 트레이딩)에서 거래하는 것이 좋습니다. 6. 지표 설정에서 개별 매개 변수(TF, 색상 등)를 변경할 수 있으므로 각 트레이더가 지표를 쉽게 사용자 지정할 수 있습니다. 7. 이 보조지표는 독립적인 트레이딩 시스템뿐만 아니라 트레이딩
Auto Order Block with break of structure based on ICT and Smart Money Concepts (SMC) Futures Break of Structure ( BoS )             Order block ( OB )            Higher time frame Order block / Point of Interest ( POI )    shown on current chart           Fair value Gap ( FVG ) / Imbalance   -  MTF      ( Multi Time Frame )    HH/LL/HL/LH  -  MTF      ( Multi Time Frame )  Choch  MTF      ( Multi Time Frame )  Volume Imbalance     ,  MTF          vIMB Gap’s Power of 3 Equal High / Low’s  
Volumatic VIDyA MT5
Duc Hoan Nguyen
5 (2)
Special offer : ALL TOOLS , just $35 each! New tools   will be   $30   for the   first week   or the   first 3 purchases !  Trading Tools Channel on MQL5 : Join my MQL5 channel to update the latest news from me Volumatic VIDYA (Variable Index Dynamic Average) 는 트렌드를 추적하고 각 트렌드 단계에서 매수 및 매도 압력을 분석하기 위해 설계된 고급 지표입니다. 가변 지수 동적 평균(Variable Index Dynamic Average)을 핵심 동적 평활화 기술로 활용하여 이 도구는 주요 시장 구조 수준에서 가격 및 거래량 역학에 대한 중요한 통찰력을 제공합니다. MT4 버전 보기:  Volumatic VIDyA MT4 다른 제품 보기:    모든 제품 To use iCustom
Atomic Analyst MT5
Issam Kassas
4.32 (19)
우선적으로 언급할 점은이 거래 지표가 다시 그리지 않고 지연되지 않으며 이를 통해 수동 및 로봇 거래 모두에 이상적이라는 점입니다. 사용자 매뉴얼: 설정, 입력 및 전략. Atomic Analyst는 가격의 강도와 모멘텀을 활용하여 시장에서 더 나은 이점을 찾는 PA Price Action Indicator입니다. 고급 필터를 장착하여 잡음과 거짓 신호를 제거하고 거래 잠재력을 높이는 데 도움이 됩니다. 복잡한 지표의 다중 레이어를 사용하여 Atomic Analyst는 차트를 스캔하고 복잡한 수학적 계산을 간단한 신호와 색상으로 변환하여 초보 트레이더가 이해하고 일관된 거래 결정을 내릴 수 있도록합니다. "Atomic Analyst"는 새로운 및 경험이 풍부한 트레이더를위한 종합적인 거래 솔루션입니다. 프리미엄 지표와 최고 수준의 기능을 하나의 거래 전략에 결합하여 모든 종류의 트레이더에 대한 다재다능한 선택지가되었습니다. 인트라데이 거래 및 스캘핑 전략 : 빠르고 정확한 일일
ATrend
Zaha Feiz
4.77 (13)
ATREND: 작동 방식 및 사용 방법 ### 작동 방식 MT5 플랫폼을 위한 "ATREND" 지표는 기술 분석 방법론의 조합을 활용하여 트레이더에게 강력한 매수 및 매도 신호를 제공하도록 설계되었습니다. 이 지표는 주로 변동성 측정을 위해 평균 진폭 범위(ATR)를 활용하며, 잠재적인 시장 움직임을 식별하기 위한 트렌드 탐지 알고리즘과 함께 사용됩니다. 구매 후 메시지를 남기면 특별 보너스 선물을 받게 됩니다. ### 주요 특징: - 동적 트렌드 탐지: 이 지표는 시장 트렌드를 평가하고 신호를 조정하여 트레이더가 현재 시장 상황에 맞춰 전략을 조정할 수 있도록 돕습니다. - 변동성 측정: ATR을 사용하여 시장의 변동성을 측정하며, 이는 최적의 손절매(SL) 및 이익 실현(TP) 수준을 결정하는 데 중요합니다. - 신호 시각화: 이 지표는 차트에 매수 및 매도 신호를 시각적으로 표시하여 트레이더의 의사 결정을 향상시킵니다. ### 운영 단계 #### 입력 및 설정 - TimeFr
제작자의 제품 더 보기
Mutliple MA
Bambang Arief
The Moving Average indicator remains one of the most popular tools in trading due to its simplicity, adaptability, and effectiveness in identifying market trends. Its role as a foundational tool for other technical indicators further cements its importance in both traditional and modern trading strategies. The Multi MA indicator has 8 Moving Averages which can be plotted simultaneously using a unique set up of each MA. Make Your Trading Simple dan Profit Again ! 
필터:
dafi7
392
dafi7 2025.01.28 18:30 
 

Highly recommended indicator Thank you

리뷰 답변
버전 2.0 2025.01.27
Version update:
Dynamic color based on trend.
The trend depend to MA2 and MA3 condition, whether above or below each other, while MA1 as confirmation or early detector.