Fibonacci Confluence Higher TF for MT5
- 지표
- Minh Truong Pham
- 버전: 1.0
- 활성화: 5
The Fibonacci Confluence Toolkit is a technical analysis tool designed to help traders identify potential price reversal zones by combining key market signals and patterns. It highlights areas of interest where significant price action or reactions are anticipated, automatically applies Fibonacci retracement levels to outline potential pullback zones, and detects engulfing candle patterns.
Its unique strength lies in its reliance solely on price patterns, eliminating the need for user-defined inputs, ensuring a robust and objective analysis of market dynamics.
🔶 HOW IT WORK
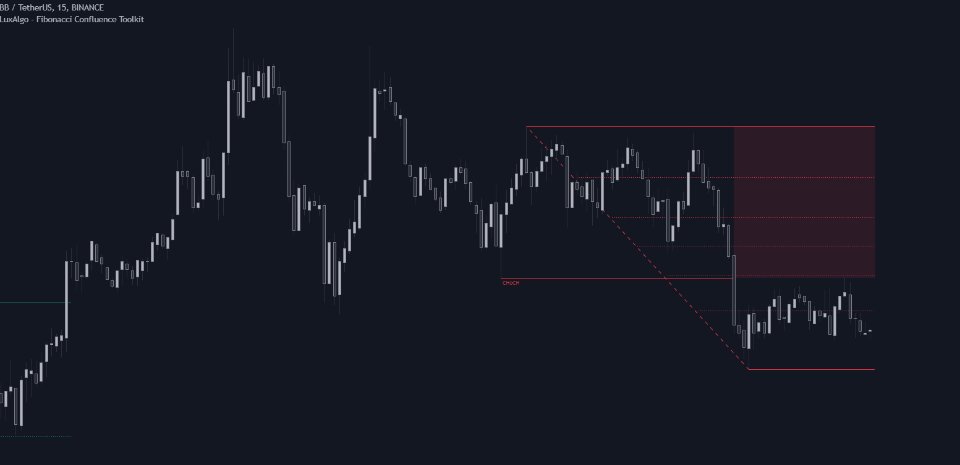
First, the indicator identifies market structures based on pivot points. When determining the Market Structure Shift (MSS) using Long Term Highs/Lows (LT L/H) points (ICT Long Term Market Structures—you can display these points on the chart by enabling the "Show Swing Levels" setting), the indicator will mark Fibonacci levels and highlight Areas of Interest.
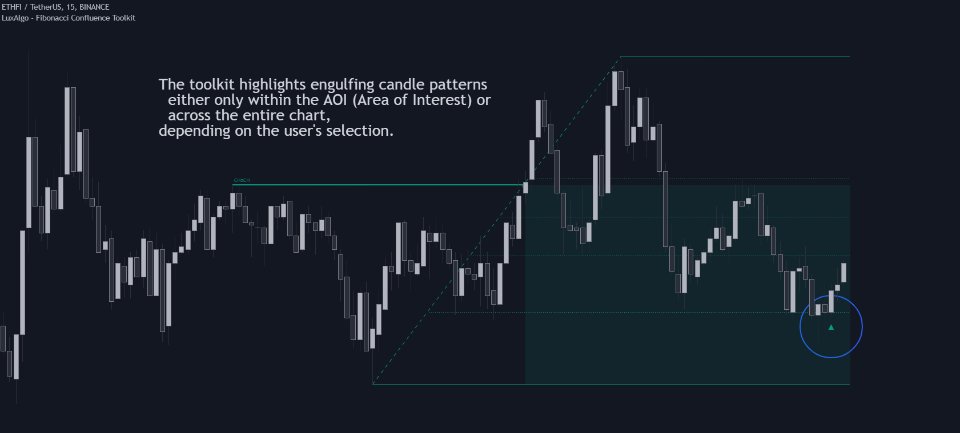
When the price retraces to the Fibonacci zones, the indicator searches for Engulfing Candle Patterns. Buy and sell signals are generated when the price is within the Area of Interest and an Engulfing pattern is present.
A Market Structure Shift is considered invalid if the price moves in the opposite direction.
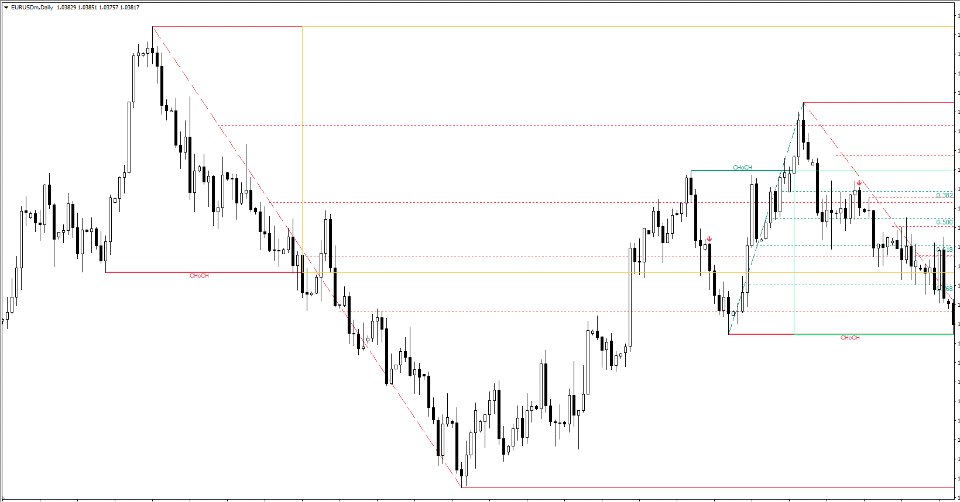
The advancement of this indicator is its ability to identify the aforementioned factors on higher timeframes. This allows you to monitor Fibonacci Confluence on larger timeframes (H4, D1) while seeking entry points on smaller timeframes such as M5 and M15.
🔶 USAGE
Figure 1
Market structures are constructed from three sets of swing points, short-term swings, intermediary swings, and long-term swings. Market structures associated with longer-term swing points are indicative of longer-term trends.
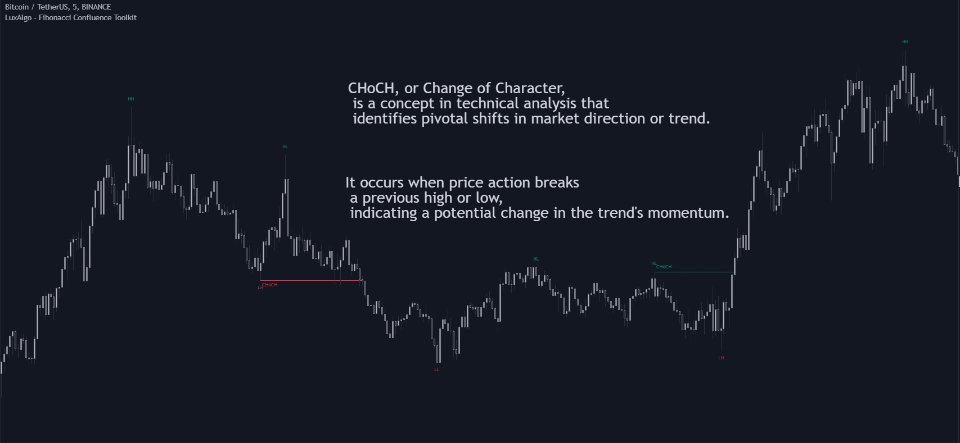
A market structure shift (MSS), also known as a change of character (CHoCH), is a significant event in price action analysis that may signal a potential shift in market sentiment or direction. Conversely, a break of structure (BOS) is another significant event in price action analysis that typically indicates a continuation of the prevailing trend.
However, it's important to note that while an MSS can be the first indication of a trend reversal and a BOS signifies a continuation of the prevailing trend, they do not guarantee a complete reversal or continuation of the trend.
The script begins by detecting CHoCH (Change of Character) points—key indicators of shifts in market direction.
Figure 2
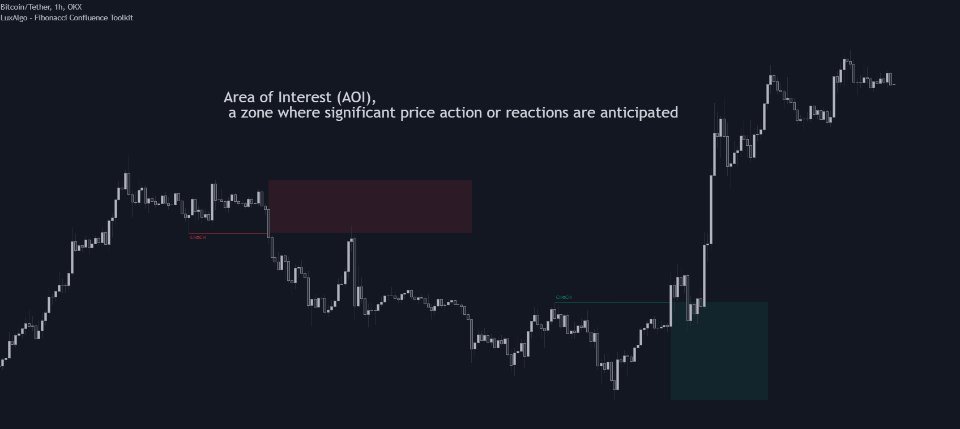
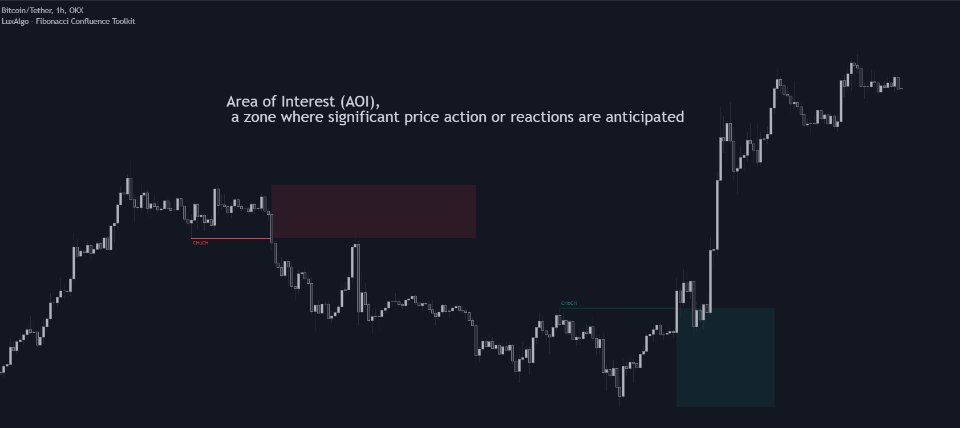
The detected CHoCH points serve as the foundation for defining an Area of Interest (AOI), a zone where significant price action or reactions are anticipated. (Figure 3)
As new swing highs or lows emerge within the AOI, the tool automatically applies Fibonacci retracement levels to outline potential retracement zones. This setup enables traders to identify areas where price pullbacks may occur, offering actionable insights into potential entries or reversals. (Figure 4)
Additionally, the toolkit highlights engulfing candle patterns within these zones, further refining entry points and enhancing confluence for better-informed trading decisions based on real-time trend dynamics and price behavior. (Figure 5)
🔶 SETTINGS
🔹 Market Patterns
- Bullish Structures: Enable or disable all bullish components of the indicator.
- Bearish Structures: Enable or disable all bearish components of the indicator.
- Highlight Area of Interest: Toggle the option to highlight the Areas of Interest (enabled or disabled).
- CHoCH Line: Choose the line style for the CHoCH (Solid, Dashed, or Dotted).
- Width: Adjust the width of the CHoCH line.
🔹 Retracement Levels
- Choose which Fibonacci retracement levels to display (e.g., 0, 0.236, 0.382, etc.).
- Swing Levels: Select how swing levels are marked
- Engulfing Candle Patterns: Choose which engulfing candle patterns to detect (All, Structure-Based, or Disabled).
🔹 Notification Settings
🔹 Higher timeframe setting.

