SourcePoint For MT4
- 지표
- Yan Qi Zhu
- 버전: 1.0
- 활성화: 5
SourcePoint是一个很好的中长线交易指示器,他能独立使用,也可以去其他趋势型指标独立使用,可以很明确的给出趋势走向,很好的指出最佳的buy和sell位置,指标不含有未来函数,不会重新绘制,不仅能够应用到自己的手动交易过程中,还能完全可以写入到自己的EA中,如果你需要MT5版本可以去(https://www.mql5.com/zh/market/product/101744?source=Site+Market+My+Products+Page#description)。(如果你感觉到这个指标能够帮助你进行更准确的交易,请帮忙给个好评,希望我的作品能够帮助更多有需要的人)
===================参数列表=====================
fastP: 96
slowP:208
avgP:72
=================参考使用方法===================
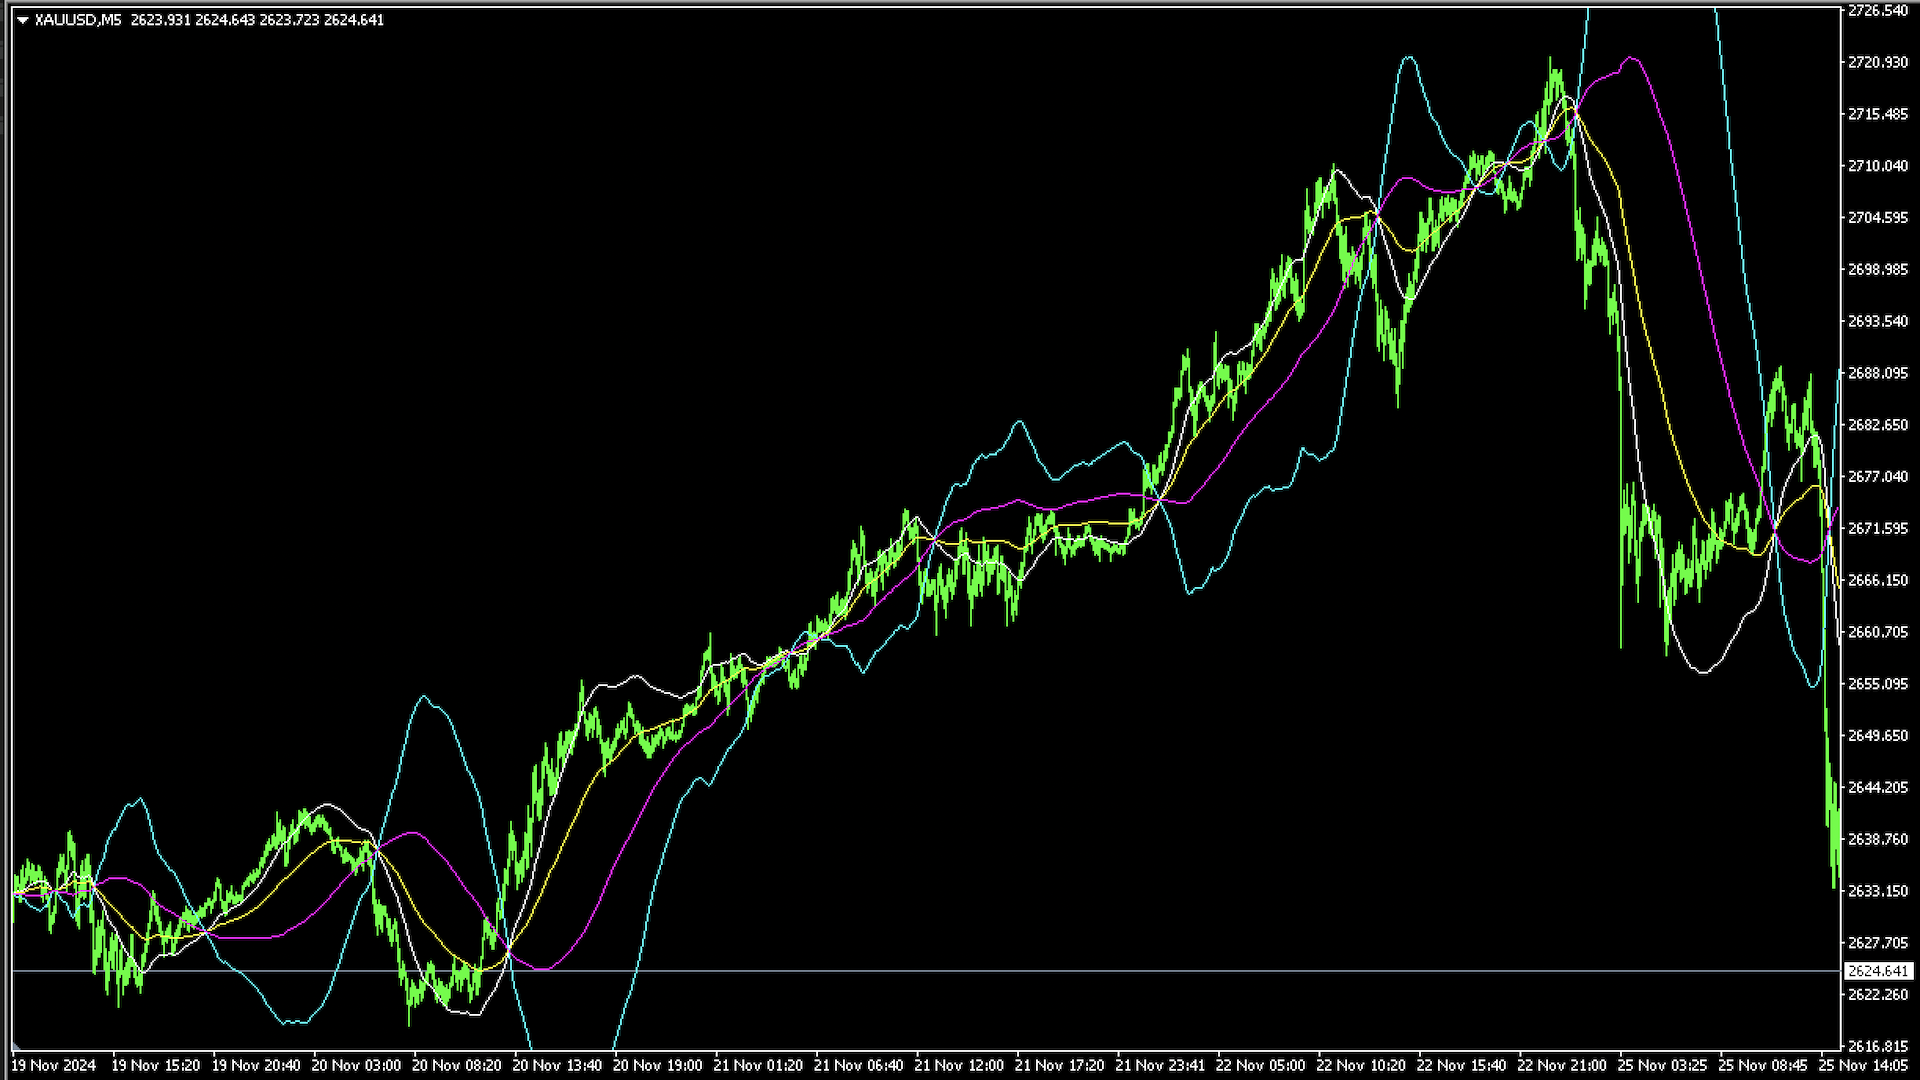
此指标可以适用于任何交易品种,能够用在任何周期。
个人建议:短线交易选择M5,中长线交易选择M15
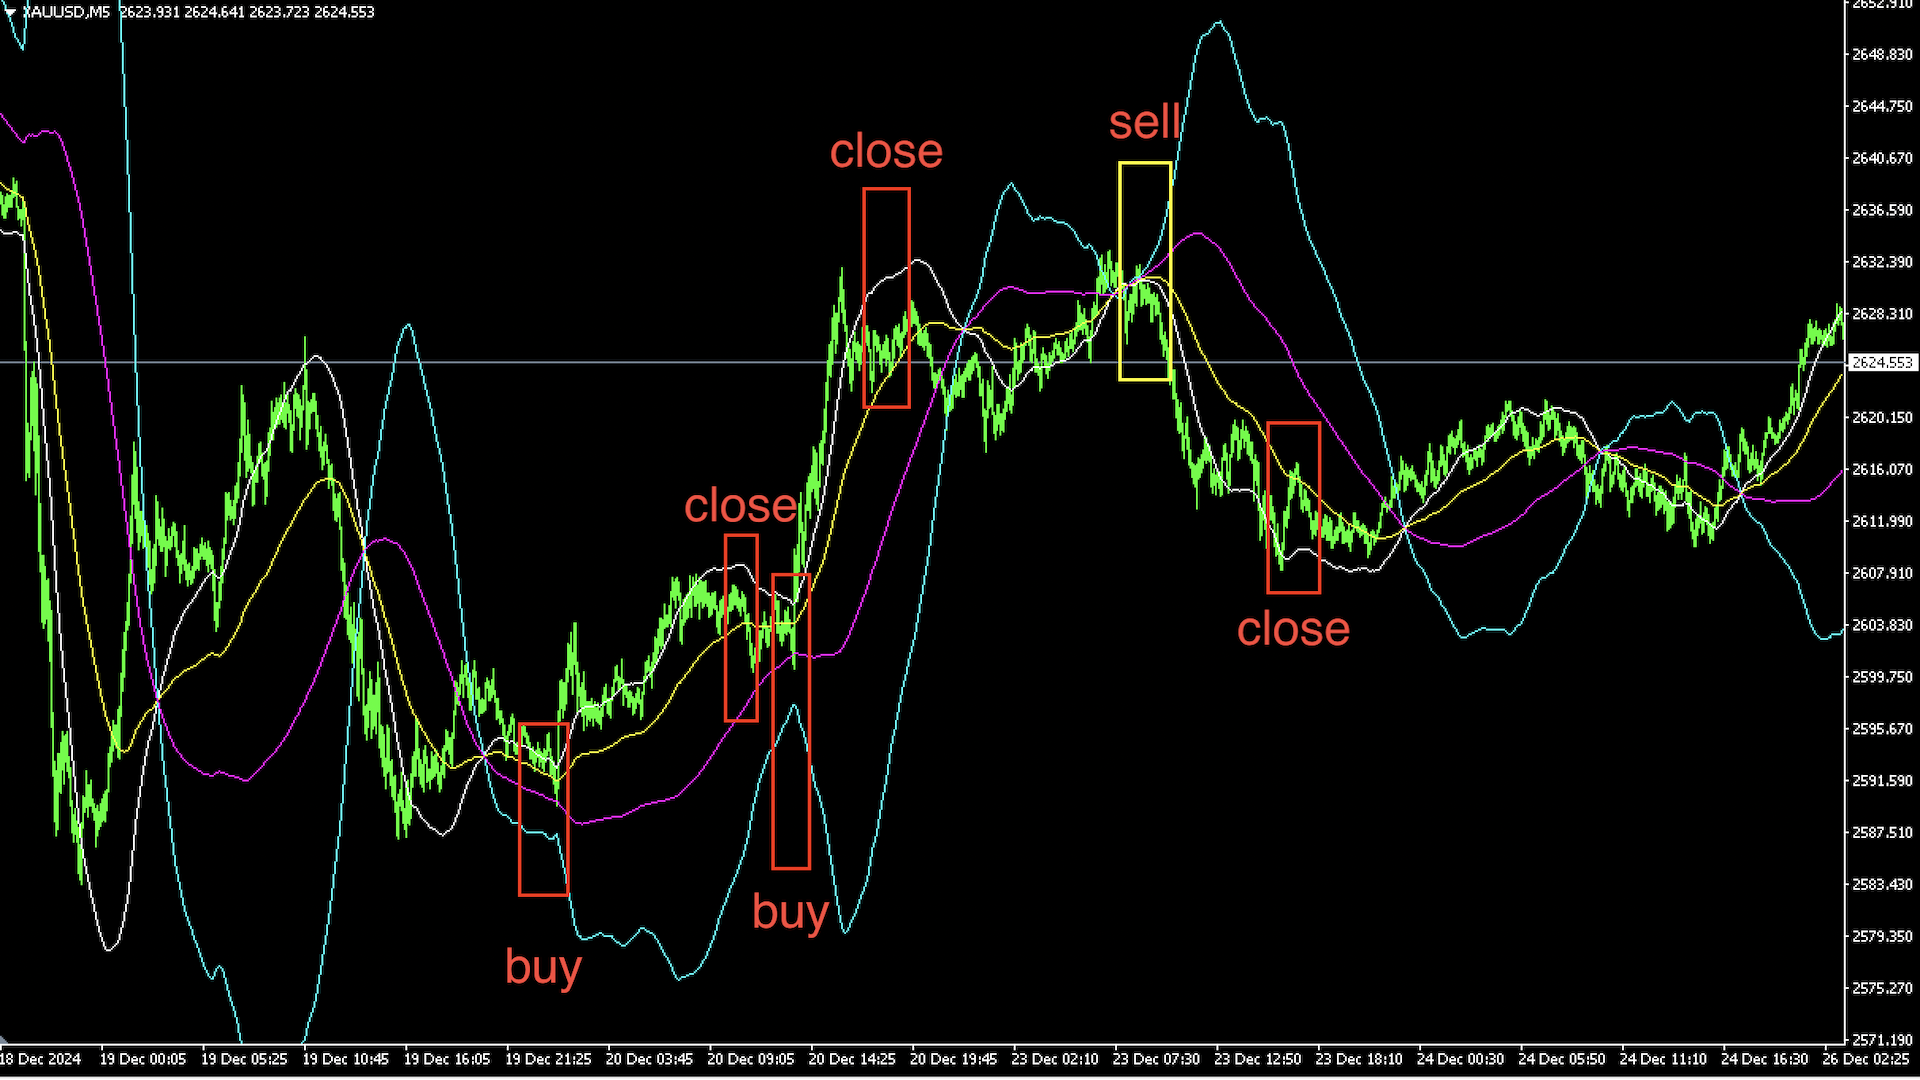
每次形成一个交点,就是一个交易机会,同时也是一个持仓平仓点位。建议配合大小周期一起使用,这样更容易让你找到更精准的入场位置和出场位置