• 미리보기
  • 리뷰 (521)
  • 코멘트 (714)
  • 새 소식

True Direction Oscillator

4.86

또는 (TDO) "순수 모멘텀"의 원리를 사용하여 가격 변화율을 측정하는 지수입니다.

유가 증권 가격이 10에서 15로 상승하면 가격 변동률은 150%이지만 15에서 10으로 다시 하락하면 가격 변동률은 33.3%에 불과합니다. 이것이 "가격 변화율"(ROC) 또는 "모멘텀"과 같은 기술적 분석 지표가 내림차순에 제공된 것보다 상승하는 가격 움직임에 대해 더 높은 수치를 제공하는 이유입니다. TDO는 트레이더가 모멘텀을 올바르게 읽을 수 있도록 이 문제를 수정합니다.


중요한 정보

    TDO 사용자 매뉴얼:https://www.mql5.com/en/blogs/post/717970
        TDO FAQ :https://www.mql5.com/en/blogs/post/722015
            TDO 비디오 라이브러리:https://www.mql5.com/en/blogs/post/722018
                TDO 전문가 고문 예:https://www.mql5.com/en/blogs/post/731141

                  TDO 기능

                    TDO는 순수 모멘텀을 백분율로 계산하므로 다른 시장의 여러 증권을 비교하는 데 사용됩니다. (예: EURUSD를 Gold & Dow Jones Industrial과 비교).

                    TDO 패널 계산은 5가지 다른 기간에 따라 달라지며 광범위한 시장 주기를 포괄하고 추세를 포착하는 데 더 효과적일 수 있습니다.

                    TDO 화살표는 모든 TDO 패널 점이 처음으로 일직선에 있을 때 나타납니다. 이 기능은 거짓 제로 라인 교차 신호의 수를 가장 낮은 수로 줄입니다.

                    추세가 강화되고 화살표 신호가 새로운 추세의 시작 부분에 나타날 때 소리, 이메일 경고.

                    기호 버튼을 눌러 FX 쌍 사이를 전환할 수 있습니다. 새 창에서 차트를 열도록 선택할 수 있습니다.

                    채널 버튼을 눌러 표준 편차 채널 또는 선형 회귀 채널을 추가할 수 있습니다.

                    다양한 수준의 라운드 번호에서 그리드를 추가할 수 있습니다.

                    지원 및 저항 수준을 추가할 수 있습니다.

                    사용자가 매개변수 사이를 탐색하는 데 도움이 되도록 잘 설계된 매개변수.

                    TDO 코드는 사용자의 PC 메모리를 소모하지 않도록 수정되었습니다.

                    TDO 화살표는 결과를 다시 그리거나 다시 계산하지 않습니다.


                    중요한 TDO 매개변수


                    1) TDO 설정

                    • 첫 번째 TDO 기간 [ Min =1 ]:TDO 패널의 첫 번째 주기입니다. 기본값은 10입니다.

                    2) TDO 색상 목록 및 버튼

                    • 차트 색상 목록:4가지 색상 목록 중에서 선택하거나 (아무것도 하지 않음) 선택할 수 있습니다.

                      3) TDO 화살표 및 경고
                      4) TDO 패널 경고
                      5) TDO 기호 버튼

                      • 기호 패널을 표시하는 창: 기본 차트 창또는 TDO 창에기호 버튼을 표시합니다.
                      • 버튼 클릭 동작: 같은 창또는 새 창에서 차트 열기 .
                      • 기호 출처: 사용자 지정 기호 목록또는 Market Watch에서기호를 가져옵니다.
                      • 기호 목록(";"으로 구분):사용자 지정 목록에서 기호를 선택한 경우 ";"으로 기호를 구분합니다.
                      • 가로 행의 버튼 [Min=(1)]:한 행에 표시할 버튼의 수입니다.
                      • 표시할 시간 프레임 [Min=(1) & Max=(9)]:기본값은 7입니다.

                      6) TDO 채널

                      • 채널 종류: 표준 편차 채널또는 선형 회귀 채널 중에서 선택합니다.
                      • Channel Ray: 채널을 광선으로 표시합니다.
                      • 채널 길이:채널 계산에 사용된 촛불의 수입니다. 기본값은 160입니다.

                      7) TDO 그리드 라인

                      • 하위 그리드 레벨 수:기본 그리드 레벨 사이에 0에서 10개의 하위 레벨을 추가할 수 있습니다.

                      8) TDO 지그존 레벨


                      질문이 있으시면 비밀 메시지를 통해 저에게 연락하거나 의견 섹션에 작성하십시오.
                      무하마드 알 버마우이, CMT


                      리뷰 521
                      Jimmy Christianus Hendrikus Janssen
                      372
                       

                      This indicator stands out for its simplicity and sophistication. I appreciate how it builds upon existing analytical frameworks with an innovative approach. It offers a promising method for confirming trends objectively by analyzing momentum shifts. I fully endorse its potential.

                      garypang
                      203
                      garypang 2024.12.26 02:59 
                       

                      TDO shows the trend direction. Allow me to trade with confident. Fast response and support from Muhammad Elbermawi. Thank you

                      Yusuf Hamzah
                      746
                      Yusuf Hamzah 2024.09.08 17:12 
                       

                      The indicator is logically simple and elegant. I value an innovative idea that improve on existing analysis framework. It provides a potential for an unbiased trend confirmation (via momentum movement). I vouch for this.

                      추천 제품
                      Royal Dutch Skunk
                      Sayan Vandenhout
                      ROYAL DUTCH SKUNK USES THE TREND WAVE INDICATOR AND IT CAN IDENTIFY THE BEGINNING AND THE END OF A NEW WAVE TREND MOVEMENT. AS AN OSCILLATOR, THE INDICATOR IDENTIFIES THE OVERBOUGHT AND OVERSOLD ZONES. IT WORKS GREAT TO CATCH THE SHORT TERM PRICE REVERSALS AND USES A MARTINGALE STRATEGY TO CLOSE ALL TRADES IN PROFIT. USE DEFAULT SETTINGS ON H1 OR HIGHER TIME FRAME ON ANY PAIR FOR MORE ACCURATE TRADES WHY THIS EA : Smart entries calculated by 6 great strategies The EA can be run on even a $20000
                      VR Cub
                      Vladimir Pastushak
                      VR Cub 은 고품질 진입점을 얻는 지표입니다. 이 지표는 수학적 계산을 용이하게 하고 포지션 진입점 검색을 단순화하기 위해 개발되었습니다. 지표가 작성된 거래 전략은 수년 동안 그 효율성을 입증해 왔습니다. 거래 전략의 단순성은 초보 거래자라도 성공적으로 거래할 수 있다는 큰 장점입니다. VR Cub은 포지션 개시 지점과 이익 실현 및 손절매 목표 수준을 계산하여 효율성과 사용 편의성을 크게 높입니다. 간단한 거래 규칙을 이해하려면 아래 전략을 사용한 거래 스크린샷을 살펴보세요. 설정, 세트 파일, 데모 버전, 지침, 문제 해결 등은 다음에서 얻을 수 있습니다. [블로그] 다음에서 리뷰를 읽거나 작성할 수 있습니다. [링크] 버전 [MetaTrader 5] 진입점 계산 규칙 포지션 개설 진입점을 계산하려면 VR Cub 도구를 마지막 최고점에서 마지막 최저점까지 늘려야 합니다. 첫 번째 지점이 두 번째 지점보다 빠른 경우, 거래자는 막대가 중간선 위에서 마감될 때까지 기다립니다
                      Strong Retracement Points Pro demo edition! SRP (Strong Retracement/Reversal Points) is a powerful and unique support and resistance indicator. It displays the closest important levels which we expect the price retracement/reversal! If all level are broken from one side, it recalculates and draws new support and resistance levels, so the levels might be valid for several days depending on the market! If you are still hesitating to start using this wonderful tool, you can check this link to see h
                      GeoWprPro
                      Georgij Komarov
                      WPR by Profile, or WPR for Professionals Geo_WprPro is one of the well-known currency profile indicators. It simultaneously displays two WPR indicators with different parameters in the matrix form on all timeframes of multiple currency pairs forming the currency profile . As follows from the description, " WPR is a leading indicator that often goes ahead of the price chart. The oscillator frequently reaches extreme values before the price reversal as if anticipating that event: it almost always
                      Auto Fibo Pro m
                      DMITRII GRIDASOV
                      "Auto FIBO Pro" Crypto_Forex 지표 - 거래에 유용한 보조 도구입니다! - 지표는 자동으로 Fibo 수준과 로컬 추세선(빨간색)을 계산하여 차트에 배치합니다. - Fibonacci 수준은 가격이 반전될 수 있는 주요 영역을 나타냅니다. - 가장 중요한 수준은 23.6%, 38.2%, 50%, 61.8%입니다. - 역전 스캘핑이나 존 그리드 거래에 사용할 수 있습니다. - Auto FIBO Pro 지표를 사용하여 현재 시스템을 개선할 수 있는 기회도 많습니다. - Info Spread Swap Display가 있습니다. 현재 Spread와 Swap이 부착된 외환 쌍을 표시합니다. - 디스플레이에는 계정 잔액, 자본 및 마진도 표시됩니다. - 차트의 어느 모서리에서나 Info Spread Swap Display를 찾을 수 있습니다. 0 - 왼쪽 상단 모서리, 1 - 오른쪽 상단, 2 - 왼쪽 하단, 3 - 오른쪽 하단. // 훌륭한 트레이딩 로봇과 지표는 여기
                      | Fully-automated Smart Money Concept (ICT) inspired trading solution with multi-strategy capabilities | Built by a grid trader >> for grid traders.  This is MT4 version, click  here  for  Blue CARA MT5  (settings and logics are same in both versions)     Real monitoring signal  -->  Cara Gold Intro Blue CARA EA   ('CARA') - short for  C omprehensive  A lgorithmic R esponsive A dvisor is a next-gen  multi-currency    multi-timeframe  EA base on the widely known (and perhapse most popular) Inn
                      The Infinity Expert Advisor is a scalper. When the resistance and support levels are broken, trades are opened in the direction of the price movement. Open positions are managed by several algorithms based on the current market situation (fixed stop loss and take profit, trailing stop, holding positions in case of trend indication, etc.). Requirements for the broker The EA is sensitive to spread, slippages and execution quality. It is strongly recommended not to use the EA for currencies with s
                      GG TrendBar Indicator - Your Multitimeframe ADX Trading Solution Experience the power of multi-timeframe trading with the "GG TrendBar Indicator." This versatile tool, built upon the ADX indicator, offers precise insights by considering multiple timeframes, ensuring you make well-informed trading decisions. Basic Details : Indicator Type : GG TrendBar Indicator (Multi-Timeframe ADX) Key Metrics : Real-time ADX analysis across multiple timeframes. Customization : Enable or disable specific timefr
                      Owl smart levels
                      Sergey Ermolov
                      4.24 (37)
                      MT5 버전  |   FAQ Owl Smart Levels Indicator 는   Bill Williams 의 고급 프랙탈, 시장의 올바른 파동 구조를 구축하는 Valable ZigZag, 정확한 진입 수준을 표시하는 피보나치 수준과 같은 인기 있는 시장 분석 도구를 포함하는 하나의 지표 내에서 완전한 거래 시스템입니다. 시장과 이익을 취하는 장소로. 전략에 대한 자세한 설명 표시기 작업에 대한 지침 고문-거래 올빼미 도우미의 조수 개인 사용자 채팅 ->구입 후 나에게 쓰기,나는 개인 채팅에 당신을 추가하고 거기에 모든 보너스를 다운로드 할 수 있습니다 힘은 단순함에 있습니다! Owl Smart Levels   거래 시스템은 사용하기 매우 쉽기 때문에 전문가와 이제 막 시장을 연구하고 스스로 거래 전략을 선택하기 시작한 사람들 모두에게 적합합니다. 전략 및 지표에는 눈에 보이지 않는 비밀 공식 및 계산 방법이 없으며 모든 전략 지표는 공개되어 있습니다. Owl Smart Leve
                      Instantaneous cycle identifier
                      Mahmoud Helmy Sedik Mohamed Mansour
                      This is first public release of detector code entitled "Enhanced Instantaneous Cycle Period" for PSv4.0 I built many months ago. Be forewarned, this is not an indicator, this is a detector to be used by ADVANCED developers to build futuristic indicators in Pine. The origins of this script come from a document by   Dr   . John   Ehlers   entitled "SIGNAL ANALYSIS CONCEPTS". You may find this using the NSA's reverse search engine "goggles", as I call it. John Ehlers' MESA used this measurement to
                      Harvest GOLD
                      Sayan Vandenhout
                      Harvest GOLD USES THE TREND WAVE INDICATOR AND IT CAN IDENTIFY THE BEGINNING AND THE END OF A NEW WAVE TREND MOVEMENT. AS AN OSCILLATOR, THE INDICATOR IDENTIFIES THE OVERBOUGHT AND OVERSOLD ZONES. IT WORKS GREAT TO CATCH THE SHORT TERM PRICE REVERSALS AND USES A MARTINGALE STRATEGY TO CLOSE ALL TRADES IN PROFIT. USE DEFAULT SETTINGS ON H1 OR HIGHER TIME FRAME ON ANY PAIR FOR MORE ACCURATE TRADES WHY THIS EA : Smart entries calculated by 3 great strategies The EA can be run on even a $30000
                      SL TP Manager Utility
                      AL MOOSAWI ABDULLAH JAFFER BAQER
                      SL-TP Manager Utility for MT4 - Professional Risk Management Tool Advanced Position Protection & Profit Management SL-TP Manager Utility is a powerful, intuitive tool designed for traders who want precise control over their risk management. This utility provides a sleek interface for setting, modifying, and managing your Stop Loss, Take Profit, and Trailing Stop levels with just a few clicks. Key Features: Dual Mode Operation: Set values in pips or absolute price with a simple toggle Independent
                      Noize Absorption Index MT4
                      Ekaterina Saltykova
                      5 (1)
                      Noize Absorption Index - is the manual trading system that measures the difference of pressure between bears forces and bulls forces. Green line - is a noize free index that showing curent situation. Zero value of index shows totally choppy/flat market.Values above zero level shows how powerfull bullish wave is and values below zero measures bearish forces.Up arrow appears on bearish market when it's ready to reverse, dn arrow appears on weak bullish market, as a result of reverse expectation. S
                      Ilanis
                      Mikhail Sergeev
                      4.74 (27)
                      Ilanis is and Expert Advisor for stock trading, it can be used for trading on Forex and other markets, including commodities, metals and index markets. To determine the market entry, the EA uses the modern and ultra-light adaptive indicator FourAverage. Principle of position maintaining is similar to that of the popular Forex robot Ilan, using averaging. But unlike Ilan, Ilanis uses an accurate entry into the market. The robot pays a lot of attention to position control, if the price goes in the
                      Smart Funded Hft
                      Barbaros Bulent Kortarla
                      4.81 (64)
                      스마트 펀드 HFT EA로 거래 잠재력을 해제하세요! VPS 없음 / 설정 파일 없음 / 플러그 앤 플레이 즐기기 / 아래 쉬운 설정 비디오 확인 한정된 시간 동안 프로모션 가격 제 거래의 비밀을 공유하게 되어 매우 기쁩니다 – 스마트 펀드 EA. 수백 가지 도전을 완벽한 성공률로 정복했으며, 이제 여러분의 거래 게임을 한 단계 업그레이드할 차례입니다! 이 EA는 HFT 사용을 허용하는 프롭 회사의 HFT 도전을 통과하기 위해 설계되었습니다. HFT 사용이 허용되지 않는 도전/펀드 계정/실제 계정에서는 사용하지 마세요. 스마트 펀드 HFT EA가 돋보이는 이유: 도전 마스터리: 거의 모든 HFT 도전에서 수백 번의 도전을 성공적으로 완료하여 100%의 성공률을 확보했습니다. 단순한 도구가 아니라 검증된 파워하우스입니다. 최고의 간편함: 복잡한 설정이나 VPS 설정에 빠져들 필요 없습니다. 로드하고, 로트 크기를 조정한 다음 실행 버튼을 누르기만 하면 됩니다 - 최고의 간편함입니다.
                      ShinZuka
                      Muhammad Asyraf Bin Mohamad
                      Using MACD value for direction. Using RSI as reversal indicator. Using open trading hour. (Recommend Hour 10,11,15 & 19 : MT4-Time) Counter trade if signal failed. Cutloss trade if signal failed. Auto lot calculate based on target profit & takeprofit. Able to set counter trade value. Suitable for commodities & currency.  Timeframe H1. Able to set limit lot open. Able to select day to trade.
                      H4 GBPUSD Trend Scalper is a trend signal scalper The EA trades according to the trend strategy using original built-in indicator for opening and closing orders. The external inputs for limiting trading on Fridays and Mondays are available. The purpose of the strategy is to use the current trend with the most benefit. According to the results of testing and working on demo and real accounts, the best results achieved by using the Н4 timeframe on the GBP/USD pair Works on MetaTrader 4 Build 971+
                      PZ Goldfinch Scalper EA
                      PZ TRADING SLU
                      1 (5)
                      This is the latest iteration of my famous scalper, Goldfinch EA, published for the first time almost a decade ago. It scalps the market on sudden volatility expansions that take place in short periods of time: it assumes and tries to capitalize of inertia in price movement after a sudden price acceleration. This new version has been simplified to allow the trader use the optimization feature of the tester easily to find the best trading parameters. [ Installation Guide | Update Guide | Troublesh
                      Forex Trend Detector
                      Lachezar Krastev
                      5 (5)
                      SPECIAL BIG DISCOUNT ->> Buy Forex Trend Detector with -60% OFF! NOTE: Promo price: $197 (Regular Price: $497) - The offer ends soon! For Settings, Instructions and LIVE Results Click Here! Forex Trend Detector is an automated trading strategy which is developed to follow the money… or "follow the market impulse" resulting in reliable and consistent performance. I built Forex Trend Detector on a trading strategy that works!  I didn't use exotic or speculative techniques – instead i examined th
                      Super Reversal Pattern
                      Parfait Mujinga Ndalika
                      Super Reversal Pattern Indicator Unlock the power of advanced pattern recognition with our Super Reversal Pattern Indicator. Designed for traders seeking precision and reliability, this indicator identifies one of the most effective reversal patterns in technical analysis, offering a significant edge in your trading strategy. Key Features: Non-Repainting Accuracy: Enjoy the confidence of non-repainting technology. Once a Super Reversal Pattern is detected, it remains static, providing consiste
                      Vizzion
                      Joel Protusada
                      Vizzion is a fully automated scalping Expert Advisor that can be run successfully using GBPJPY currency pair at H1 timeframe. Very Important This Expert Advisor can not run with any EAs in the same account. As part of the money management plan, it calculates and monitors the Margin Level % and assumes that all open trades are created by it. If you want an Expert Advisor that trades in a daily basis, this EA is not for you because using this requires a patience to wait for a few days or weeks on
                      This Expert Advisor trades based on trend lines, as well as on the basis of volume analysis. Volumes are calculated using minute bars, in order to determine if they were ascending or descending. The trend lines are drawn based on High and Lows in the trade history. There are also additional indicators. Buy or sell signals depend on all those factors. This allows the EA to enter the market with more accuracy and to perform more deals. Input parameters Lots - lot size (if 0, a lot is calculated b
                      Trend Oscillator mw
                      DMITRII GRIDASOV
                      Trend Oscillator - 고급 맞춤형 Crypto_Forex 지표, 효율적인 거래 도구입니다! - 고급 새로운 계산 방법 사용 - 매개변수 "계산 가격"에 대한 20가지 옵션. - 지금까지 개발된 가장 매끄러운 오실레이터. - 상승 추세는 녹색, 하락 추세는 빨간색. - 과매도 값: 5 미만, 과매도 값: 95 이상. - 이 지표로 표준 전략도 업그레이드할 수 있는 기회가 많습니다. - PC 및 모바일 알림. ................................................................................................................................................ // 뛰어난 트레이딩 로봇과 지표는 여기에서 확인할 수 있습니다: https://www.mql5.com/en/users/def1380/seller 이 MQL5 웹사이트에서만 제공되는 오리지널 제품입니다.
                      The Moving Average Convergence Divergence (MACD) is a popular technical analysis tool used by traders and analysts to identify trends and potential buy or sell signals in a financial instrument, such as a stock, currency pair, or commodity. It's essentially a combination of two moving averages, often referred to as the "fast" and "slow" moving averages. Here's how the MACD is calculated: Fast Moving Average (12-period EMA): This is a 12-period Exponential Moving Average (EMA) of the asset's pric
                      Diamond Trend
                      Segundo Calvo Munoz
                      Indicator which identifies Trend and also buy/sell opportunities. Use for entries aligned to the Trend.  Although Diamond Trend is very accurate identifying entry points, it is always recommended to use a support indicator in order to reconfirm the operation. Remind to look for those Assets and Timeframes which best fit to your trader behavior/need... Valid for Scalping and Long Term operations. Please, set up a Bars Chart to be able to visualize the indicator properly...  ...And remind to give
                      Infinity Trend Pro
                      Yaroslav Varankin
                      1 (1)
                      This is a trend indicator without redrawing Developed instead of the binary options strategy (by the color of the Martingale candlestick) Also works well in forex trading When to open trades (binary options) A signal will appear in the place with a candle signaling the current candle It is recommended to open a deal for one candle of the current timeframe M1 and M5 When a blue dot appears, open a deal up When a red dot appears, open a trade down. How to open trades on Forex. When a signal is rec
                      PipFinite EA Breakout EDGE
                      Karlo Wilson Vendiola
                      5 (4)
                      The Official Automated Version of the Reliable Indicator PipFinite Breakout EDGE EA Breakout EDGE takes the signal of PipFinite Breakout EDGE indicator and manages the trade for you. Because of numerous financial instruments to consider, many traders want the signals to be fully automated. The EA will make sure all your trades are executed from entry to exit. Saving you time and effort while maximizing your profits. The Edge of Automation Effortless price action trading is now possible acros
                      Alpha Trend
                      Evgeny Belyaev
                      3.33 (3)
                      Alpha Trend is a trend indicator for the MetaTrader 4 platform; it has been developed by a group of professional traders. The Alpha Trend indicator finds the most probable tendency reversal points, which allows making trades at the very beginning of a trend. This indicator features notifications, which are generated whenever a new signal appears (alert, email, push-notification). This allows you to open a position in a timely manner. Alpha Trend does not redraw, which makes it possible to evalua
                      Trendiness Index
                      Libertas LLC
                      5 (3)
                      "The trend is your friend" is one of the best known sayings in investing, because capturing large trendy price movements can be extremely profitable. However, trading with the trend is often easier said than done, because many indicators are based on price reversals not trends. These aren't very effective at identifying trendy periods, or predicting whether trends will continue. We developed the Trendiness Index to help address this problem by indicating the strength and direction of price trend
                      Indicador Taurus All4
                      Fabio Oliveira Magalhaes
                      Taurus All4 Taurus All4 is a high-performance indicator, it will tell you the strength of the trend, and you will be able to observe the strength of the candle. Our indicator has more than 4 trend confirmations. It is very simple and easy to use. Confirmation Modes Candle Trend Confirmations: When the candle switches to light green the trend is high. When the candle switches to light red the trend is reverting down. When the candle changes to dark red the trend is low. Trendline Trend Confirm
                      이 제품의 구매자들이 또한 구매함
                      Gann Made Easy
                      Oleg Rodin
                      4.8 (117)
                      Gann Made Easy 는 mr.의 이론을 사용하여 최고의 거래 원칙을 기반으로 하는 전문적이고 사용하기 쉬운 Forex 거래 시스템입니다. W.D. 간. 이 표시기는 Stop Loss 및 Take Profit Levels를 포함하여 정확한 BUY 및 SELL 신호를 제공합니다. PUSH 알림을 사용하여 이동 중에도 거래할 수 있습니다. 구매 후 연락주세요! 내 거래 팁과 훌륭한 보너스 지표를 무료로 공유하겠습니다! 아마도 Gann 거래 방법에 대해 이미 여러 번 들었을 것입니다. 일반적으로 Gann의 이론은 초보자 거래자뿐만 아니라 이미 거래 경험이 있는 사람들에게도 매우 복잡한 것입니다. Gann의 거래 방식은 이론적으로 적용하기 쉽지 않기 때문입니다. 나는 그 지식을 연마하고 Forex 지표에 최고의 원칙을 적용하기 위해 몇 년을 보냈습니다. 표시기는 적용하기가 매우 쉽습니다. 차트에 첨부하고 간단한 거래 권장 사항을 따르기만 하면 됩니다. 지표는 지속적으로 시장 분석 작업
                      현재 20% 할인 ! 초보자 또는 전문가 트레이더를 위한 최고의 솔루션! 이 대시보드 소프트웨어는 28개의 통화 쌍에서 작동합니다. 2가지 주요 지표(Advanced Currency Strength 28 및 Advanced Currency Impulse)를 기반으로 합니다. 전체 Forex 시장에 대한 훌륭한 개요를 제공합니다. 고급 통화 강도 값, 통화 이동 속도 및 모든(9) 시간대의 28 Forex 쌍에 대한 신호를 보여줍니다. 추세 및/또는 스캘핑 기회를 정확히 파악하기 위해 차트의 단일 지표를 사용하여 전체 시장을 볼 수 있을 때 거래가 어떻게 개선될지 상상해 보십시오! 잠재적인 거래를 식별하고 확인하면서 강력한 통화와 약한 통화를 더욱 쉽게 식별할 수 있도록 이 지표에 기능을 내장했습니다. 이 표시기는 통화의 강세 또는 약세가 증가 또는 감소하는지 여부와 모든 시간대에서 수행되는 방식을 그래픽으로 보여줍니다. 추가된 새로운 기능은 현재 시장 조건 변화에 적응하는
                      Cycle Maestro
                      Stefano Frisetti
                      NOTE: CYCLEMAESTRO is distributed only on this website, there are no other distributors. Demo version is for reference only and is not supported. Full versione is perfectly functional and it is supported CYCLEMAESTRO , the first and only indicator of Cyclic Analysis, useful for giving signals of TRADING, BUY, SELL, STOP LOSS, ADDING. Created on the logic of Serghei Istrati and programmed by Stefano Frisetti ; CYCLEMAESTRO is not an indicator like the others, the challenge was to interpret only t
                      Scalper Inside PRO
                      Alexey Minkov
                      4.76 (63)
                      !SPECIAL SALE! An exclusive indicator that utilizes an innovative algorithm to swiftly and accurately determine the market trend. The indicator automatically calculates opening, closing, and profit levels, providing detailed trading statistics. With these features, you can choose the most appropriate trading instrument for the current market conditions. Additionally, you can easily integrate your own arrow indicators into Scalper Inside Pro to quickly evaluate their statistics and profitability
                      Golden Trend Indicator
                      Noha Mohamed Fathy Younes Badr
                      5 (10)
                      Golden Trend indicator  is The best indicator for predicting trend movement this indicator never lags and never repaints and never back paints    and give  arrow buy and sell    before the candle appear  and it will help you and  will make your trading decisions clearer its work on all currencies and  gold and crypto and all time frame This unique  indicator uses very secret algorithms to catch the  trends, so you can trade using this indicator and see the trend clear on charts  manual guide and
                      Algo Pumping MT4
                      Ihor Otkydach
                      5 (5)
                      PUMPING STATION – 당신만을 위한 올인원(All-in-One) 전략 PUMPING STATION은 당신의 외환 거래를 더욱 흥미롭고 효과적으로 바꿔줄 혁신적인 인디케이터입니다. 단순한 보조 도구가 아니라, 강력한 알고리즘을 갖춘 완전한 거래 시스템으로서 보다 안정적인 트레이딩을 시작할 수 있도록 도와줍니다. 이 제품을 구매하시면 다음의 혜택을   무료로   받으실 수 있습니다: 전용 설정 파일: 자동 설정으로 최대의 퍼포먼스를 제공합니다. 단계별 동영상 가이드: PUMPING STATION 전략으로 거래하는 법을 배워보세요. Pumping Utility: PUMPING STATION과 함께 사용하도록 설계된 반자동 거래 봇으로, 거래를 더욱 쉽고 편리하게 만들어줍니다. ※ 구매 후 바로 저에게 메시지를 보내주세요. 추가 자료에 대한 접근 권한을 제공해드립니다. PUMPING STATION은 어떻게 작동하나요? 트렌드 컨트롤: 시장의 추세 방향을 즉시 파악합니다. 추세는
                      GOLD Impulse with Alert
                      Bernhard Schweigert
                      4.6 (10)
                      이 지표는 Advanced Currency IMPULSE with ALERT  +   Currency Strength Exotics  의 2가지 제품의 슈퍼 조합입니다. 그것은 모든 시간 프레임에 대해 작동하며 8개의 주요 통화와 하나의 기호에 대한 강약의 충동을 그래픽으로 보여줍니다! 이 표시기는 금, 이국적인 쌍, 상품, 지수 또는 선물과 같은 기호에 대한 통화 강도 가속을 표시하는 데 특화되어 있습니다. 금, 은, 오일, DAX, US30, MXN, TRY, CNH 등의 진정한 통화 강도 가속(충동 또는 속도)을 표시하기 위해 9번째 줄에 모든 기호를 추가할 수 있습니다. 새로운 기본 알고리즘을 기반으로 구축되어 잠재적인 거래를 훨씬 더 쉽게 식별하고 확인할 수 있습니다. 이는 통화의 강세 또는 약세가 가속되는지 여부를 그래픽으로 표시하고 가속 속도를 측정하기 때문입니다. 자동차의 속도계처럼 생각하면 됩니다. 가속화할 때 Forex 시장에서 동일한 일이 분명히 더 빠르
                      Easy Breakout
                      Mohamed Hassan
                      5 (11)
                      After your purchase, feel free to contact me for more details on how to receive a bonus indicator called VFI, which pairs perfectly with Easy Breakout for enhanced confluence!   Easy Breakout is a powerful price action trading system built on one of the most popular and widely trusted strategies among traders: the Breakout strategy ! This indicator delivers crystal-clear Buy and Sell signals based on breakouts from key support and resistance zones. Unlike typical breakout indicators, it levera
                      Enigmera
                      Ivan Stefanov
                      5 (7)
                      ENIGMERA: 시장의 핵심 중요: MQL5.com의 데모는 Strategy Tester에서 실행되며 Enigmera의 기능을 완전히 반영하지 못할 수 있습니다. 설명, 스크린샷 및 비디오를 확인하여 자세한 내용을 확인하십시오. 질문이 있으면 언제든지 메시지를 보내주세요! 인디케이터의 코드는 완전히 다시 작성되었습니다. 버전 3.0은 새로운 기능을 추가하고 인디케이터가 처음 출시된 이후 누적된 버그를 수정했습니다. 소개 이 인디케이터 및 거래 시스템은 금융 시장에 대한 주목할 만한 접근 방식입니다. ENIGMERA는 프랙탈 주기를 사용하여 정확하게 지원 및 저항 수준을 계산합니다. 실제 축적 단계를 보여주고 방향과 목표를 제공합니다. 트렌드와 수정 모두에서 작동하는 시스템입니다. 작동 방식 인디케이터의 대부분의 기능은 차트 왼쪽에 있는 버튼을 통해 제어되며, 이를 통해 다양한 시장 상황에 빠르게 대응할 수 있습니다. 버튼 ON/OFF – 인디케이터 전체를 표시하거나 숨깁니다.
                      PZ Harmonacci Patterns
                      PZ TRADING SLU
                      3.17 (6)
                      Trade smarter, not harder: Empower your trading with Harmonacci Patterns This is arguably the most complete harmonic price formation auto-recognition indicator you can find for the MetaTrader Platform. It detects 19 different patterns, takes fibonacci projections as seriously as you do, displays the Potential Reversal Zone (PRZ) and finds suitable stop-loss and take-profit levels. [ Installation Guide | Update Guide | Troubleshooting | FAQ | All Products ] It detects 19 different harmonic pric
                      TPSproTREND PrO
                      Roman Podpora
                      4.68 (25)
                      VERSION MT5        —        ИНСТРУКЦИЯ RUS           —        INSTRUCTIONS  ENG 주요 기능: 렌더링 없이 정확한 입력 신호! 신호가 나타나면 관련성은 유지됩니다! 이는 신호를 제공한 후 변경하여 예금 자금 손실을 초래할 수 있는 다시 그리기 지표와의 중요한 차이점입니다. 이제 더 큰 확률과 정확도로 시장에 진입할 수 있습니다. 화살표가 나타난 후 목표에 도달(이익실현)하거나 반전 신호가 나타날 때까지 캔들을 색칠하는 기능도 있습니다. STOP LOSS / TAKE PROFIT 구역 표시 진입점 검색 시 시각적 명확성을 높이기 위해 시장 진입을 위한 최적 지점이 검색되는 BUY/SELL 영역을 초기에 표시하는 모듈을 만들었습니다. 정지 손실 수준 작업을 위한 추가 지능형 논리는 시간이 지남에 따라 크기를 줄이는 데 도움이 되므로 거래에 들어갈 때 초기 위험을 줄이는 데 도움이 됩니다(move sl). 더 높은 기간의 MI
                      Dynamic Forex28 Navigator
                      Bernhard Schweigert
                      5 (5)
                      Dynamic Forex28 Navigator - 차세대 외환 거래 도구. 현재 49% 할인. Dynamic Forex28 Navigator는 오랫동안 인기 있는 지표의 진화형으로, 세 가지의 힘을 하나로 결합했습니다. 고급 통화 Strength28 지표(695개 리뷰) + 고급 통화 IMPULSE with ALERT(520개 리뷰) + CS28 콤보 신호(보너스). 지표에 대한 자세한 정보 https://www.mql5.com/en/blogs/post/758844 차세대 Strength 지표는 무엇을 제공합니까?  원래 지표에서 좋아했던 모든 것이 새로운 기능과 더 높은 정확도로 강화되었습니다. 주요 기능: 독점적인 통화 Strength 공식.  모든 시간대에 걸쳐 부드럽고 정확한 강도선. 추세와 정확한 진입을 식별하는 데 이상적입니다. 역동적인 시장 피보나치 수준(시장 피보나치).  이 지표에만 있는 고유한 기능. 가격 차트가 아닌 통화 강도에 피보나치가 적용됩니다.
                      RelicusRoad Pro
                      Relicus LLC
                      4.63 (104)
                      이제 $ 147 (몇 가지 업데이트 후 $ 499 증가) - 무제한 계정 (PCS 또는 MACS) RelicusRoad 사용 설명서 + 교육 비디오 + 비공개 Discord 그룹 액세스 + VIP 상태 시장을 보는 새로운 방법 RelicusRoad는 외환, 선물, 암호화폐, 주식 및 지수에 대한 세계에서 가장 강력한 거래 지표로서 거래자에게 수익성을 유지하는 데 필요한 모든 정보와 도구를 제공합니다. 우리는 초보자부터 고급까지 모든 거래자가 성공할 수 있도록 기술적 분석 및 거래 계획을 제공합니다. 미래 시장을 예측할 수 있는 충분한 정보를 제공하는 핵심 거래 지표입니다. 우리는 차트에서 말이 안 되는 여러 지표 대신 완전한 솔루션을 믿습니다. 타의 추종을 불허하는 매우 정확한 신호, 화살표 + 가격 조치 정보를 표시하는 올인원 표시기입니다. 강력한 AI를 기반으로 하는 RelicusRoad는 누락된 정보와 도구를 제공하여 교육하고 성공적인 트레이더인 트레이딩 전문가가 되도
                      Advanced Supply Demand
                      Bernhard Schweigert
                      4.91 (294)
                      현재 33% 할인! 초보자나 전문 트레이더를 위한 최고의 솔루션! 이 보조지표는 우리가 다수의 독창적 기능과 새로운 공식을 통합한 독특하고 고품질이며 저렴한 거래 도구입니다. 이 업데이트를 통해 이중 시간대를 표시할 수 있습니다. 더 높은 TF를 표시할 수 있을 뿐만 아니라 차트 TF와 더 높은 TF 모두를 표시할 수 있습니다: 중첩 영역 표시. 모든 Supply Demand 트레이더들이 좋아할 것입니다. :) 중요한 정보 공개 Advanced Supply Demand의 잠재력을 극대화하려면 다음을 방문하십시오. https://www.mql5.com/ko/blogs/post/720245   진입 또는 목표의 명확한 트리거 포인트를 정확히 찾아냄으로 해서 거래가 어떻게 개선될지 상상해 보십시오. 새로운 알고리즘을 기반으로 매수자와 매도자 간의 잠재적인 불균형을 훨씬 더 쉽게 분간할 수 있습니다. 왜냐하면 가장 강한 공급영역과 가장 강한 수요 영역과 과거에 어떻게 진행 되었는지를(이전
                      Volatility Trend System - a trading system that gives signals for entries. The volatility system gives linear and point signals in the direction of the trend, as well as signals to exit it, without redrawing and delays. The trend indicator monitors the direction of the medium-term trend, shows the direction and its change. The signal indicator is based on changes in volatility and shows market entries. The indicator is equipped with several types of alerts. Can be applied to various trading ins
                      Scalper Vault
                      Oleg Rodin
                      5 (29)
                      Scalper Vault 는 성공적인 스캘핑에 필요한 모든 것을 제공하는 전문 스캘핑 시스템입니다. 이 표시기는 외환 및 바이너리 옵션 거래자가 사용할 수 있는 완전한 거래 시스템입니다. 권장 시간 프레임은 M5입니다. 시스템은 추세 방향으로 정확한 화살표 신호를 제공합니다. 또한 상단 및 하단 신호와 Gann 시장 수준을 제공합니다.  이 시스템은 사용하기가 매우 쉽습니다. 원하는 시장 지역의 화살표만 따라가면 됩니다. 엑시트는 가격이 적정 수준에 도달하거나 시장의 고점 또는 저점 신호가 나타날 때 수행됩니다.  표시기는 PUSH 알림을 포함한 모든 유형의 경고를 제공합니다. 인디케이터 구매 후 연락주세요. 내 개인 거래 권장 사항과 훌륭한 보너스 지표를 무료로 공유합니다! 나는 당신에게 행복하고 유익한 거래를 기원합니다!
                      KT Renko Patterns MT4
                      KEENBASE SOFTWARE SOLUTIONS
                      2.33 (3)
                      KT Renko Patterns는 렌코 차트를 벽돌 하나하나 분석하여, 전 세계 다양한 금융 시장에서 트레이더들이 자주 사용하는 유명한 차트 패턴들을 찾아냅니다. 시간 기반 차트와 비교하면, 렌코 차트는 시각적으로 단순하고 깔끔하여 패턴 중심의 트레이딩이 훨씬 쉽게 가능합니다. KT Renko Patterns에는 다양한 렌코 패턴이 포함되어 있으며, 이 중 상당수는 Prashant Shah의 저서 『Profitable Trading with Renko Charts』에서 자세히 설명되어 있습니다. KT Renko Patterns 인디케이터를 기반으로 한 100% 자동화된 EA는 여기에서 이용할 수 있습니다 - KT Renko Patterns EA . 기능 소개 최대 8개의 명확한 렌코 패턴을 거래할 수 있어, 혼동 없이 신뢰도 높은 트레이딩이 가능합니다. 객관성을 제공하기 위해 각 패턴에는 손절선과 피보나치 목표가 함께 제공됩니다. KT Renko Patterns는 각 패턴의 정
                      Chart Patterns All in One
                      Davit Beridze
                      4.68 (19)
                      "Chart Patterns All in One"을 데모 모드에서 사용해보고 보너스를 받아보세요. 데모 모드에서 사용해본 후 메시지를 보내주시면 보너스를 드립니다. 구매 후 댓글을 남기시면 고품질의 인디케이터 8개를 보너스로 받으실 수 있습니다. Chart Patterns All-in-One 지표는 트레이더가 기술 분석에서 흔히 사용되는 다양한 차트 패턴을 시각화하는 데 도움을 줍니다. 이 지표는 잠재적인 시장 움직임을 식별하는 데 도움이 되지만, 수익성을 보장하지는 않습니다. 구매 전에 데모 모드에서 지표를 테스트하는 것이 좋습니다. 현재 할인 : "Chart Patterns All in One" 지표 50% 할인 중. 포함된 패턴 : 1-2-3 패턴 : 세 가지 주요 지점(고점 또는 저점)을 사용하여 시장 반전을 감지합니다. 매수 : 연속된 두 저점 이후, 이전 고점보다 낮은 고점이 발생할 때. 매도 : 연속된 두 고점 이후, 이전 저점보다 높은 저점이 발생할 때. 시각화 :
                      Quantum Breakout Indicator PRO
                      Bogdan Ion Puscasu
                      4.96 (26)
                      소개       Quantum Breakout PRO   , 브레이크아웃 존 거래 방식을 변화시키는 획기적인 MQL5 지표! 13년 이상의 거래 경험을 가진 숙련된 트레이더 팀이 개발한   Quantum Breakout PRO는   혁신적이고 역동적인 브레이크아웃 영역 전략으로 거래 여정을 새로운 차원으로 끌어올리도록 설계되었습니다. Quantum Breakout Indicator는 5개의 이익 목표 영역이 있는 브레이크아웃 영역의 신호 화살표와 브레이크아웃 상자를 기반으로 한 손절 제안을 제공합니다. 초보자 거래자와 전문 거래자 모두에게 적합합니다. Quantum EA 채널:       여기를 클릭하세요 MT5 버전 :   여기를 클릭하세요 중요한! 구매 후 설치 매뉴얼을 받으려면 개인 메시지를 보내주십시오. 추천: 기간: M15 통화쌍: GBPJPY, EURJPY, USDJPY,NZDUSD, XAUUSD 계정 유형: 스프레드가 매우 낮은 ECN, Raw 또는 Razo
                      MTF Supply Demand Zones
                      Georgios Kalomoiropoulos
                      4.82 (22)
                      자동화된 수요 및 공급 구역의 차세대. 모든 차트에서 작동하는 새롭고 혁신적인 알고리즘. 모든 구역은 시장의 가격 움직임에 따라 동적으로 생성됩니다. 두 가지 유형의 경고 --> 1)가격이 영역에 도달할 때 2)새로운 영역이 형성될 때 당신은 더 이상 쓸모없는 지표를 얻을 수 없습니다. 입증된 결과로 완벽한 거래 전략을 얻을 수 있습니다.     새로운 기능:     가격이 공급/수요 영역에 도달하면 경고     새로운 공급/수요 구역이 생성되면 알림     푸시 알림 알림     핍의 영역 너비 레이블     기동특무부대에 한 번 더 시간이 주어집니다. 따라서 현재보다 위의 2개의 시간 프레임 대신 현재보다 높은 3개의 시간 프레임을 볼 수 있습니다.     Alerts/Zones/MTF 기능을 활성화/비활성화하는 버튼 당신이 얻는 이점:     거래에서 감정을 제거하십시오.     거래 항목을 객관화하십시오.     높은 확률 설정을 사용하여 수익
                      캔들의 종가를 예측하는 지표입니다. 지표는 주로 D1 차트에서 사용하기 위한 것이. 이 지표는 전통적인 외환 거래와 바이너리 옵션 거래 모두에 적합합니다. 지표는 독립형 거래 시스템으로 사용하거나 기존 거래 시스템에 추가로 사용할 수 있습니다. 이 표시기는 현재 양초를 분석하여 양초 본체 내부의 특정 강도 요인과 이전 양초의 매개변수를 계산합니다. 따라서 지표는 시장 움직임의 추가 방향과 현재 양초의 종가를 예측합니다. 이 방법 덕분에 지표는 단기 및 중장기 거래 모두에 적합합니다. 지표를 사용하면 시장 상황을 분석하는 동안 지표가 생성할 잠재적 신호의 수를 설정할 수 있습니다. 표시기 설정에는 이를 위한 특별한 매개변수가 있습니다. 또한 인디케이터는 새로운 신호에 대해 차트의 메시지 형태, 이메일 및 PUSH 알림 형태로 알릴 수 있습니다. 구매 후 저에게 꼭 써주세요! 나는 당신에게 지표와 거래에 대한 나의 추천을 줄 것입니다! 또한 보너스를 받으세요!
                      FX Volume
                      Daniel Stein
                      4.6 (35)
                      FX Volume: 브로커 시각에서 바라보는 진짜 시장 심리 간단 요약 트레이딩 접근 방식을 한층 더 향상시키고 싶으신가요? FX Volume 는 소매 트레이더와 브로커의 포지션을 실시간으로 파악할 수 있게 해 줍니다. 이는 COT 같은 지연된 보고서보다 훨씬 빠릅니다. 꾸준한 수익을 추구하는 분이든, 시장에서 더 깊은 우위를 원하시는 분이든, FX Volume 을 통해 대규모 불균형을 찾아내고, 돌파 여부를 확인하며 리스크 관리를 정교화할 수 있습니다. 지금 시작해 보세요! 실제 거래량 데이터가 의사결정을 어떻게 혁신할 수 있는지 직접 경험해 보시기 바랍니다. 1. 트레이더에게 FX Volume이 매우 유익한 이유 탁월한 정확도를 지닌 조기 경보 신호 • 다른 사람들보다 훨씬 앞서, 각 통화쌍을 매수·매도하는 트레이더 수를 거의 실시간으로 파악할 수 있습니다. • FX Volume 은 여러 리테일 브로커에서 추출한 실제 거래량 데이터를 종합해 명확하고 편리한 형태로 제공하는
                      Currency Strength Exotics
                      Bernhard Schweigert
                      4.87 (31)
                      현재 20% 할인! 초보자 또는 전문가 트레이더를 위한 최고의 솔루션! 이 표시기는 Exotic Pairs Commodities, Indexes 또는 Futures와 같은 기호에 대한 통화 강도를 표시하는 데 특화되어 있습니다. 금, 은, 석유, DAX, US30, MXN, TRY, CNH 등의 진정한 통화 강도를 보여주기 위해 9번째 줄에 모든 기호를 추가할 수 있습니다. 이것은 독특하고 고품질이며 저렴한 거래 도구입니다. 우리는 많은 독점 기능과 새로운 공식을 통합했습니다. 새로운 추세 또는 스캘핑 기회의 정확한 트리거 포인트를 정확히 찾아낼 수 있기 때문에 거래가 어떻게 개선될지 상상해 보십시오. 사용 설명서: 여기를 클릭 https://www.mql5.com/en/blogs/post/708876 모든 시간대에 작동합니다. TREND를 빠르게 확인할 수 있습니다! 새로운 기본 알고리즘을 기반으로 설계되어 잠재적인 거래를 더욱 쉽게 식별하고 확인할 수 있습니다. 8개의
                      Matrix Arrow Indicator MT4
                      Juvenille Emperor Limited
                      5 (3)
                      매트릭스 화살표 표시기 MT4 는 외환, 상품, 암호 화폐, 지수, 주식과 같은 모든 기호/도구에 사용할 수 있는 100% 다시 칠하지 않는 다중 기간 표시기를 따르는 고유한 10 in 1 추세입니다.  Matrix Arrow Indicator MT4 는 다음과 같은 최대 10개의 표준 지표에서 정보와 데이터를 수집하여 초기 단계에서 현재 추세를 결정합니다. 평균 방향 이동 지수(ADX) 상품 채널 지수(CCI) 클래식 하이켄 아시 캔들 이동 평균 이동 평균 수렴 발산(MACD) 상대 활력 지수(RVI) 상대 강도 지수(RSI) 포물선 SAR 스토캐스틱 오실레이터 윌리엄스의 백분율 범위 모든 지표가 유효한 매수 또는 매도 신호를 제공하면 강력한 상승/하락 추세를 나타내는 다음 캔들/막대가 시작될 때 해당 화살표가 차트에 인쇄됩니다. 사용자는 사용할 표시기를 선택하고 각 표시기의 매개변수를 개별적으로 조정할 수 있습니다. 매트릭스 화살표 표시기 MT4는 선택한 표시기에서만 정보를 수
                      Blahtech Supply Demand
                      Blahtech Limited
                      4.58 (36)
                      Was: $299  Now: $149   Supply Demand uses previous price action to identify potential imbalances between buyers and sellers. The key is to identify the better odds zones, not just the untouched ones. Blahtech Supply Demand indicator delivers functionality previously unavailable on any trading platform. This 4-in-1 indicator not only highlights the higher probability zones using a multi-criteria strength engine, but also combines it with multi-timeframe trend analysis, previously confirmed swings
                      Hydra Trend Rider
                      INTRAQUOTES
                      5 (2)
                      Hydra Trend Rider is a non-repainting, multi-timeframe trend indicator that delivers precise buy/sell signals and real-time alerts for high-probability trade setups. With its color-coded trend line, customizable dashboard, and mobile notifications, it's perfect for traders seeking clarity, confidence, and consistency in trend trading. Download the Metatrader 5 Version Message us here after purchase to get the Indicator Manual. Download Now! Offer valid only for next 10 Buyers. Price will increas
                      Smart Set up Levels
                      Mohit Dhariwal
                      5 (1)
                      Smart Set up leve l is a very powerful indicator based on the concept of order blocks and set up entries with proper fvg and breakouts to make a very nice level to enter like a pro trader. Very easy to use interface and friendly to enter on buy and sell signals. Works Best on M15 Time frame on Gold, Bitcoin and Fx pairs. Daily 4-5 trades on each pair  Works great on gold like a pro on M15 It is non repainting nor lagging It is very powerful indicator giving precise entries and prop acts can be c
                      Automated Trendlines
                      Georgios Kalomoiropoulos
                      5 (16)
                      추세선은 외환 거래에서 기술적 분석의 가장 필수적인 도구입니다. 불행히도, 대부분의 거래자는 올바르게 그리지 않습니다. 자동 추세선 표시기는 시장의 추세 움직임을 시각화하는 데 도움이 되는 진지한 거래자를 위한 전문 도구입니다. 추세선 강세 추세선과 약세 추세선에는 두 가지 유형이 있습니다. 상승 추세에서 Forex 추세선은 가격 움직임의 가장 낮은 스윙 포인트를 통해 그려집니다. 최소 두 개의 "최저 저점"을 연결하면 추세선이 생성됩니다. 하락 추세에서 추세선은 가격 움직임의 가장 높은 스윙 포인트를 통해 그려집니다. 최소 두 개의 "최고 최고점"을 연결하면 추세선이 생성됩니다. 추세선이 깨질 때? 강세 추세선은 약세 양초가 강세 추세선 아래에서 닫히고 양초의 고점이 추세선 위에 있을 때 깨집니다. 약세 추세선은 강세 양초가 약세 추세선 위로 마감되고 양초 저점이 추세선 아래에 있을 때 깨집니다. 추세선이 삭제되면? 강세 추세선은 전체 양초가 강세 추세선 아래에
                      Grabber System MT4
                      Ihor Otkydach
                      3 (2)
                      탁월한 기술적 지표인 Grabber를 소개합니다. 이 도구는 즉시 사용 가능한 “올인원(All-Inclusive)” 트레이딩 전략으로 작동합니다. 하나의 코드 안에 강력한 시장 기술 분석 도구, 매매 신호(화살표), 알림 기능, 푸시 알림이 통합되어 있습니다. 이 인디케이터를 구매하신 모든 분들께는 다음의 항목이   무료로   제공됩니다: Grabber 유틸리티: 오픈 포지션을 자동으로 관리하는 도구 단계별 영상 매뉴얼: 설치, 설정, 그리고 실제 거래 방법을 안내 맞춤형 세트 파일: 인디케이터를 빠르게 자동 설정하여 최고의 성과를 낼 수 있도록 도와줍니다 다른 전략은 이제 잊어버리세요! Grabber만이 여러분을 새로운 트레이딩의 정점으로 이끌어 줄 수 있습니다. Grabber 전략의 주요 특징: 거래 시간 프레임: M5부터 H4까지 거래 가능한 자산: 어떤 자산이든 사용 가능하지만, 제가 직접 테스트한 종목들을 추천드립니다 (GBPUSD, GBPCAD, GBPCHF, AUDCAD
                      Gold Venamax MT4
                      Sergei Linskii
                      2 (1)
                      Gold Venamax   - 이것은 최고의 주식 기술 지표입니다. 지표 알고리즘은 자산의 가격 변동을 분석하고 변동성과 잠재적 진입 영역을 반영합니다.   표시기 기능: 이것은 편안하고 수익성 있는 거래를 위한 매직과 두 개의 추세 화살표 블록을 갖춘 슈퍼 지표입니다. 블록 전환을 위한 빨간색 버튼이 차트에 표시됩니다. 매직은 표시기 설정에서 설정되므로 서로 다른 블록을 표시하는 두 개의 차트에 표시기를 설치할 수 있습니다. Gold Venamax는 서로 다른 화살표 버퍼(GV 및 SD)를 사용하여 두 개의 차트에 배치할 수 있습니다. 이렇게 하려면 설정에서 다른 Magic을 선택해야 합니다. 예를 들어 하나는 Magic = 999이고 다른 하나는 Magic = 666입니다. 다음으로 차트의 빨간색 버튼으로 화살표 버퍼를 선택할 수 있습니다. 지표 설정의 각 화살표 버퍼(GV 및 SD)에는 편안하고 수익성 있는 거래를 위한 별도의 화살표 필터가 있습니다(UseFiltrGV = t
                      제작자의 제품 더 보기
                      Berma Bands
                      Muhammad Elbermawi
                      5 (3)
                      Berma Bands(BBs) 지표는 시장 동향을 파악하고 이를 활용하려는 트레이더에게 귀중한 도구입니다. 가격과 BBs 간의 관계를 분석함으로써 트레이더는 시장이 추세 단계인지 범위 단계인지를 분별할 수 있습니다. 자세한 내용을 알아보려면 [ Berma Home Blog ]를 방문하세요. 버마 밴드는 세 개의 뚜렷한 선으로 구성되어 있습니다. 어퍼 버마 밴드, 미들 버마 밴드, 로어 버마 밴드입니다. 이 선들은 가격 주위에 그려져 전체 추세에 대한 가격 움직임을 시각적으로 표현합니다. 이 밴드들 사이의 거리는 변동성과 잠재적인 추세 반전에 대한 통찰력을 제공할 수 있습니다. 버마 밴드 라인이 각각에서 분리될 때, 그것은 종종 시장이 횡보 또는 범위 이동 기간에 접어들고 있음을 시사합니다. 이는 명확한 방향 편향이 없음을 나타냅니다. 트레이더는 이러한 기간 동안 추세를 파악하기 어려울 수 있으며 더 명확한 추세가 나타날 때까지 기다릴 수 있습니다. 버마 밴드 라인이 단일 라인으로
                      Bermaui Deviation Percent
                      Muhammad Elbermawi
                      4.94 (111)
                      또는 ( BD% )는 변동성을 포인트가 아닌 백분율로 측정하는 변동성 지수입니다. BD%의 개념은 0에서 100% 사이에서 움직이는 고전 표준 편차(CSD)에 따라 인덱스를 만드는 것입니다. BD%를 사용하여 다른 기간 또는 다른 기간의 동일한 증권에 대한 변동성을 비교할 수 있습니다. 또한 BD%를 사용하여 포인트가 아닌 백분율로 서로 다른 시장의 서로 다른 증권 간의 변동성을 비교할 수 있습니다. "BD%" 사용 방법 BD%가 90% 미만에서 이 수준을 상향 돌파하면 가격이 범위 내에서 움직일 수 있다는 신호입니다. BD%가 90%를 넘어 이 수준을 하향 돌파하고 가격이 이미 단순 이동 평균 위에 있다면 이는 새로운 상승 추세의 시작을 알리는 신호입니다. BD%가 하락세로 갈수록 변동성과 추세 강도가 증가하고 있습니다. BD%가 0%이면 변동성이 가장 높은 값에 있음을 의미합니다. BD%가 90%를 넘어 이 수준을 하향 돌파하고 가격이 이미 단순 이동 평균 아래에 있다면
                      MASR Bands
                      Muhammad Elbermawi
                      5 (5)
                      또는 M oving verage S upport를 R의 esistance 밴드. MASR 밴드 표시기는 지지 및 저항 수준으로 함께 작동하는 두 밴드로 둘러싸인 이동 평균입니다. 통계적으로 MASR 밴드는 시간의 93%에 가격 캔들을 포함합니다. 단계별로 계산하는 방법은 다음과 같습니다. 1. 첫 번째 단계는 X 기간 동안 최고 고가(HHV)와 최저 저가(LLV)를 계산하는 것입니다. 2. 두 번째 단계는 HHV를 LLV로 나누어 그들 사이의 거리가 얼마나 넓은지 백분율로 구하는 것입니다. 나는 이 단계의 결과를 MASR Filter라고 부른다. 3. MASR 필터 = 합계((HHV / LLV)-1) / 막대 수 4. 나는 이동 평균 저항의 지름길인 상위 밴드를 MAR이라고 부릅니다. 저는 이동 평균 지원의 지름길인 하단 밴드 MAS라고 부릅니다. 밴드 사이의 이동 평균을 중앙선이라고 합니다. 5. MAR = MASR 센터 + (75% x MASR 필터 x MASR 센터
                      Bermaui Manual EA
                      Muhammad Elbermawi
                      5 (10)
                      그리드 시스템을 거래하는 반자동 전문 고문입니다. 아이디어는 시장에서 점차적으로 다른 포지션을 취한 다음 손익분기점 수준을 계산하는 것입니다. 가격이 미리 결정된 거리만큼 이 손익분기점을 지나면 모든 열린 주문이 마감됩니다. 중요한 정보 다음은 사용자 가이드입니다.   https://www.mql5.com/en/blogs/post/730567 내 다른 제품과 함께 이 EA를 사용해 볼 수 있습니다. https://www.mql5.com/en/users/bermaui314/seller 중요한 기능 EA는 예상치 못한 결과로부터 거래된 자본을 보호하기 위한 손절매 메커니즘을 가지고 있습니다. EURUSD - XAUUSD - 석유 - 비트코인과 같은 모든 MT4 기호를 거래할 수 있습니다. 모든 MT4 기간을 거래할 수 있습니다. VPS에서 EA를 실행하는 것이 좋습니다. 매개변수 및 기본 설정 1) 자금 관리 설정 시작 로트. 레버리지가 1:400 이상인 경우 기본 설정을 50
                      Bermaui Bands
                      Muhammad Elbermawi
                      4.97 (67)
                      Bermaui Bands(BB)는 범위 및 추세 가격 움직임 사이를 필터링하는 데 도움이 되는 기술 분석 도구입니다. 이 지표의 이면에 있는 아이디어는 다음 단계에서 설명할 수 있습니다. 표준 편차를 0과 100 사이에서 이동하는 오실레이터로 계산합니다. 나는 그것을 Bermaui Deviation 퍼센트(BD %)라고 명명하겠습니다. "BD %"가 0에 가까우면 변동성이 극심합니다. 또한 "BD %"가 100에 가까우면 변동성이 매우 낮습니다. 높은 변동성은 추세 시장에 대한 큰 가능성을 의미하고 낮은 변동성은 횡보 또는 범위 시장을 의미합니다. 중간선은 표준편차가 SMA에 따라 계산되기 때문에 단순 이동 평균(SMA)입니다. Upper Bermaui Band를 얻으려면 계산에서 동일한 수의 막대를 사용하여 단순 이동 평균에 "BD %"를 추가하십시오. The Lower Bermaui Bands를 얻으려면 계산에서 동일한 수의 막대가 있는 단순 이동 평균에서 "BD %"를 빼십시오
                      Bermaui Pin Bars
                      Muhammad Elbermawi
                      5 (13)
                      버마우이 핀 바 또는 (BPB)는 차트에서 핀 바 가격 행동 패턴을 찾는 지표입니다. Pin Bars는 Hammer, Inverted-Hammer, Hanging Man, 슈팅 스타, Dragon Fly Doji 또는 Grave Stone Doji와 같이 높이가 높거나 낮은 그림자와 매우 작은 몸체를 가진 일본 촛대의 대안인 고전적인 바 패턴인 "Pinocchio Bars"의 지름길입니다. . Bermaui Pin Bars 표시기는 다음 단계에서 설명할 수 있는 공식에 따라 이 패턴을 찾습니다. 처음에 BPB는 양초 몸체의 중심을 계산합니다( = [Open + Close] / 2). 그런 다음 BPB는 몸체 중심과 촛불 사이의 거리를 낮게 찾습니다. 마지막 단계는 2단계 결과를 양초 범위로 나누는 것입니다. 양초 본체 중심이 양초의 고점 또는 저점에 너무 가까우면 BPB가 핀 막대 패턴을 감지하고 사용자에게 경고합니다. 버마우이 핀 바 공식 : https://www.mql5.com
                      Bermaui RSI Candles
                      Muhammad Elbermawi
                      5 (4)
                      이 지표의 아이디어는 매수 및 매도 신호를 생성하기 위해 가격 차트와 비교할 수 있는 양초 형태로 RSI를 그리는 것입니다. 지표는 내 발명품이 아닙니다. 나는 몇 년 전에 인터넷에서 그것을 설립했습니다. 코드를 업데이트하고 경고 기능을 추가했으며 Bermaui Utilities 도구 그룹을 추가했습니다. 표시기는 촛대를 그리는 데 사용되는 모든 가격의 RSI(시가, 고가, 저가 및 종가의 RSI)를 계산합니다. RSI 양초 높은 심지를 그리기 위해 가장 높은 값을 사용하고 RSI 양초 낮은 심지를 그리는 데 가장 낮은 값을 사용합니다. RSI 양초의 몸체는 고점과 저점 사이에 있습니다. 시가의 RSI가 종가의 RSI보다 낮으면 RSI 양초가 강세로 간주됩니다. 시가의 RSI가 종가의 RSI보다 높으면 RSI 캔들은 약세로 간주됩니다. 사용 방법 RSI 양초 지표에서 추세선 브레이크아웃을 거래할 수 있으며, 이는 모멘텀이 가격을 앞서기 때문에 가격 차트의 추세를 이끌 것입니다. RS
                      Moving Average Cloud
                      Muhammad Elbermawi
                      4.92 (13)
                      또는 "맥". 이것은 추세를 포착하고 거래하는 데 도움이 되도록 설계된 지표입니다. 이 지표의 이면에 있는 아이디어는 다음 단계에서 설명할 수 있습니다. 빠르게 움직이는 평균 봉투를 그립니다. 느리게 움직이는 평균 봉투를 그립니다. MAC Upper Band는 두 Envelopes의 high 사이의 가장 높은 값입니다. MAC Lower Band는 두 Envelope의 낮은 값 사이의 가장 낮은 값입니다. MAC 히스토그램 클라우드는 방향 변화를 보여주기 위해 두 밴드 사이의 거리를 채웁니다. Blue Cloud는 상승 추세를 나타내고 Red Cloud는 하락 추세를 나타냅니다. MAC 버퍼를 사용하여 자신의 EA 또는 스캐너를 구축하는 방법을 보려면 다음 블로그를 읽으십시오. https://www.mql5.com/en/blogs/post/734293 MAC 사용 방법 MAC 클라우드를 필터로 사용하여 추세 방향을 식별하는 데 도움이 됩니다. 가능한 한 잘못된 신호를 제거
                      Classic Keltner Channel
                      Muhammad Elbermawi
                      4.87 (30)
                      또는 CKC. 이 지표는 Chester W. Keltner(1909–1998)가 설명한 고전적인 10일 이동 평균 규칙에 따라 작동합니다. 모든 매개변수는 기본적으로 Keltner 시스템의 클래식 버전으로 설정되며 사용자가 원하는 경우 변경할 수 있습니다. 중요한 정보 CKC 매뉴얼 읽기: https://www.mql5.com/en/blogs/post/736577 CKC 전문가 고문 예: https://www.mql5.com/en/blogs/post/734150 Keltner 채널 공식 정보 1. 표준가(= (고가 + 저가 + 종가) / 3)에서 단순 이동 평균으로 중심선을 계산합니다. 2. 고가와 저가의 평균 차이인 ADR(Average Daily Range)을 중심선에 대해 동일한 기간 및 계산 방법으로 계산합니다. 3. Keltner 매수 라인 = 센터 라인 + ADR. 4. Keltner 판매 라인 = 센터 라인 – ADR. Keltner 10일 이동 평균 규칙 Kel
                      Bermaui Channel
                      Muhammad Elbermawi
                      5 (19)
                      This is a price channel that shows five important price levels on the chart. Those levels are: 1. The Highest High (HH) of the previous x bars. 2. The Highest Low (HL) of the previous x bars. 3. The Center Line. 4. The Lowest High (LH) of the previous x bars. 5. The Lowest Low (LL) of the previous x bars. How does Bermaui Channels Captures Overbought  area Think of the distance between HH and HL levels as an overbought area. When the price candles or bars crosses the HL to the upside this indica
                      필터:
                      Jimmy Christianus Hendrikus Janssen
                      372
                       

                      This indicator stands out for its simplicity and sophistication. I appreciate how it builds upon existing analytical frameworks with an innovative approach. It offers a promising method for confirming trends objectively by analyzing momentum shifts. I fully endorse its potential.

                      garypang
                      203
                      garypang 2024.12.26 02:59 
                       

                      TDO shows the trend direction. Allow me to trade with confident. Fast response and support from Muhammad Elbermawi. Thank you

                      Muhammad Elbermawi
                      52818
                      개발자의 답변 Muhammad Elbermawi 2024.12.26 08:47
                      That is great 🙏💚 Thanks a lot
                      Yusuf Hamzah
                      746
                      Yusuf Hamzah 2024.09.08 17:12 
                       

                      The indicator is logically simple and elegant. I value an innovative idea that improve on existing analysis framework. It provides a potential for an unbiased trend confirmation (via momentum movement). I vouch for this.

                      sultan10001
                      68
                      sultan10001 2024.06.30 07:24 
                       

                      사용자가 평가에 대한 코멘트를 남기지 않았습니다

                      Muhammad Elbermawi
                      52818
                      개발자의 답변 Muhammad Elbermawi 2024.06.30 07:27
                      That is great 🙏💚 Thanks a lot
                      Gouzief Hanna Kamel Hanna
                      140
                      Gouzief Hanna Kamel Hanna 2024.04.18 17:20 
                       

                      사용자가 평가에 대한 코멘트를 남기지 않았습니다

                      Muhammad Elbermawi
                      52818
                      개발자의 답변 Muhammad Elbermawi 2024.04.18 18:44
                      Thanks a lot for the great review, Joseph 🙏
                      jmhuang
                      3147
                      jmhuang 2024.04.10 23:34 
                       

                      THE SELLER IS ASKING FOR A POSITIVE REVIEW IN EXCHANGE FOR FREE INDICATOR. THERE ARE MANY FAKE REVIEWS. THE TDO TRUE DIRECTION OSCILLATOR IS LAGGARD INDICATOR AND PRODUCES ONE TO TWO SIGNALS A DAY. EVEN THE SIGNALS ARE VERY OFTEN WRONG.DON'T BE MISLED BY THE REVIEWS. BUYER BEWARE. YOUR MONEY WILL BE WASTED

                      Muhammad Elbermawi
                      52818
                      개발자의 답변 Muhammad Elbermawi 2024.04.10 23:44
                      There are 28 majors in Forex ... Two signals on each chart equals 56 opportunities each day ... and you say that is not enough! ... I smell greed here
                      ovno27
                      109
                      ovno27 2024.04.07 09:07 
                       

                      The direction is really true!!!

                      pornchai_p
                      838
                      pornchai_p 2023.06.08 18:37 
                       

                      사용자가 평가에 대한 코멘트를 남기지 않았습니다

                      Shimaa Kamal
                      42
                      Shimaa Kamal 2023.05.26 23:14 
                       

                      This is a great indicator ... Thank you very much

                      gigoro
                      54
                      gigoro 2023.03.21 10:34 
                       

                      the idea of the indicator is good and it contains services that really save a lot of effort& time

                      Solomon Ola
                      247
                      Solomon Ola 2023.03.17 19:20 
                       

                      best indicatot i have ever see i give hit 5ster

                      passyjh
                      271
                      passyjh 2023.02.28 11:43 
                       

                      I think this is good indicator.

                      mostafa gamal
                      43
                      mostafa gamal 2023.02.14 02:15 
                       

                      I DID NOT FIND BAHIROMI STOCHASTIC

                      wuzzy66
                      950
                      wuzzy66 2023.01.13 21:24 
                       

                      BRILLIANT INDICATOR BRILLIANT CONCEPT VERY POWERFUL INDICATOR I WOULD SAY THIS IS MY BEST INDICATOR FOR THREE YEAR JUST FOLLOWING SIMPLE INSTRUCTIONS AND READY TO START MAKING GOOD PIPS STRAIGHT FORWARD TO USE A MONEY BACK GUARANTEE IF I HAD MY WAYTO SAY THAT THIS SIS AN EXCELLENT INDICATOR THE MINUTE ALL ALIGNS EITHER A BLUE OR RED YOU ARE GOOD TO GO I GIVE IT A TEN STAR RATING KEEP UP THE GOOD WORK YOU CAN RENT JUST FOR $10 FOR A MONTH AND YOU WONT BE DISAPPOINTED

                      Muhammad Elbermawi
                      52818
                      개발자의 답변 Muhammad Elbermawi 2023.01.14 02:33
                      Wow, that is an awesome review ... Happy 2023 🙏
                      davevicens
                      321
                      davevicens 2022.12.30 11:43 
                       

                      First operation and first benefit. I love this indicator!!! Happy New Year

                      Muhammad Elbermawi
                      52818
                      개발자의 답변 Muhammad Elbermawi 2022.12.30 13:42
                      Happy new year to you too my friend 🌲 🙏
                      NN
                      794
                      NN 2022.08.25 14:37 
                       

                      Useless! It is lagging and does not help!

                      Jedidiah Benedict
                      174
                      Jedidiah Benedict 2022.08.05 18:31 
                       

                      I really like this indicator.

                      Walid Nazmi
                      106
                      Walid Nazmi 2022.06.22 15:20 
                       

                      Trust me (TDO) is all what you need! Key Advantages : 1) Indicator doesn't flash false signals during a spike or sudden price move. 2) 100% you can rely on the indicator 3) Result from the back test and in real-time is a perfect match. I'm certainly glad i came across the author Mr. Muhammad Elbermawi

                      Muhammad Elbermawi
                      52818
                      개발자의 답변 Muhammad Elbermawi 2022.06.22 15:25
                      Thanks a lot for the great review, Walid 🙏
                      Hamid Niazmand
                      45
                      Hamid Niazmand 2022.06.14 05:37 
                       

                      useless! I don't understand why all the reviews are 5 star while the indicator is just regular ok indicator. 15 min ago in 4 hours chart usd/jpy showing sell signal and I went according to that and 5 min later after I went short the sell signal disappeared I understand trade is based on probabilities but when signal disappeared that is questionable. so do not get fooled by pervious signal it can change easily. if you don't believe it then rent it for month !!!

                      Muhammad Elbermawi
                      52818
                      개발자의 답변 Muhammad Elbermawi 2022.06.14 07:51
                      I can see that you didn't read the manual and so, you don't understand the idea of the indicator.
                      My indicators don't repaint themself as you claim. Thousands of customers tried them without any problems.
                      As I mentioned in the description the "TDO arrows do not repaint or recalculate their results."
                      atarek1978
                      64
                      atarek1978 2022.06.11 22:55 
                       

                      these fake reviews encourage us to buy such a bad indicator If it is a winning tool than the author will not sell it with 60 dollars

                      Muhammad Elbermawi
                      52818
                      개발자의 답변 Muhammad Elbermawi 2022.06.12 12:29
                      I can't figure out what bothers you so much about the True Direction Oscillator reviews.
                      All people here have the freedom to change their reviews whenever they want.
                      I do my best to serve my customers and give them the best value for each dollar they pay.
                      리뷰 답변
                      버전 9.2 2020.05.22
                      In TDO version 9.2 I have enhanced the alert and notifications to work better with the MT4 system tester
                      .
                      Note:
                      I didn't make any changes to TDO's basic formula. It is still the same.
                      I didn't make any changes in indicator parameters or buffers.
                      버전 9.1 2020.02.23
                      Fixed a small bug in the de-initialization function, that used to cause the symbols switch tool not to work properly.
                      .
                      Note:
                      I didn't make any changes on TDO basic formula. It is still the same.
                      I didn't make any changes in indicator parameters or buffers.
                      버전 9.0 2019.12.28
                      1. Enhanced TDO code to be much more faster.
                      2. Decreased indicator buffers from ten to six.
                      3. Deleted Max Candles to Draw parameter, so , the indicator appear on all the chart.
                      4. Added a background to the Martingale Panel.
                      5. Added the option to show channels as shaded area or as lines.
                      6. Enhanced the messages code.
                      7. Enhanced the colors list.

                      Note:
                      I didn't make any changes on TDO basic formula. It is still the same. Changes are for objects and indicator functions like (loops, ifs, for...etc).
                      버전 8.0 2019.10.16
                      What is new in TDO user to version 8.0:

                      1- You can show or hide TDO Panel and Buttons by clicking on Shift + A / D.
                      2- You can switch between four beautiful and well-designed Color Lists. Or you can use your own color list by choosing the (Do Nothing) choice.
                      3- You can send Mobile Notification or emails and if anything gets wrong you will receive a note in the terminal's journal.
                      4- Indicator objects now change their size automatically by depending on screen resolution.
                      5- Made inputs much more user friendly.
                      6- Made a revision to the code to make sure that there are no bugs.
                      버전 7.1 2019.07.18
                      You can now increase/decrease all buttons font size. This new feature is good for:

                      1. Those who use brokers with nonstandard symbols list. (ex: EURUSDecn, GBPUSDecn,...etc).

                      2. Those who want to enlarge their screen resolution through the windows (Customize Sizing Options).

                      I am now releasing version 7.1 and this project have been around MQL5 since 2015. I hope you can find it profitable for you as it was for me.
                      버전 7.0 2019.06.16
                      1. Enhanced TDO calculation method for a better use with iCustom() to build EAs and indicators depending on TDO.
                      2. Organized TDO parameters in a better style.
                      3. Opened the limits for (First TDO Period [Min =1]) parameters. This reduced the number of warning messages for wrong inputs in the previous version.
                      4. Changed the Channels period to 1000. This make TDO channels a very good trend filter.
                      버전 5.0 2018.10.09
                      1. Enhanced TDO calculation method.
                      2. Organized TDO parameters in a better style.
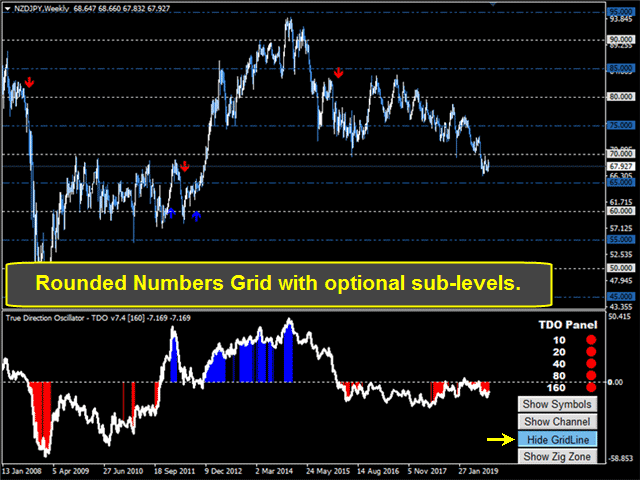
                      3. Enhanced the Round Number Grid calculation method.
                      4. Added sub levels to the Round Number Grid.
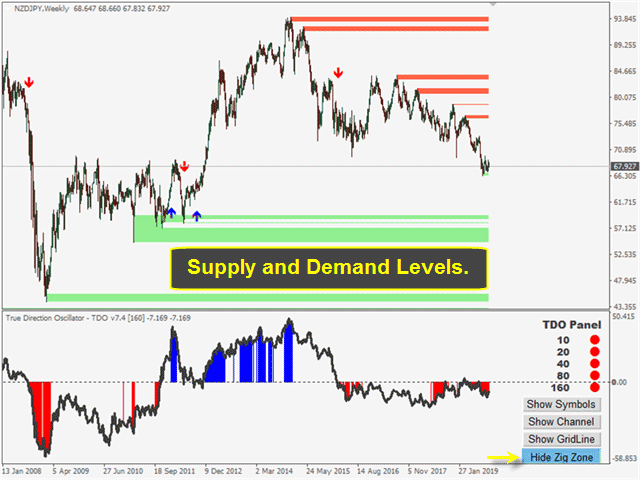
                      5. Added what I call Zig Zone Levels to easily capture support & resistance.
                      버전 4.0 2018.07.23
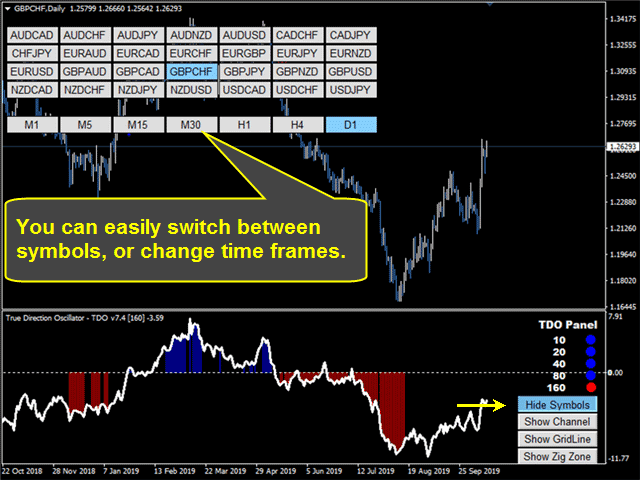
                      1.1. Added a "Symbol Switch Panel" to make it easy for user to switch between different charts.
                      1.2. "Symbol Switch Panel" can be from User inputs or from Market Watch window.
                      1.3. "Symbol Switch Panel" can change chart for current window or open it in a new one.
                      1.4. User can use "Symbol Switch Panel" to change current chart time frame.
                      1.5. User control the number of buttons on "Symbol Switch Panel". He can make them appear on main chart or TDO window.
                      ---------------------------------------------------------
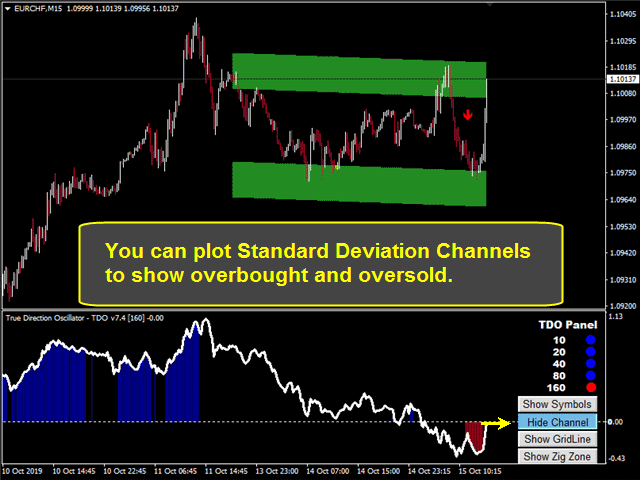
                      2.1 Added a "Price Channel".
                      2.2 User can choose between "Standard Deviation" or "Linear Regression" channels.
                      2.3 User can draw channels as a ray or make them as background.
                      ---------------------------------------------------------
                      3.1 Added a "Price Grid".
                      3.2 User can choose between "Automatic Grid" and "Customer Grid".
                      3.3 User can multiply distance between grid levels.
                      버전 3.1 2018.04.27
                      1. Made a revision to the code to make sure that there are no bugs.
                      2. Made inputs much more user friendly.
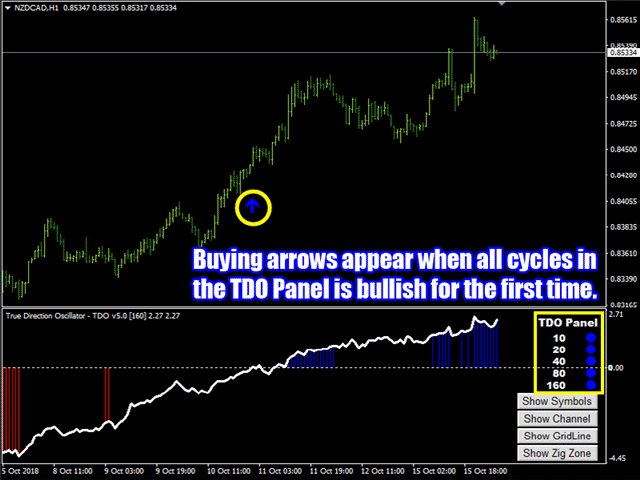
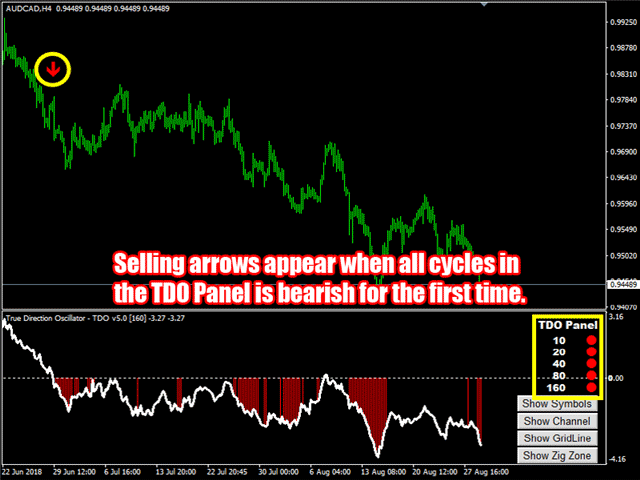
                      3. Added arrow signals to follow the trend.
                      4. Added a multi time period panel.
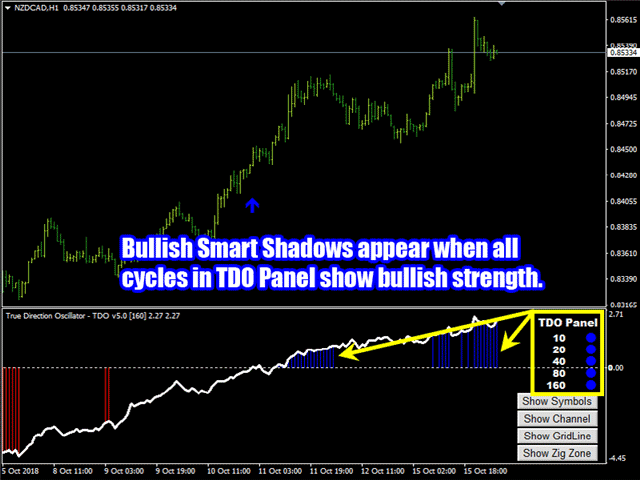
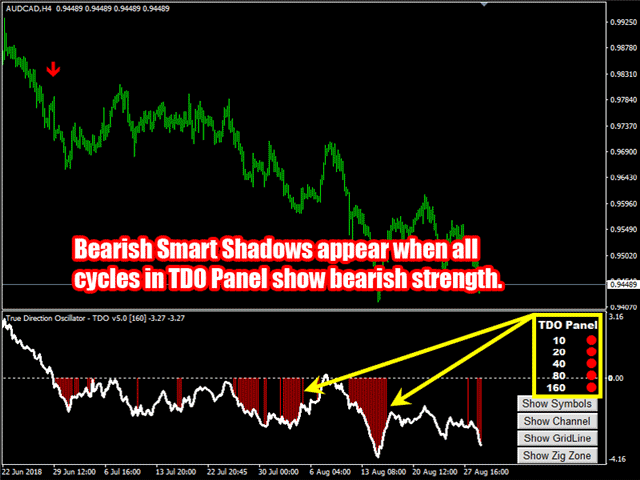
                      5. Made shadow with color when trend is strong.
                      6. Added alerts when a new arrow appear.
                      7. Added alerts when multi time period panel is in-line.
                      버전 1.4 2016.01.04
                      In this version I tested the code and fixed all possible logical errors. The code now is more clear than before.