Is 3 SMA Spread
- 지표
- Oleksandr Medviediev
- 버전: 1.4
- 업데이트됨: 16 12월 2021
- 활성화: 20
3-SMA-Spread - 교차 상품 시장 지표 각 상품의 입력에 비례하여 폭을 변경하는 시각적 iChannel(아래 공식 참조) 구축을 통해 3개의 서로 다른 상품을 확산합니다(SMA 기반 "통계 차익거래"). .
핵심 원칙: 각 불일치 이후 "그들의" 기호 가격을 따르는 가격 라인은 지속적으로 전체 "합성" 중앙으로 돌아가는 경향이 있습니다. 즉, 3개의 "관련" 상품//쌍으로 구성된 시스템은 지속적으로 평균으로 되돌리기 위해 노력합니다(소위 "평균-반전" 효과).
모든 기기/TF에서 작동합니다(사용된 모든 기기에 대해 차트/TF를 열어야 함)
동기화가 이루어졌습니다. 현재 막대가 닫힌 후 - 다시 칠하지 않음/다시 그릴 수 없음
모든 변수에 사용 가능한 "SetIndexBuffer"(EA에서 사용 가능)
4자리 및 5자리 가격 자동 감지
iChannel을 구축하는 데 다음 공식이 사용되었습니다.
가격선 기호-1 - 표시기가 켜져 있는 차트
가격선 기호-2 - 음의 상관관계가 있는 상품에 대한 "reversal=true" 모드 추가
가격선 기호-3 - 음의 상관관계가 있는 상품에 대한 рlus "reversal=true" 모드
중간선 М = "합성" 중앙(S1 + S2 + S3)/3(노란색 점선)
iChannel = (S1-M) + (S2-M) + (S3-M) (빨간색 및 녹색 점)
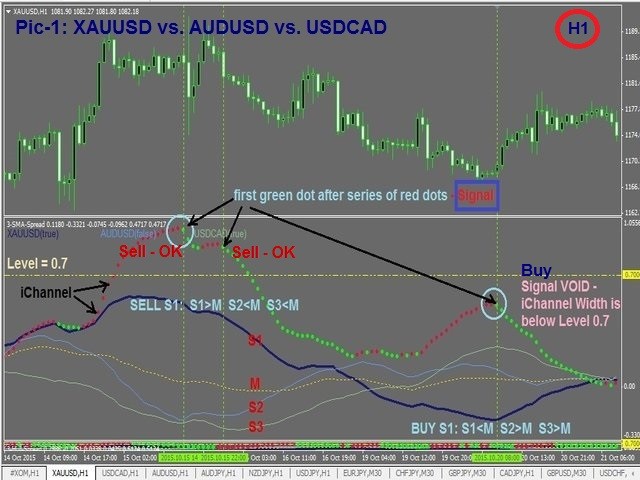
이 공식을 사용하면 다양한 상품을 하나의 차트에 결합할 수 있습니다(그림 1 참조). 예:
XAUUSD ~1100
AUDUSD ~0.7
USDCAD ~1.33
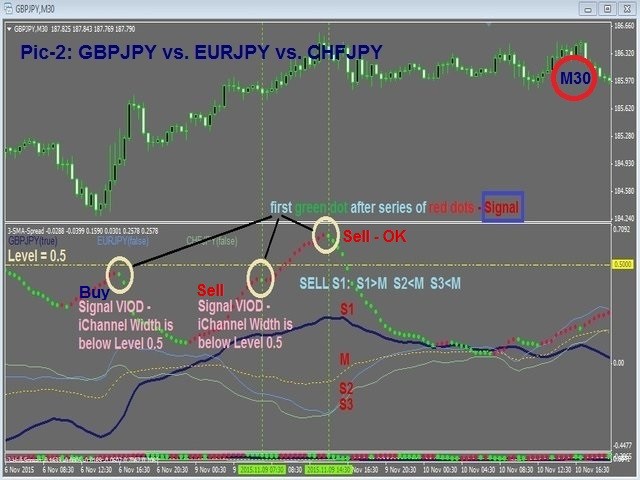
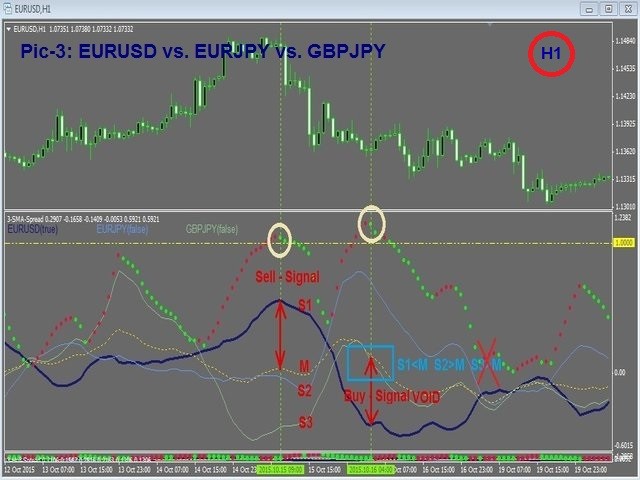
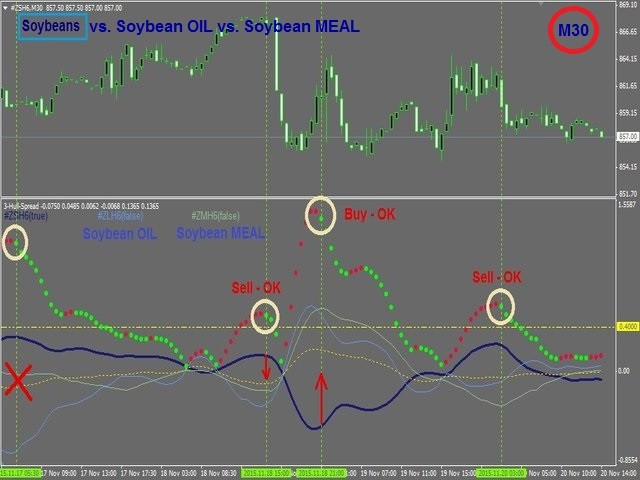
신호 조건:
#1. iChannel의 너비가 좁아지기 시작했습니다(빨간색 점 다음에 첫 번째 녹색 점).
#2. iChannel 너비 > 레벨
#삼. 가격선 S1은 중간선 М의 한쪽에 있고, 가격선 S2와 S3은 중간선 М의 반대쪽에 있습니다. 다음과 같습니다.
신호 구매 기호-1: S1<M S2>M S3>M -- 참고: iChannel 너비(빨간색 및 녹색 점)가 더 넓어지거나 좁아지고 있습니다.
신호 SELL 기호-1: S1>M S2<M S3<M -- 참고: iChannel 너비(빨간색 및 녹색 점)가 더 넓어지거나 좁아집니다.
매개변수:
Inp_Fast_MA - 빠른 이동 평균 기간
Inp_Slow_MA - 느린 이동 평균 기간
Inp_MA_Method - SMA의 매개변수
Inp_MA_PriceType - SMA의 매개변수
Inp_Symbol_1 - 기호-1(기본적으로 GBPJPY)
Inp_Symbol_2 - 기호-2(기본적으로 EURJPY)
Inp_S2_revers - Symbol-2가 Symbol-1과 음의 상관 관계를 갖는 경우 =True입니다.
Inp_Symbol_3 - 기호-3(기본적으로 CHFJPY)
Inp_S3_revers - Symbol-3이 Symbol-1과 음의 상관 관계를 갖는 경우 =True입니다.
기타 유용한 정보:
상관관계가 높은 3원 계측기의 일반적인 예:
GOLD 대 금 형성 통화 쌍 AUDUSD, USDCAD 및 NZDUSD
GOLD 대 원유/WTI 및 브렌트/BRN
주식 대 지수(S&P500, NASDAQ, DJIA 등)
2016년 3월 대두박(ZMH16) vs 대두유 2016년 3월(ZLH16) vs 2016년 3월 대두(ZSH16) 등
120개의 클래식 3방향 통화쌍 조합 전체 목록 - 댓글 섹션의 링크를 참조하세요.
참고: 클래식 3방향 조합(3개 통화만 참여)의 경우 중간선 М은 항상 직선입니다.