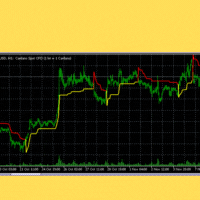
The TrendChannelTracker Indicator is an innovative Forex trading tool. This indicator, which is based on the standard Stochastic Oscillator, provides traders with a unique and simplified method for observing market trends. In contrast to the traditional Stochastic Oscillator, which is shown at the bottom of the chart, the TrendChannelTracker Indicator is built into the price action itself. This removes the need for traders to continually switch their attention between the oscillator and the price action, making it simpler to identify market trends and make smart trading decisions.
In addition, the TrendChannelTracker Indicator incorporates a trend channel that reveals the trend’s momentum. Along with being able to spot overbought and oversold signals, this makes it a powerful tool for traders who want to improve their strategy. The Indicator’s Stochastic values vary from 0 to 100, giving traders a straightforward picture of market conditions.
TrendChannelTracker Strategy
The TrendChannelTracker merges a trend channel with the stochastic indicator and computation to offer traders vital information about the momentum of the trend. The TrendChannelTracker Indicator can help traders find oversold and overbought signals inside the trend channel by combining these two features.
Traders should pay close attention to the stochastic levels, which vary from 0 to 100 when using the TrendChannelTracker Indicator. If the levels drop below 20, it signals that the market is oversold, and traders may consider opening a long position. In contrast, if the level increases over 80, this indicates that the market is overbought and traders should consider taking a short position.
Traders should also closely monitor the trend channel to assess the market’s general direction. It is also crucial to remember that the TrendChannelTracker Indicator should be used in combination with other technical analysis tools and a good trading strategy to make better trading decisions.
Traders should also adopt effective risk management tactics and constantly be prepared for the likelihood of market volatility.
Buy Signal
Locate the trend channel and verify if it is bullish.
Look for oversold signals, which are formed when the Stochastic levels fall below 20.
Verify the buy signals using other chart patterns or technical indicators.
You may initiate a long position when the Stochastic indicators climb from the oversold region and cross above 20.
Set a stop loss order slightly below the trend channel or according to your money management plan.
You can employ a trailing stop or take-profit order to close the position when the Stochastic levels hit the other extreme.
Sell Signal
Determine the trend channel and verify if it is bearish.
Keep an eye out for overbought signs, which appear when the Stochastic level climbs over 80.
Validate the sell signals using other chart patterns or technical indicators.
You may open a short trade when the Stochastic levels drop from the overbought zone and cross below 80.
You can set a stop-loss order slightly above the trend channel or according to your money management plan.
You may employ a trailing stop or a take-profit order to close the position when the Stochastic levels hit the other extreme.


