VisualVol EURUSD
- 지표
- Maxim Kuznetsov
- 버전: 1.0
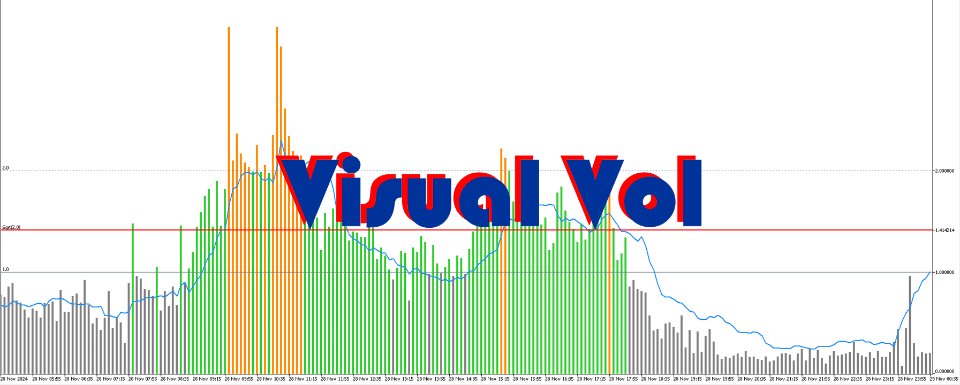
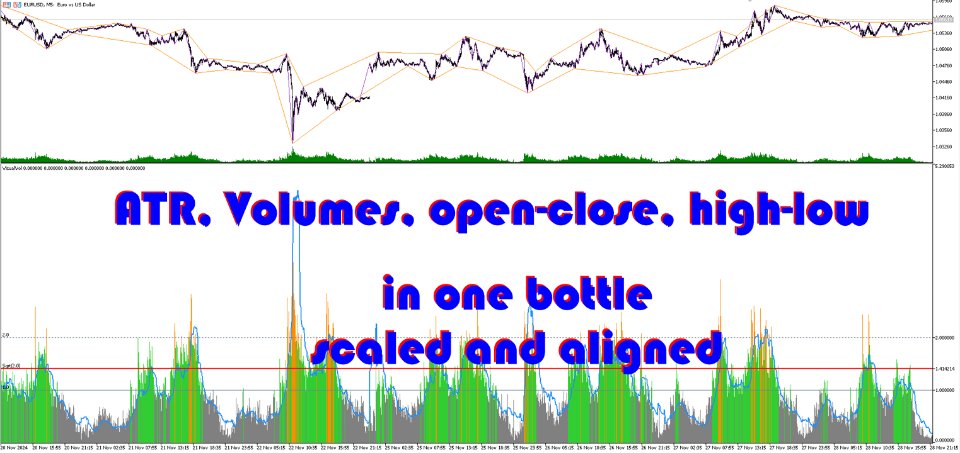
The indicator highlights the points that a professional trader sees in ordinary indicators. VisualVol visually displays different volatility indicators on a single scale and a common align. Highlights the excess of volume indicators in color. At the same time, Tick and Real Volume, Actual range, ATR, candle size and return (open-close difference) can be displayed. Thanks to VisualVol, you will see the market periods and the right time for different trading operations.
This version is intended for training, testing and Introduction to VisualVol (https://www.mql5.com/en/market/product/127472) Limited to EURUSD only
The indicator displays:
- The tick volume is in the form of a colored histogram with "thick" lines.
- the real volume in the form of a simple histogram
- the distance |open-close| and the size of the high-low candle in the form of lines
- valid range and ATR (average valid range), also in the form of lines
The levels are marked on the indicator:
- 1.0 is the average level. Indicators below 1.0 are readings below the average value. The histogram of the tick volume less than 1.0 shows gray bars, green bars above it
- 1.414 - sqrt(2). Normal market activity.
- 2.0 is a critical level. An indicator above 2.0 indicates a sharp movement and very high volatility. The histogram of the tick volume will be orange in this case
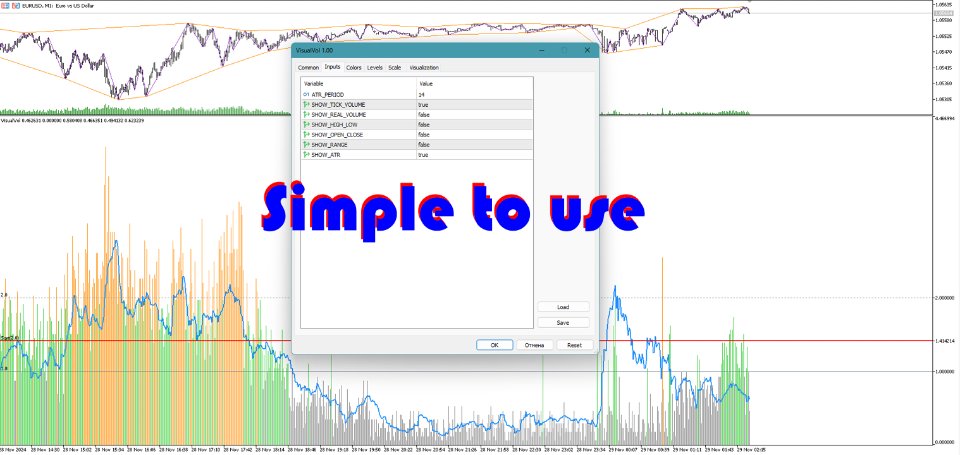
Parameters
ATR_PERIOD - the period of the displayed ATR
Tick volume, candle size and ATR are included
The real volume, the open-close and the actual range are off. If you need them, just turn them on
Recommendations for use
Use night scalping techniques at values below 1.0 (with a gray volume histogram).

